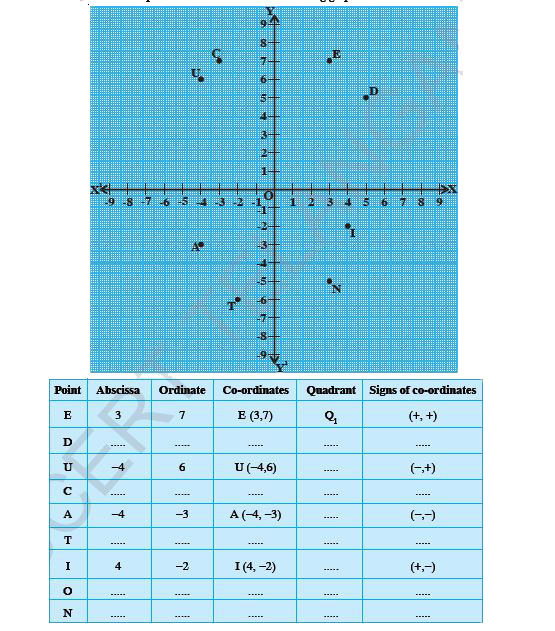
Complete the table based on the following graph.  Solution in Gujrati
Step by step video & image solution for Complete the table based on the following graph. by Maths experts to help you in doubts & scoring excellent marks in Class 9 exams.
Updated on:21/07/2023Topper's Solved these Questions
- CO-ORDINATE GEOMETRYBOOK - NCERT GUJARATICHAPTER - CO-ORDINATE GEOMETRYEXERCISE - Exercise 5.1
1 Videos
- CO-ORDINATE GEOMETRYBOOK - NCERT GUJARATICHAPTER - CO-ORDINATE GEOMETRYEXERCISE - Exercise 5.2
10 Videos
- CIRCLESBOOK - NCERT GUJARATICHAPTER - CIRCLESEXERCISE - EXERCISE 12.5
4 Videos
- GEOMETRICAL CONSTRUCTIONSBOOK - NCERT GUJARATICHAPTER - GEOMETRICAL CONSTRUCTIONSEXERCISE - EXERCISE 13.2
2 Videos
Similar Questions
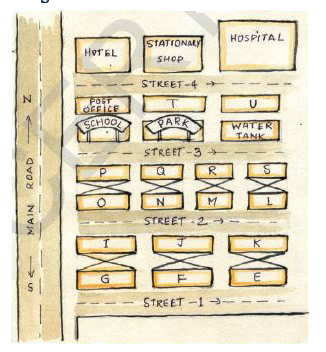
In a locality, there is a man road along North-South direction.
The man is given below. With the help of the picture answer the following questions.
(i) What is the 3rd object on the left side in street no 3?
(ii) Find the name of the 2nd house which is in right side of street 2.
(iii) Locate the position of Mr. K's house.
(iv) How do you describe the position of the post office.
(v) How do you describe the location of the hospital?

View SolutionWhich the quadrant in which of the following points lie?
(i) (-2,3) (ii) (5,-3) (iii) (4,2) (iv) (-7,-6)
(v) (0,8) (vi) (3,0) (vii) (-4,0) (viii) (0,-6)
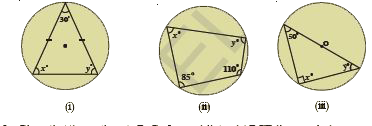
View SolutionFind the values of x and y in the figures given below

View SolutionConstruct △XYZ in which ∠Y=30∘, ∠Z=60∘ and XY + YZ + ZX = 10 cm.
View SolutionMatch the following lists:

View SolutionHow many lines of symmetry does the above figure have ?
View SolutionWhich of the following are correct chain isomers of butane ? (i)
View SolutionDetermine the point of symmetry of a regular hexagon.
View SolutionDtermine the images of the following figure about the given line :
View SolutionMatch the following Column A to Column B

View SolutionMatch the following Column A to Column B

View SolutionMatch the following Column A to Column B

View SolutionThe inequation represented by the graph given below is :
View SolutionThe inequation that best describes the graph given below is _________
View SolutionThe inequation that best describes the following graph is _________
View SolutionWhich inequations represent the shaded region in the given figure
View Solution
