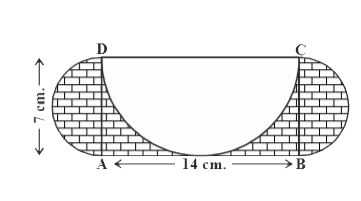
ABCD is a rectangle with AB=14cm and BC=7cm. Taking DC, BC and AD as diameters, three semicircles are drawn as shown in the figure. Find the area of shaded region.Solution in Gujrati
Step by step video & image solution for ABCD is a rectangle with AB=14cm and BC=7cm. Taking DC, BC and AD as diameters, three semicircles are drawn as shown in the figure. Find the area of shaded region. by Maths experts to help you in doubts & scoring excellent marks in Class 10 exams.
Updated on:21/07/2023Topper's Solved these Questions
- TANGENTS AND SECANTS TO A CIRCLEBOOK - NCERT GUJARATICHAPTER - TANGENTS AND SECANTS TO A CIRCLEEXERCISE - What we have discussed
4 Videos
- TANGENTS AND SECANTS TO A CIRCLEBOOK - NCERT GUJARATICHAPTER - TANGENTS AND SECANTS TO A CIRCLEEXERCISE - Do this
6 Videos
- TANGENTS AND SECANTS TO A CIRCLEBOOK - NCERT GUJARATICHAPTER - TANGENTS AND SECANTS TO A CIRCLEEXERCISE - Exercise (9.3)
8 Videos
- STATISTICSBOOK - NCERT GUJARATICHAPTER - STATISTICSEXERCISE - THINK AND DISCUSS
8 Videos
- TRIGONOMETRY BOOK - NCERT GUJARATICHAPTER - TRIGONOMETRY EXERCISE - OPTIONAL EXERCISE
6 Videos
Similar Questions
A Tangent to a circle is a line which touches the circle at only one point.
View SolutionDraw a circle with any radius. Draw four tangents at different points. How many more tangets can you draw to this circle ?

View SolutionIn a circle of radius 10cm , a chord subtends a right angle at the centre. Find the area of the corresponding : (useπ=3.14)
i. Minor segment
ii. Major segment
View SolutionThe mean value can be calculated from both ungrouped and grouped data. Which one do you think is more accurate? Why?
View SolutionProve that cotθ−cosθcotθ+cosθ=cosecθ−1cosecθ+1
View SolutionDetermine the point of symmetry of a regular hexagon.
View SolutionMatch the following Column A to Column B

View SolutionMatch the following Column A to Column B

View SolutionFind the area of figure given below.

View SolutionFind the area of the figure given below.

View SolutionThe area of the shaded part in the figure given below is ______.

View SolutionThe inequation represented by the graph given below is :
View SolutionThe inequation that best describes the graph given below is _________
View SolutionThe inequation that best describes the following graph is _________
View SolutionWhich inequations represent the shaded region in the given figure
View Solution
