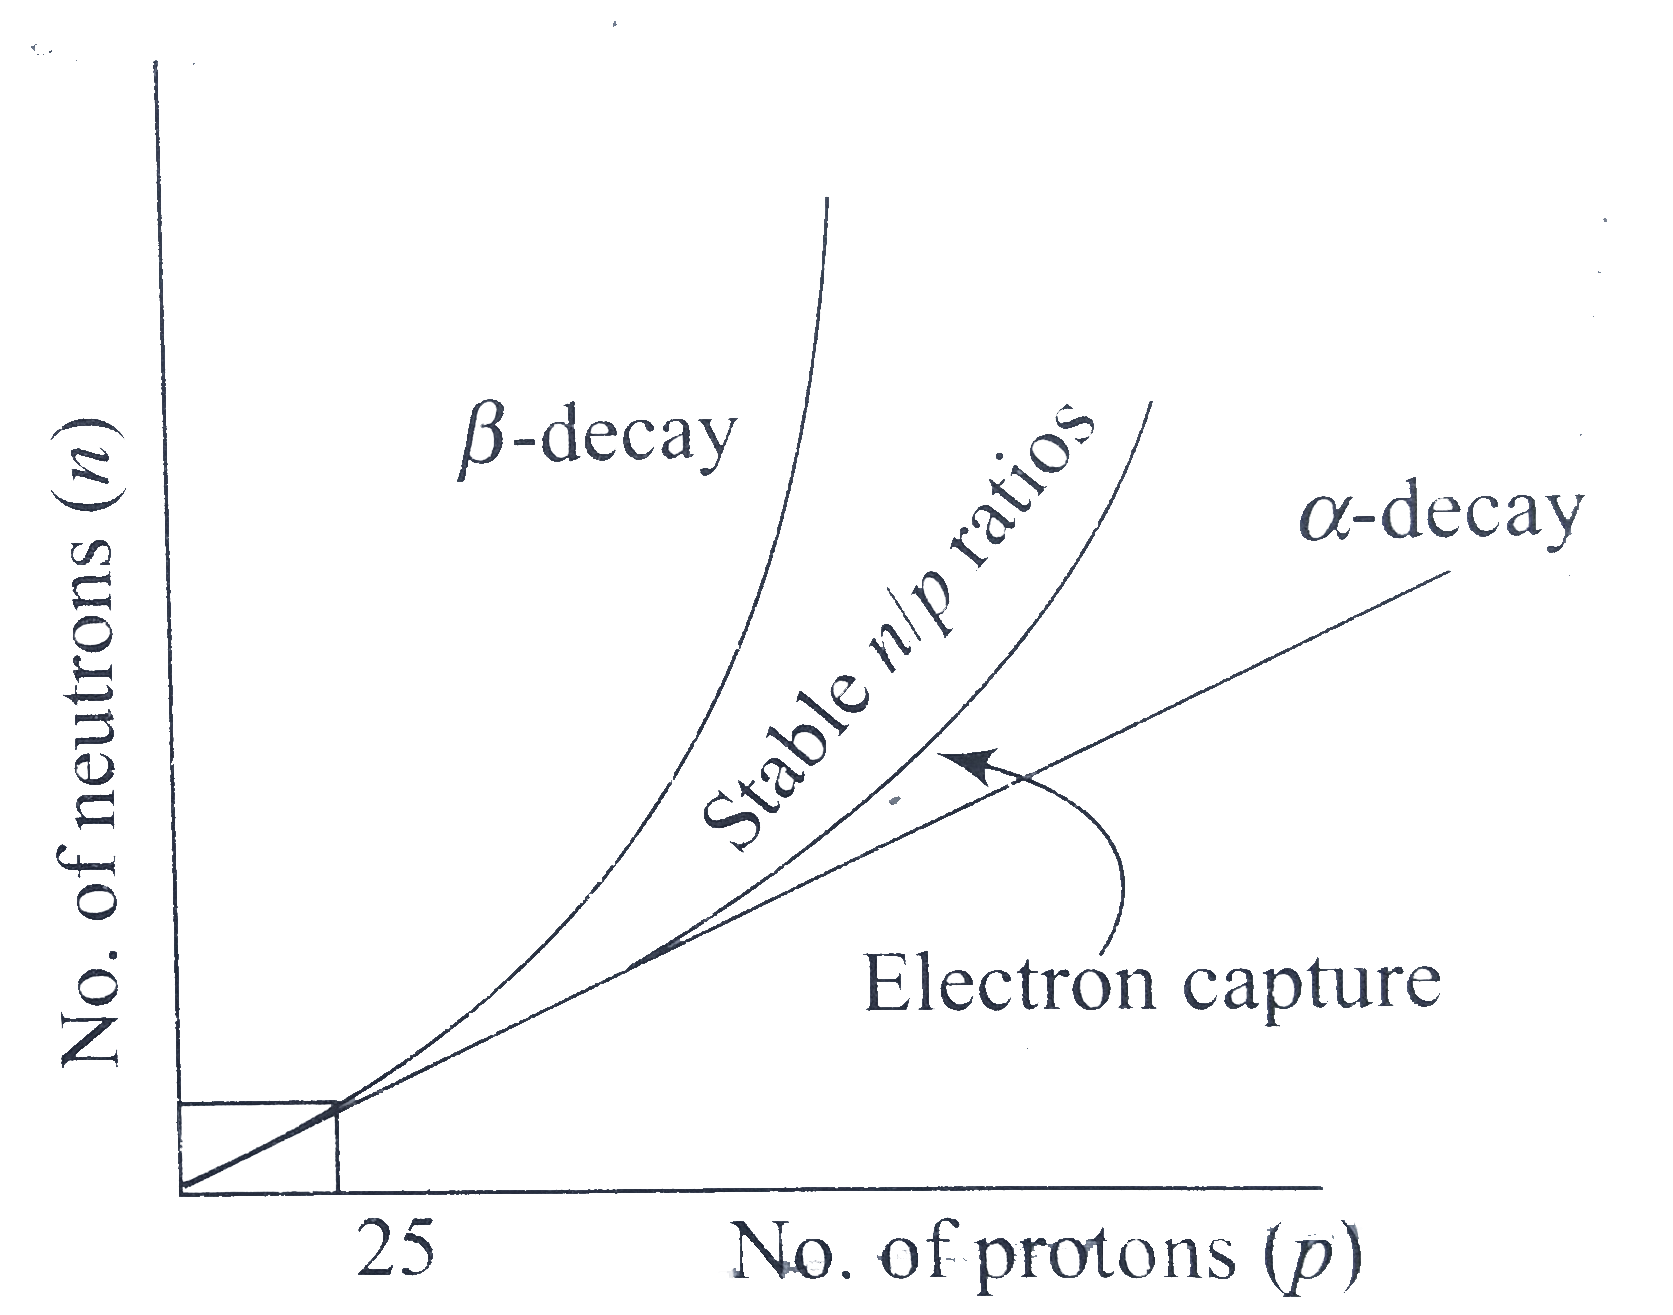
A plot of the number of neutrons (n) against the number of protons (p) of stable nuclei exhibits upward deviation from linearity for atomic number, Z > 20. For an unstable nucleus having n, p ratio less than 1, the possible mode(s) of decay is(are)
β−-decay (βemission)
orbital or K- electron capture
neutron emission
β+-decay (positron emission).
The correct Answer is:B, D
Nuclides with Z > 20 lying below the stability belt decay by β+ (positorn) emission or K-electron capture so, that n,p ratio increases to (N+1)/(Z−1).
Topper's Solved these Questions
- RADIOACTIVITY AND NUCLEAR CHEMISTRY BOOK - MTG-WBJEECHAPTER - RADIOACTIVITY AND NUCLEAR CHEMISTRY EXERCISE - WB JEE PREVIOUS YEARS QUESTIONS (CATEGORY 1 : SINGLE OPTION CORRECT TYPE)
12 Videos
- RADIOACTIVITY AND NUCLEAR CHEMISTRY BOOK - MTG-WBJEECHAPTER - RADIOACTIVITY AND NUCLEAR CHEMISTRY EXERCISE - WB JEE PREVIOUS YEARS QUESTIONS (CATEGORY 2 : SINGLE OPTION CORRECT TYPE)
1 Videos
- RADIOACTIVITY AND NUCLEAR CHEMISTRY BOOK - MTG-WBJEECHAPTER - RADIOACTIVITY AND NUCLEAR CHEMISTRY EXERCISE - WB JEE WORKOUT (CATEGORY 2 : SINGLE OPTION CORRECT TYPE)
15 Videos
- PRINCIPLES OF QUALITATIVE ANALYSISBOOK - MTG-WBJEECHAPTER - PRINCIPLES OF QUALITATIVE ANALYSISEXERCISE - WB JEE PREVIOUS YEARS QUESTIONS (CATEGORY 2 : Single Option Correct Type)
2 Videos
- REDOX EQUILIBRIABOOK - MTG-WBJEECHAPTER - REDOX EQUILIBRIAEXERCISE - WB JEE PREVIOUS YEARS QUESTIONS
5 Videos
Similar Questions
A plot of the number of neutrons (n) against the number of protons (p) of stable nuclei exhibits upward deviation from linearity for atomic number, Z>20. For an unstable nucleus having n/p ratio less than 1, the possible mode (s) of decay is (are)
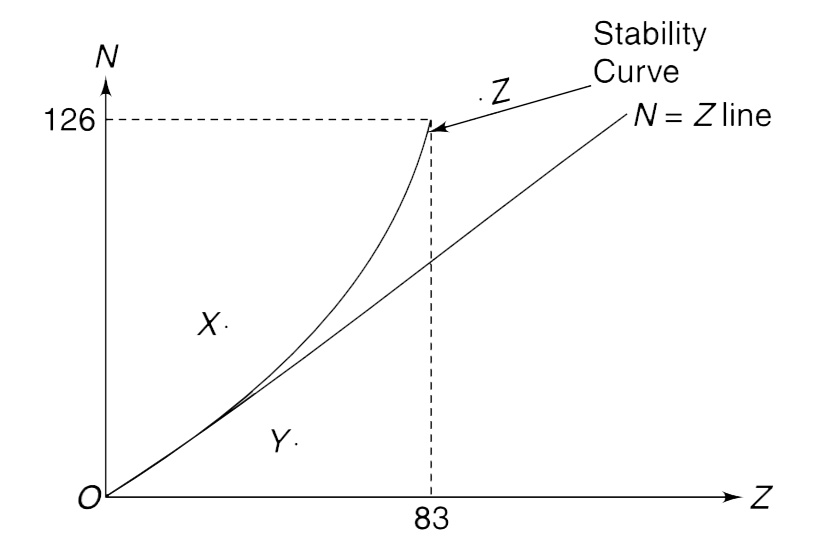
View SolutionThe figure shows a plot of number of neutron (N) versus number of protons (z) in all stable nuclei found in nature. What kind of decay are nuclei X,Y and Z expected to show?

View Solution
Knowledge Check
A plot of the number of neutrons (n) against the number of protons (p) of stable nuclei exhibits upward deviation from linearity for atomic number, Z>20. For an unstable nucleus having n/p ratio less than 1, the possible mode (s) of decay is (are)
Aβ−−decay(β−emission)Borbital or K- electron captureCneutron emissonDβ+−dacay(positron emission)A plot of the number of neutrons (n) against the number of protons (p) of stable nuclei exhibits upward deviation from linearity for atomic number, Z>20. For an unstable nucleus having n/p ratio less than 1, the possible mode (s) of decay is (are)
Aβ− -decay (β-emission)Borbital and K-electron captureCneutron emissionDβ+ -decay (positron emission)A plot of the number of neutrons (n) against the number of protons (p) of stable nuclei exhibits upward deviation from linearity for atomic number, Z>20. For an unstable nucleus having n/p ratio less than 1, the possible mode (s) of decay is (are)
Aβ−− decay (β emission)BOrbital or K-electron captureCNeutron emissionDβ+− decay (positron emission)
In Tritium (T), the number of protons (P) and neutrons (N) respectively are
View SolutionStatement : The plot of atomic number ( y -axis ) versus number of neutrons ( x -axis ) for stable nuclei shows a curvature towards x-axis fron the line of 45∘ slope as the atomic number is increased .
Explanation : proton -proton electrostatic repulsions begin to overcome attracive forces involving protons and neutrons in heavier nuclides.
View SolutionIn most stable nuclei neutron number N and proton number Z has the relation
View SolutionVarious rules of thumb have seen proposed by the scientific community to expalin the mode of radioactive decay by various radioisotopes. One of the major rules is called the n/p ratio. If all the known isotopes of the elemnts are plotted on a graph of number of neutrons (n) versus number of protons (p), it is observed that all isotopes lying outside of a ''stable'' n/p ratio region are radioactive as shown fig. The graph exhibits straight line behaviour with unit slope up to p=25. Above p=25, tgose isotopes with n/p ratios lying above the stable region usually undergo beta decay. Very heavy isotopes (p>83) are unstable because of their relativley large nuclei and they undergo alpha decay. Gamma ray emission does not involve the release of a particle. It represnts a change in an atom from a higher energy level to a lower energy level.

How would the radioisotope of magnesium with atomic mass 27 undergo radioactive decay?.
View Solution
