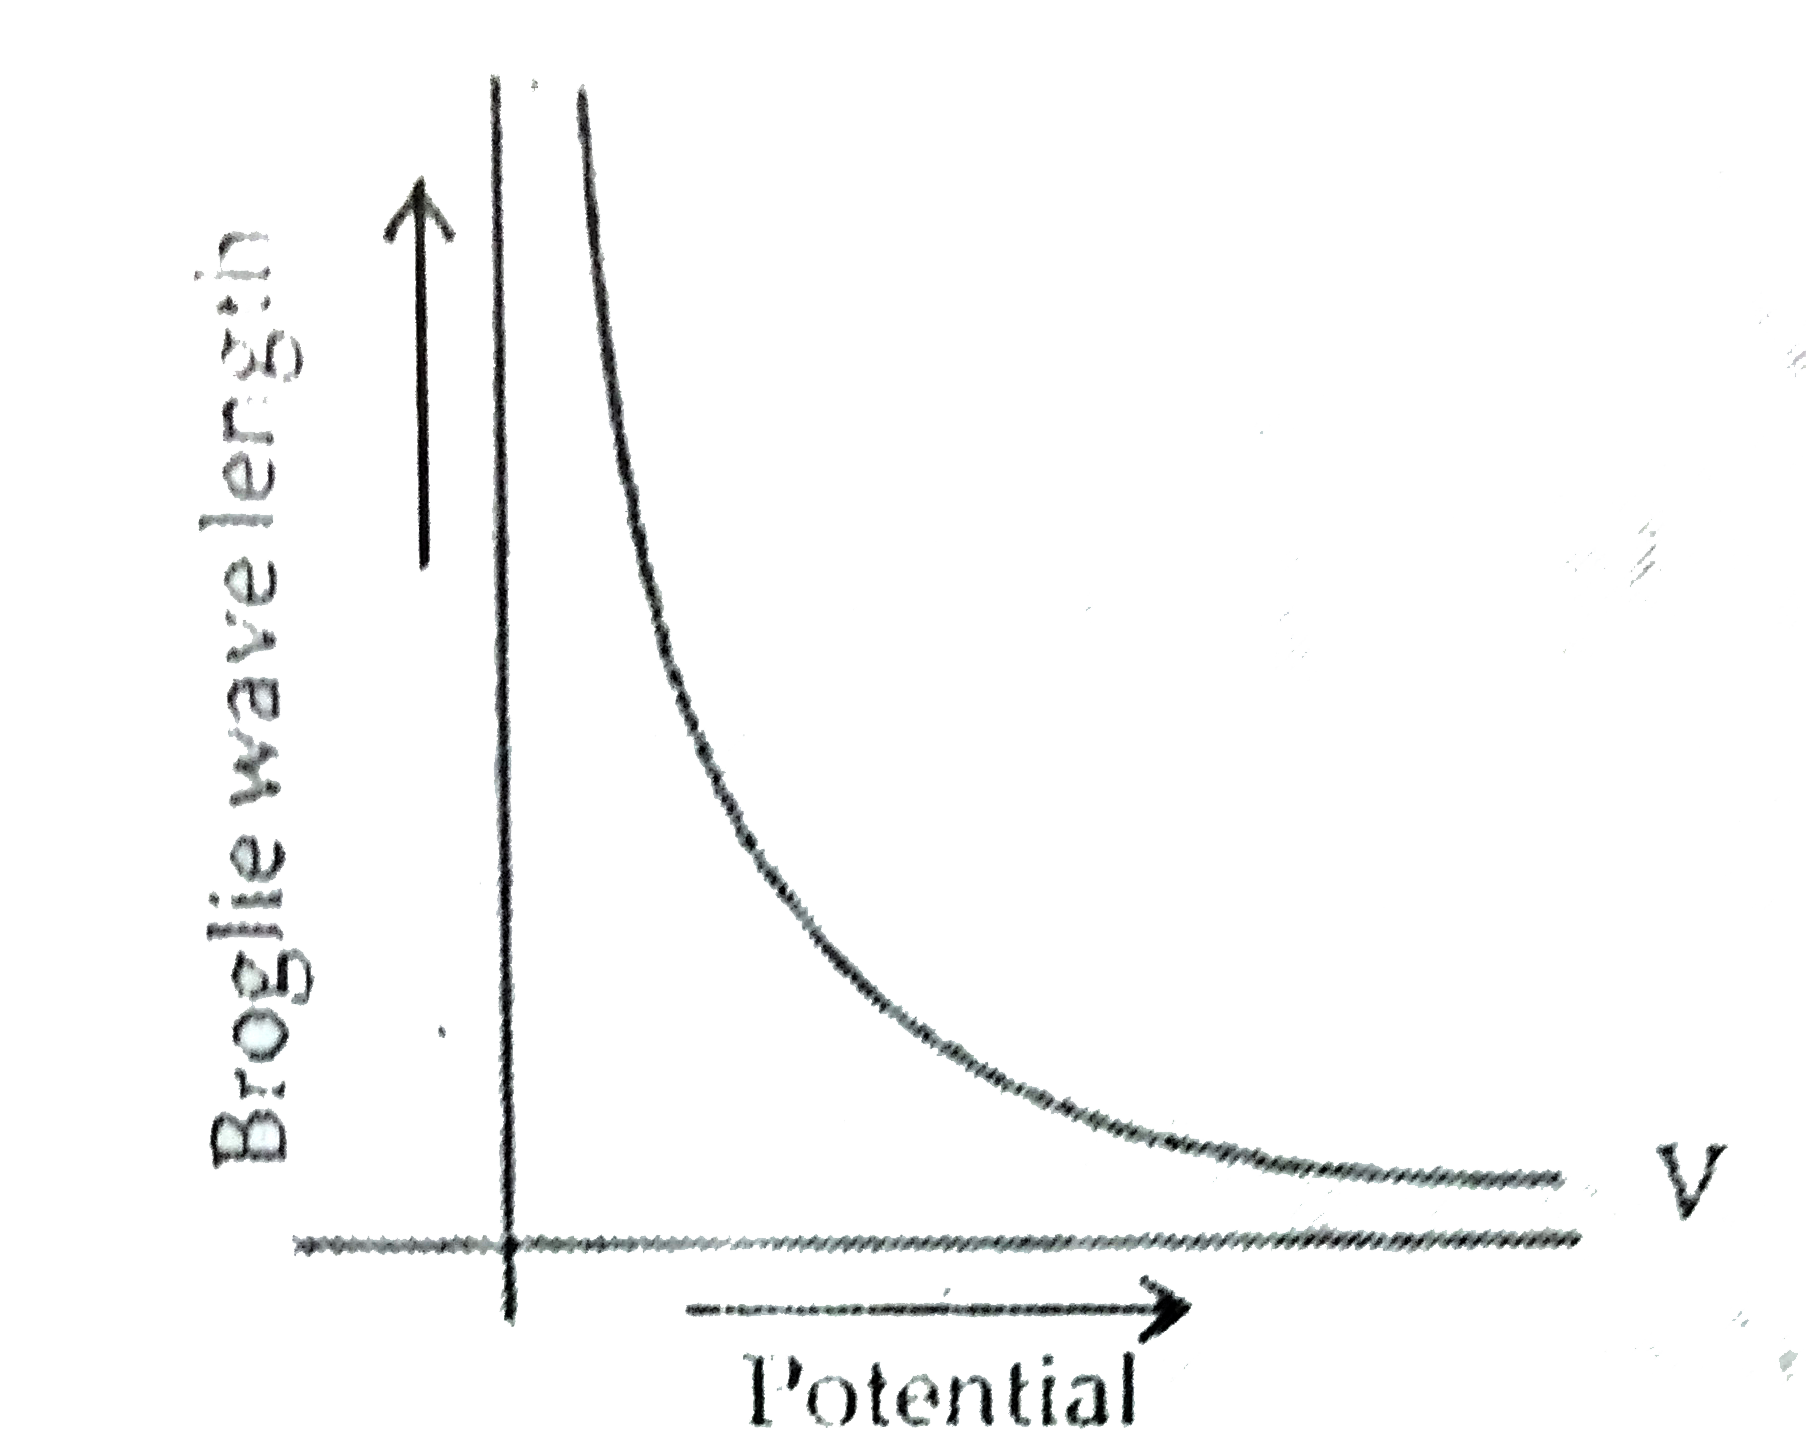
Show graphically, the variation of the de-Broglie wavelength λ with the potential V through which an electron is accelerated from rest.
Video Solution
Text Solution
|
Topper's Solved these Questions
- XII BOARDSBOOK - XII BOARDS PREVIOUS YEARCHAPTER - XII BOARDSEXERCISE - SET-II, DELHI BOARD
8 Videos
- XII BOARDSBOOK - XII BOARDS PREVIOUS YEARCHAPTER - XII BOARDSEXERCISE - SET-III, DELHI BOARD
8 Videos
- XII BOARDSBOOK - XII BOARDS PREVIOUS YEARCHAPTER - XII BOARDSEXERCISE - SET -III
6 Videos
- SAMPLE PAPER 2019BOOK - XII BOARDS PREVIOUS YEARCHAPTER - SAMPLE PAPER 2019EXERCISE - SECTION D
6 Videos
Similar Questions
Knowledge Check
Which of the following graphs shows the variation of de-Broglie wavelength with potential through which a particle of charge q and mass m is accelerated ?
A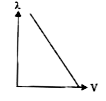 B
B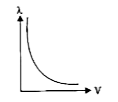 C
C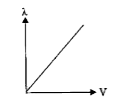 D
D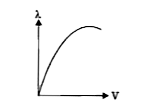
The ratio of de-Broglie wavelength associated with two electrons accelerated through 25V and 36V is
A25/36B36/25C5/6D6/5The de Broglie wavelength λ of an electron accelerated through a potential V in volts is
A1.227√VnmB0.1227√VnmC0.01227√VnmD12.27√Vnm
What is the de-Broglie wavelength associated with an electron moving with an electron, accelerated through a potential difference of 100 volt?
View SolutionFind the ratio of de-Broglie wavelengths associated with two electrons accelerated through 25V and 36V.
View SolutionOn the basis of the de Broglie hypothesis, obtain the expression for the de Broglie wavelength associated with an electron accelerated from rest through a p.d. V.
View SolutionWhat is the de-Broglie wavelength associated with an electron accelerated through a potential of 100V ?
View SolutionPlot a graph of the de - Broglie wavelength associated with electron as a function of accelerating potential .
View Solution

