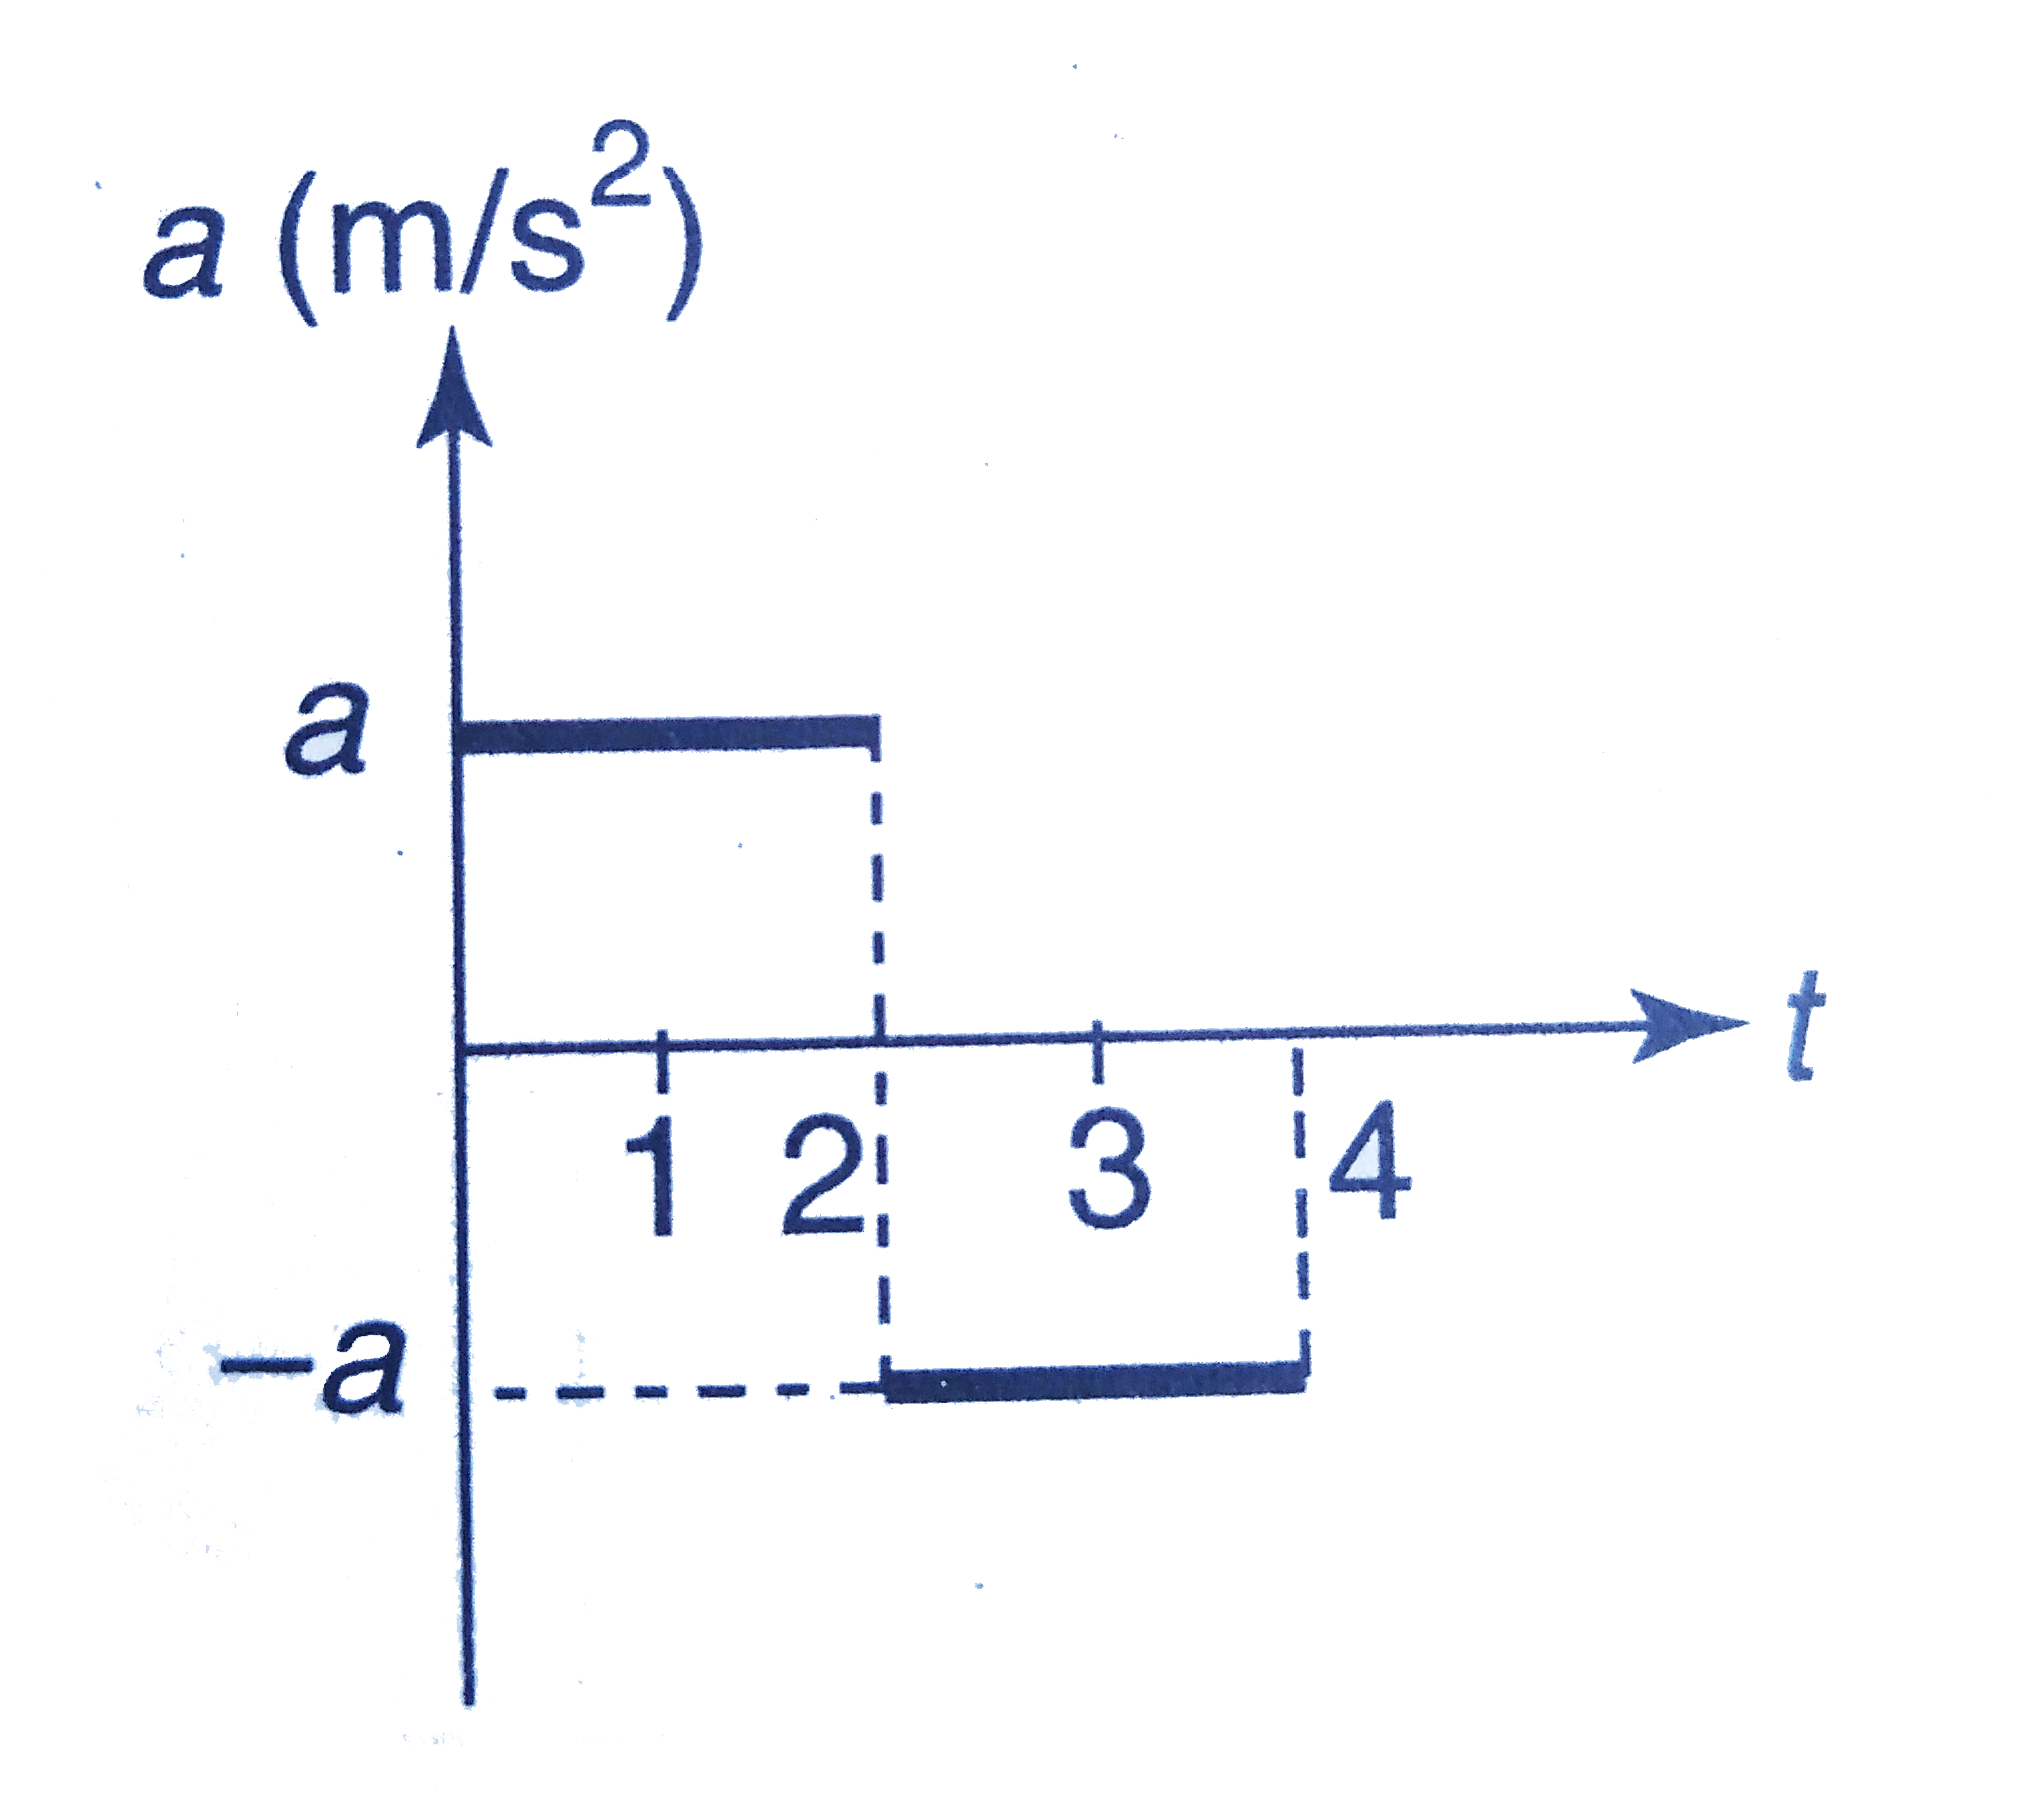
The a -t graph is shown in the figure. The maximum velocity attained by the body from rest will be
 Solution in Telugu
Area under acceleration - time graph gives change in velocity
V−0=12×11×10=55 m/s
Topper's Solved these Questions
- BOOK - AAKASH SERIESCHAPTER - MOTION IN A STRAIGHT LINE EXERCISE - EXERCISE -I58videos
MOTION IN A STRAIGHT LINE
- BOOK - AAKASH SERIESCHAPTER - MOTION IN A STRAIGHT LINE EXERCISE - EXERCISE -II80videos
MOTION IN A STRAIGHT LINE
- BOOK - AAKASH SERIESCHAPTER - MOTION IN A PLANEEXERCISE - QUESTION FOR DESCRIPTIVE ANSWER7videos
MOTION IN A PLANE
- BOOK - AAKASH SERIESCHAPTER - MOVING CHARGES AND MAGNETISMEXERCISE - EXERCISE-III45videos
MOVING CHARGES AND MAGNETISM
Similar Questions
The ratio of the numerical values of the average velocity and average speed of a body is always
01:40View SolutionA person travels along a straight road for half the distance with velocity V1 and the remaining half distance with velocity V2 the average velocity is given by
02:43View SolutionA particle is projected over a triangle from one end of a horizontal base and garzing the vertex falls on the other end of the base . If α and β the base angles and θ the angle of projection then show that tanθ=tanα+tanβ.
02:42View SolutionA proton, a deuteron and an a particle having same momentum enter a uniform magnetic field at right angles to the field. Then the ratio of their angular momenta during their motion in the magnetic field is
03:41View SolutionA body starts from rest at time t = 0 , the acceleration time graph is shown in the figure . The maximum velocity attained by the body will be
01:55View SolutionThe graph shown the variation of velocity of a rocket with time. Then, the maximum height attained by the rocket is.
01:56View SolutionA particle starts from rest and undergoes an acceleration as shown in figure. The velocity-time graph from figure will have a shape.
 01:51View Solution
In figure shown, the graph shows the variation of acceleration of body with time t . The velcocity of the body at t = 0 is zero. The velocity of the body at t = 30 s is.
03:53View SolutionA rocket is projected vertically upwards and its time velocity graph is shown in the figure-1.115. The maximum height attained by the rocket is :
03:09View SolutionA particle starts moving from rest in a from rest in a straight line. Its acceleration vs time (a - t) graph is shown in figure. The speed of particle is maximum at.
03:09View SolutionA particle starting from rest undergoes a rectilinear motion with acceleration a. The variation of a with time t is shown below. The maximum velocity attained by the particle during its motion is
07:22View SolutionThe graph in figure shows the velocity v versus time t for a body. Which of the graphs shown in figure represents the correesponding acceleration versus time graphs ?
03:05View SolutionA rocket is launched upward from the earth surface whose velocity time graph shown in figure. Then maximum height attained by the rocket is :-
 02:51View Solution
A rocket is launched upward from the earth surface whose velocity time graph shown in figure. Then maximum height attained by the rocket is :-
02:54View SolutionAcceleration -time graph of a body starts from rest as shown below :

Draw the velocity-time graph using the above graph01:45View Solution

