The velocity and time graph for a particle moving in a straight line s shown in the figure. Then, the average velocity between t=4 s and t=6 s is _____
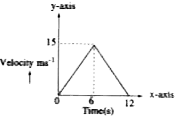
10.5ms−1
12.5ms−1
7.5ms−1
9.5ms−1
The correct Answer is:B
Topper's Solved these Questions
- MOTION IN A STRAIGHT LINE BOOK - AAKASH SERIESCHAPTER - MOTION IN A STRAIGHT LINE EXERCISE - PRACTICE EXERCISE
58 Videos
- MOTION IN A STRAIGHT LINE BOOK - AAKASH SERIESCHAPTER - MOTION IN A STRAIGHT LINE EXERCISE - problems
47 Videos
- MOTION IN A STRAIGHT LINE BOOK - AAKASH SERIESCHAPTER - MOTION IN A STRAIGHT LINE EXERCISE - EXERCISE -I
58 Videos
- MOTION IN A PLANEBOOK - AAKASH SERIESCHAPTER - MOTION IN A PLANEEXERCISE - QUESTION FOR DESCRIPTIVE ANSWER
7 Videos
- MOVING CHARGES AND MAGNETISMBOOK - AAKASH SERIESCHAPTER - MOVING CHARGES AND MAGNETISMEXERCISE - EXERCISE-III
45 Videos
Similar Questions
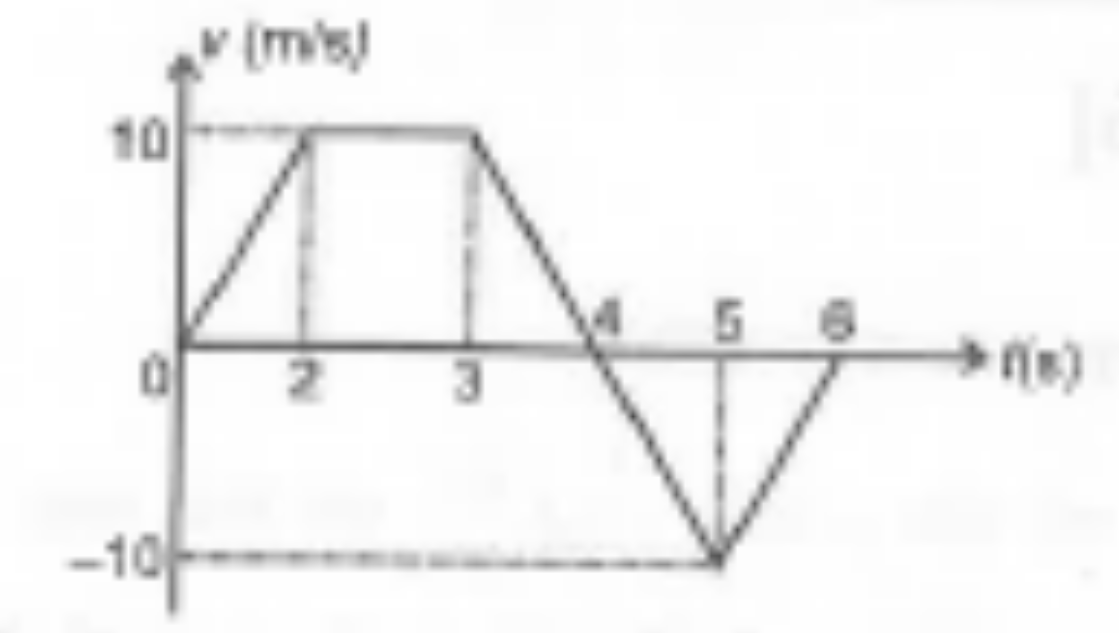
The velocity (v)-time (t) graph of a partide moving along a straight line is as shown in the figure. The displacement of the particle from t = 0 to t = 4 is
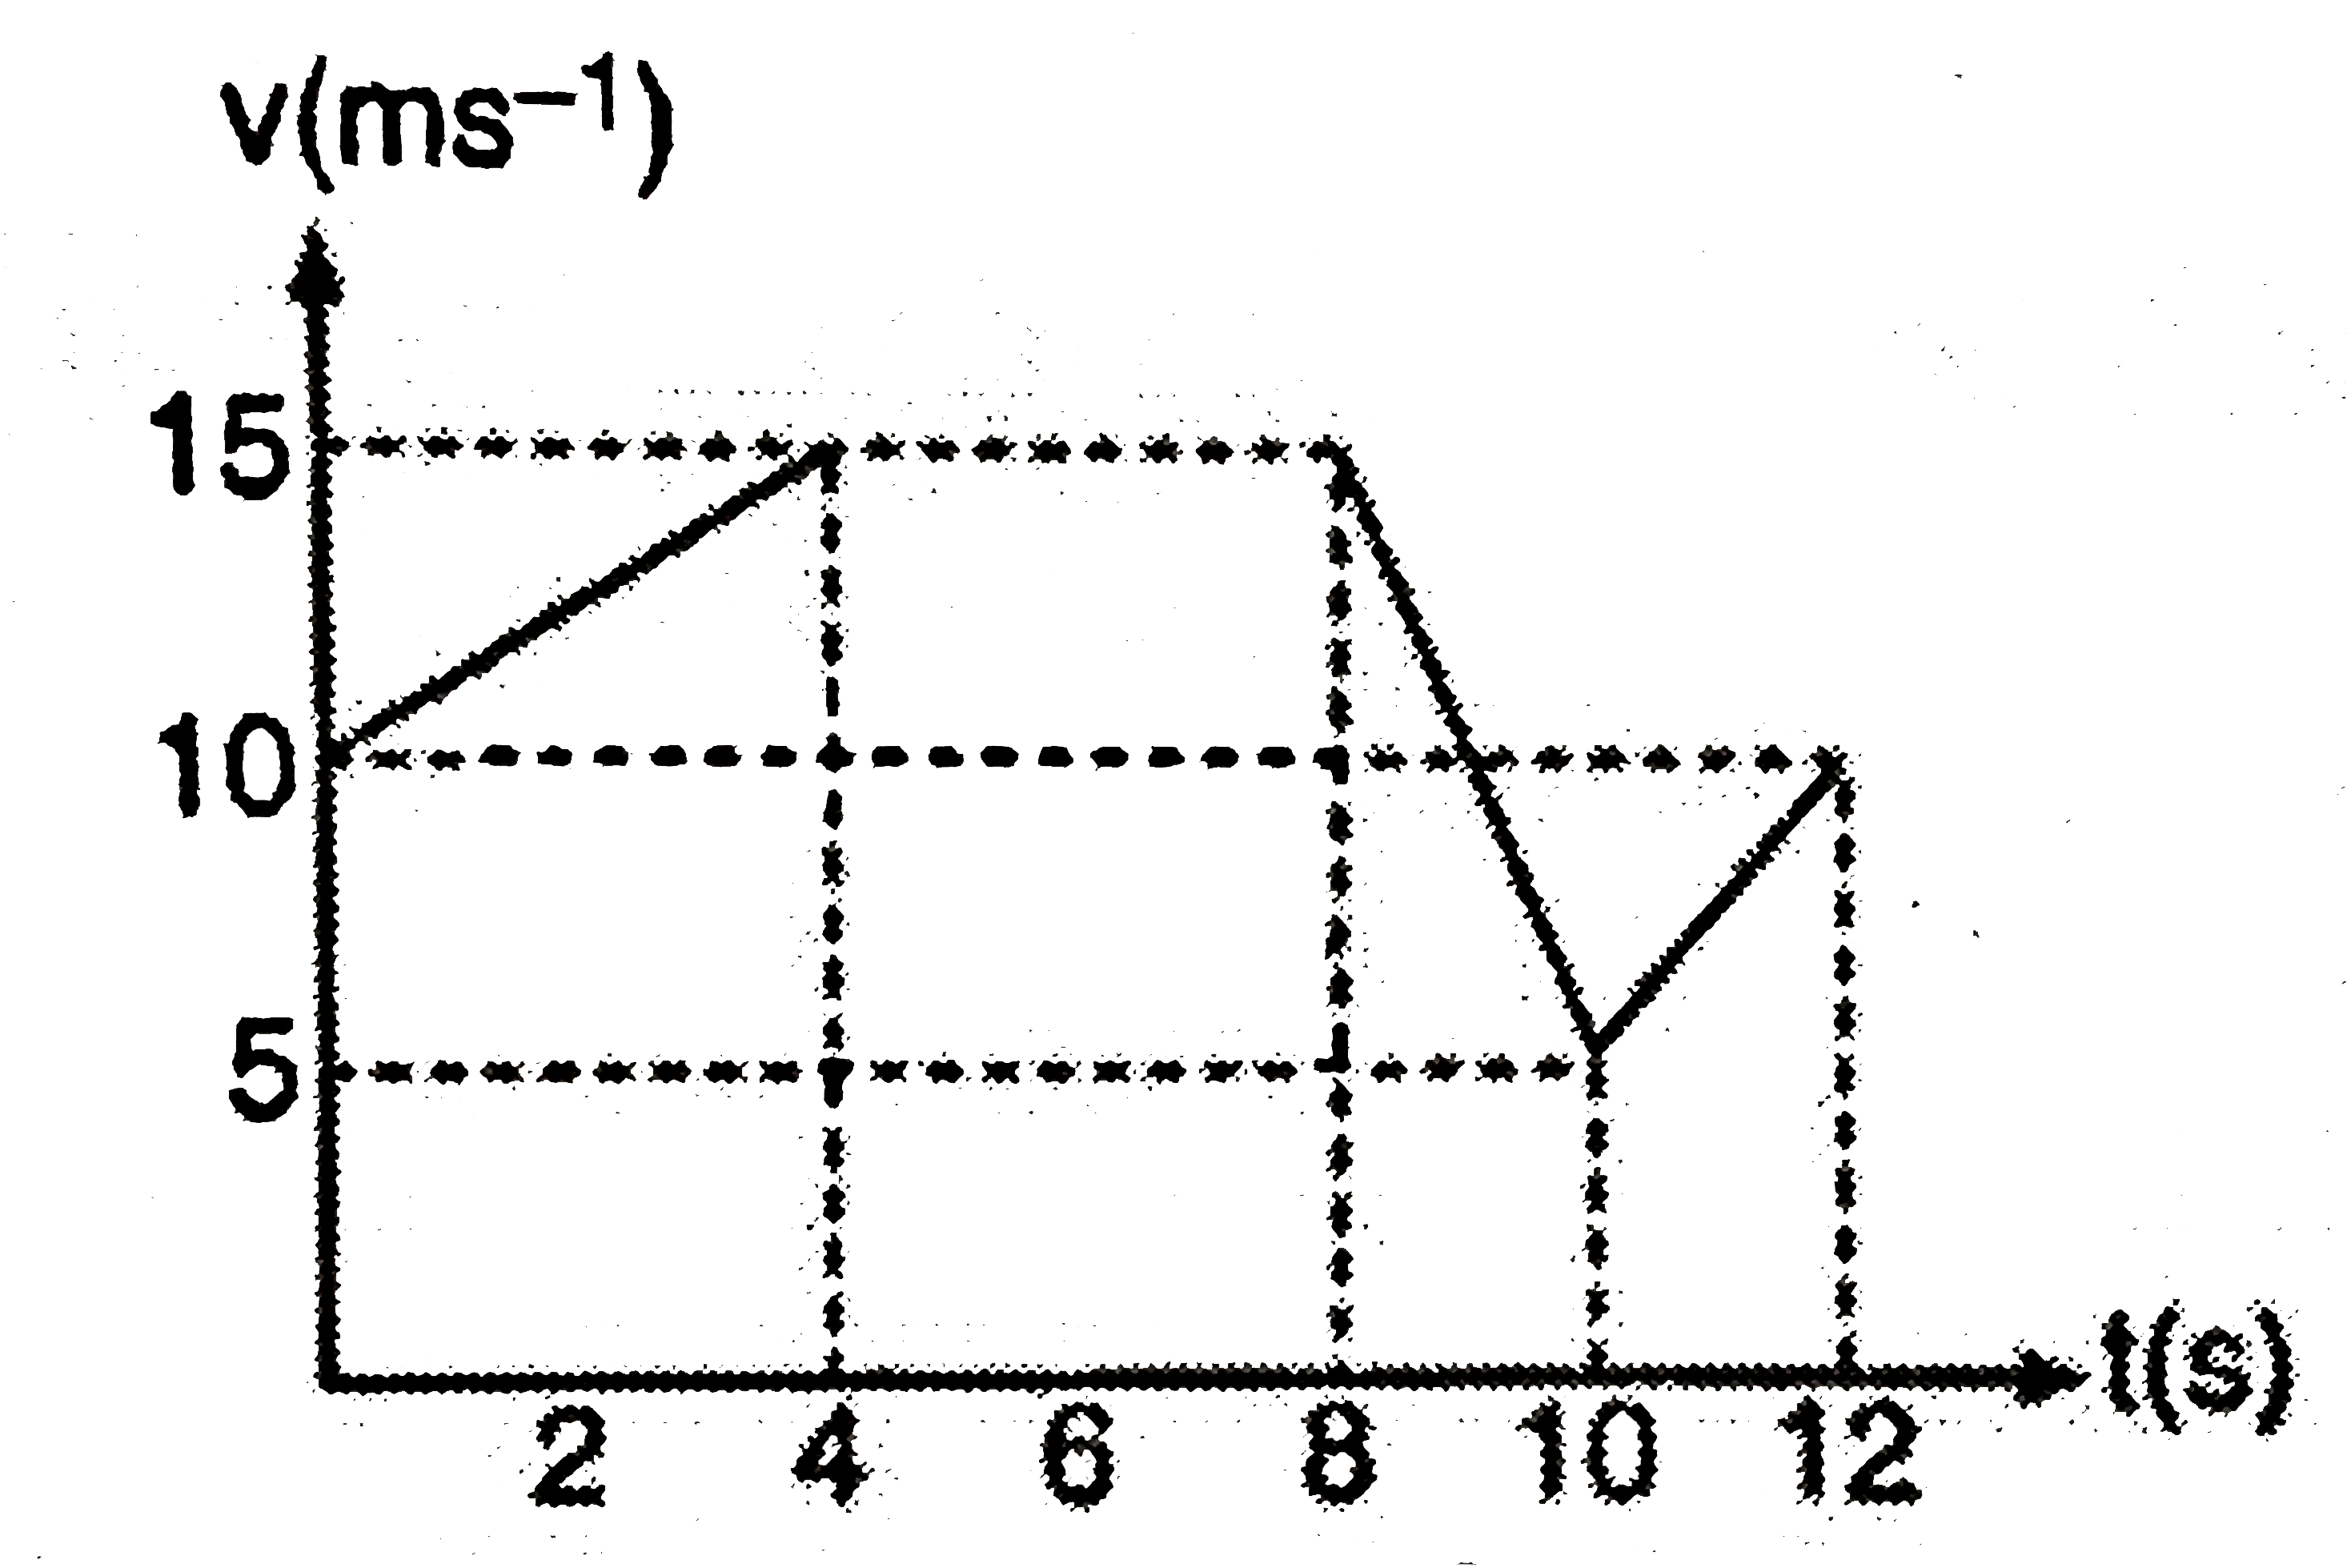
View SolutionThe velocity (v) - time (t) graph for a particle moving along x -axis is shown in the figure.The average velocity in the time interval t=0 to t=8s is
1)4.5ms
2) 2.5ms
3) 5ms
4)2ms
View Solution
Knowledge Check
The velocity -time (v−t) graph of a particle moving in a straight line is shown in figure. The acceleration of the particle at t=9 is:
 AzeroB5ms−2C−5ms2D−2ms−2
The velocity time graph of a body moving along a straight line is shown in figure. The ratio of the average velocities during the time t1 and t2 is.
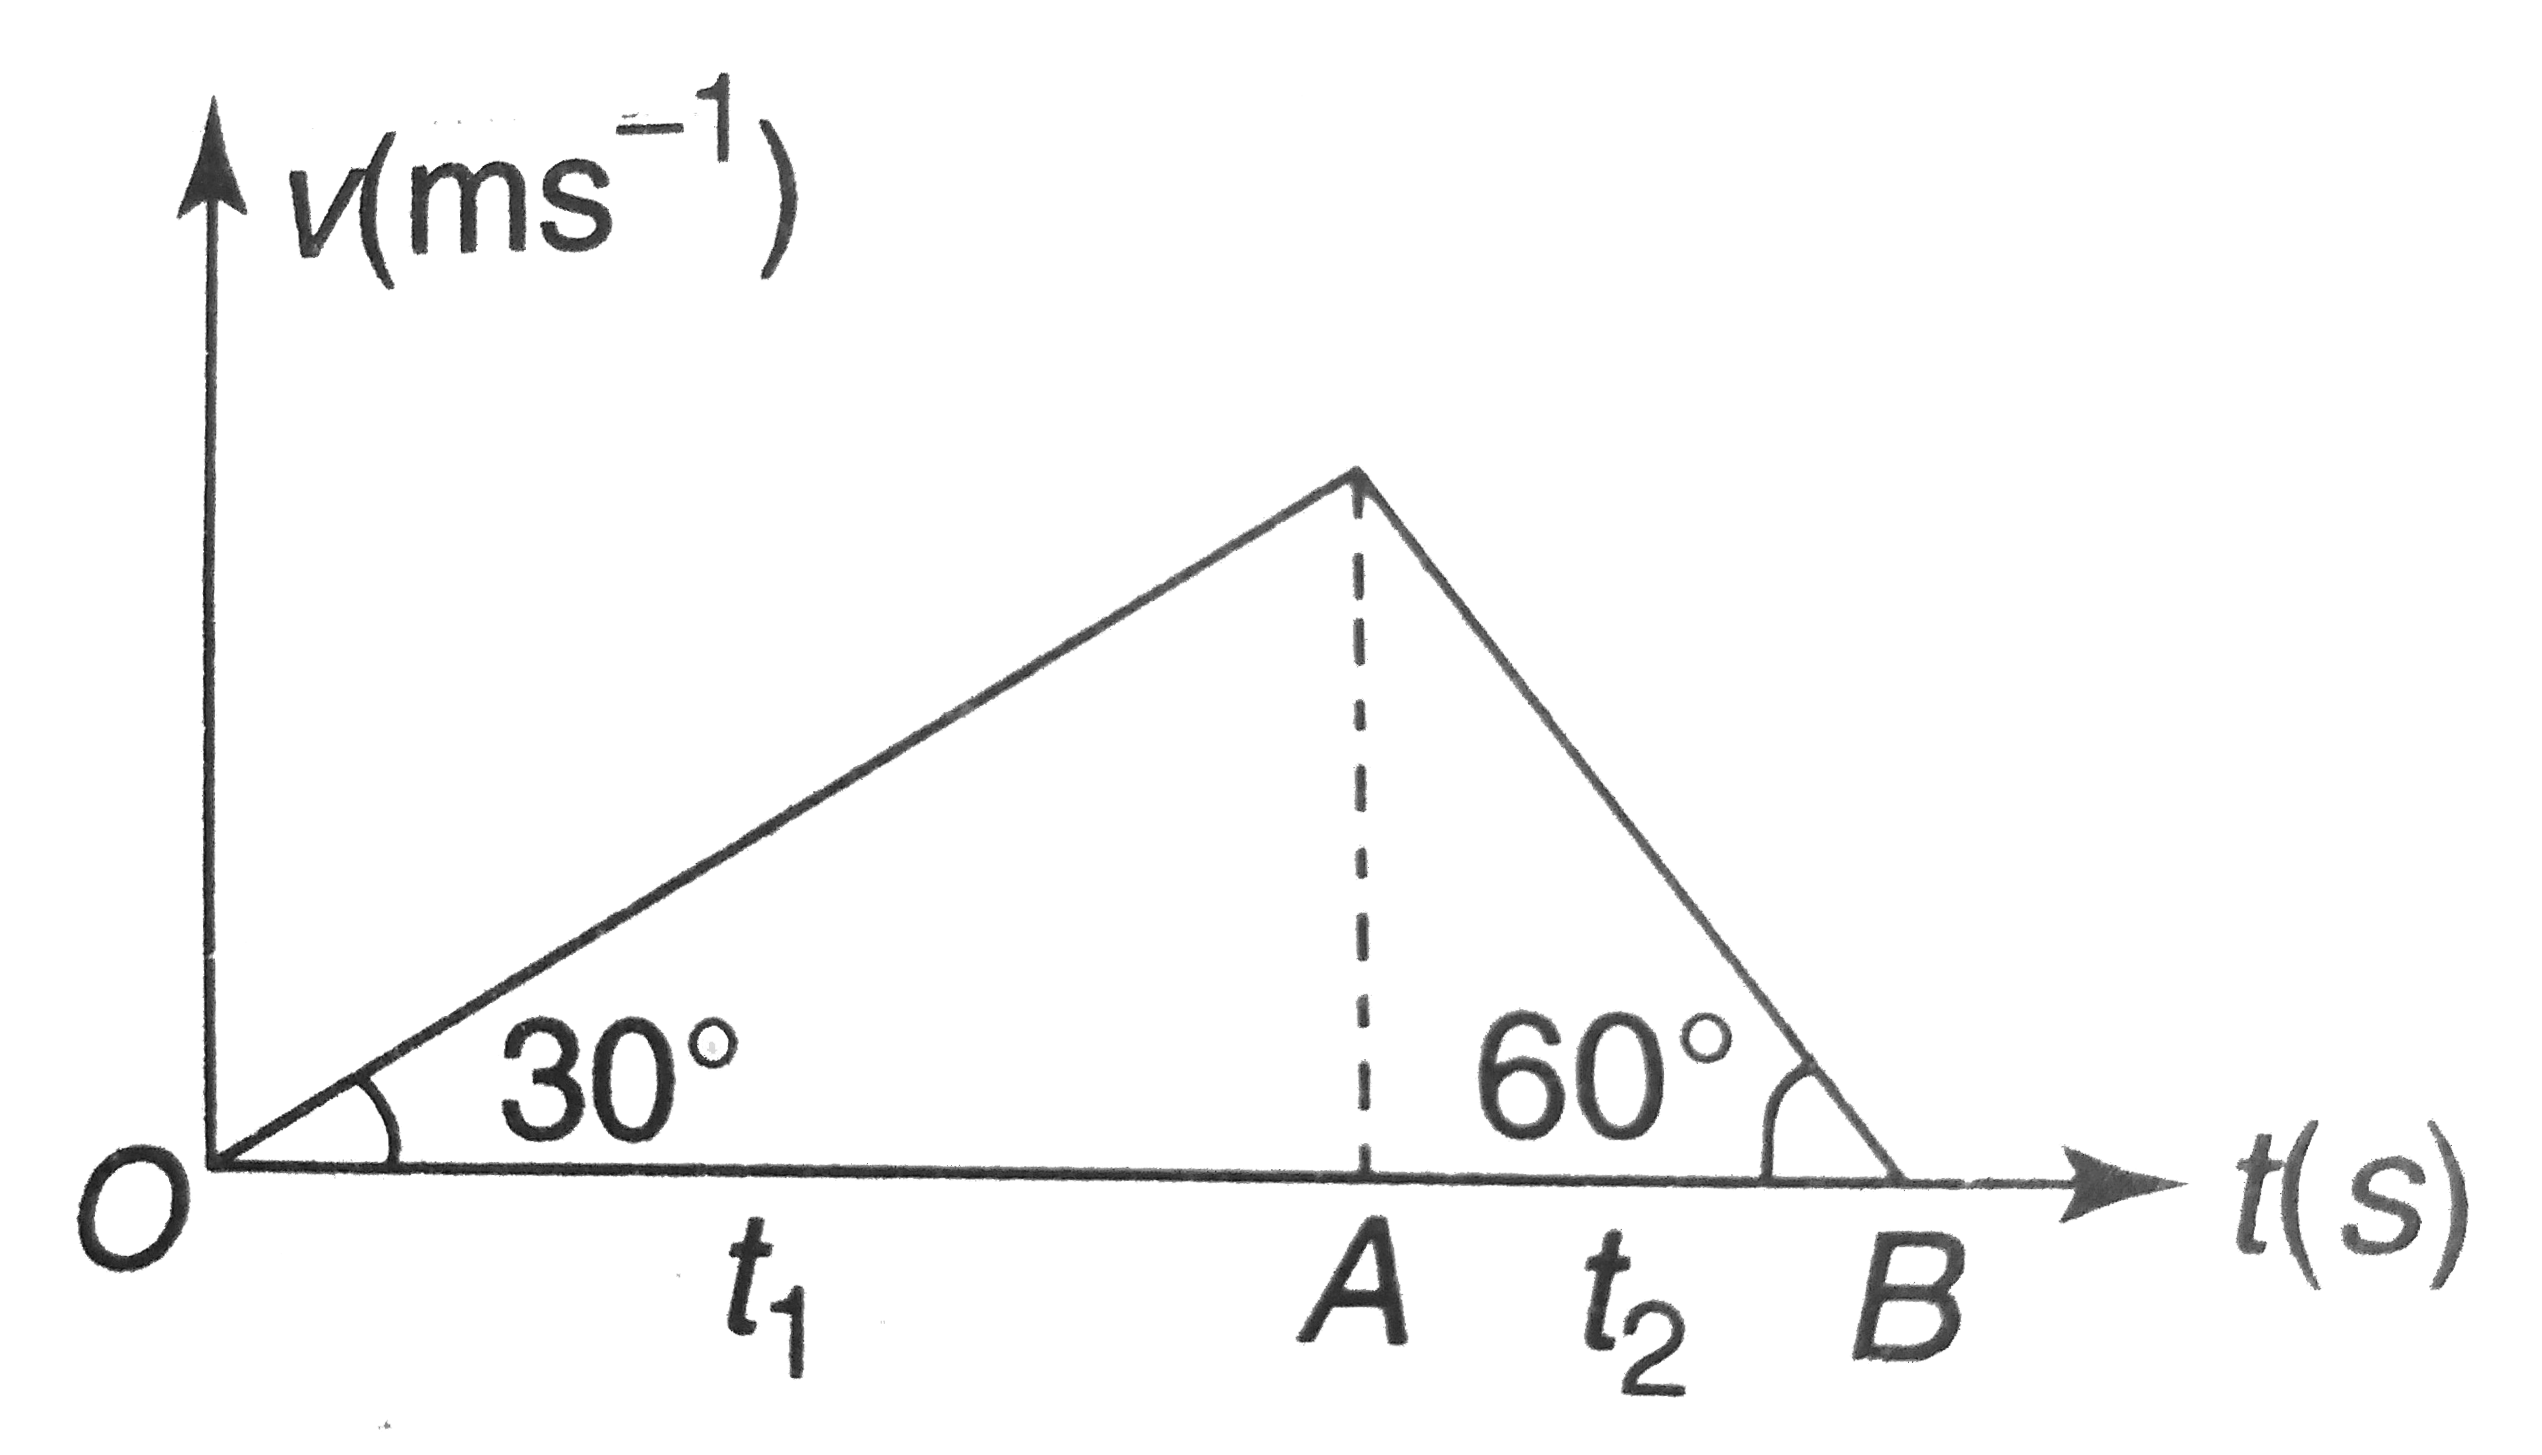 A1:1B2:1C3:1D1:3
The position - time graph for a particle moving along a straight line is shown in figure. The total distance travelled by it in time t = 0 to t = 10 s is
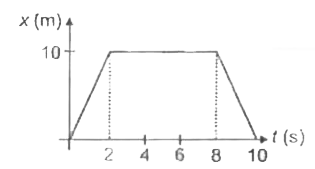 AZeroB10 mC20 mD80 m
The displacement-time graph for a particle moving in a straight line is as shown in the figure. Determine the velocity of the particle at t=1s,3s and 6s. Sketch the velocity-time graph.
View SolutionThe velocity time graph of a particle moving in a straight line is given line is given in the figure. Then starting from t=0, the particle
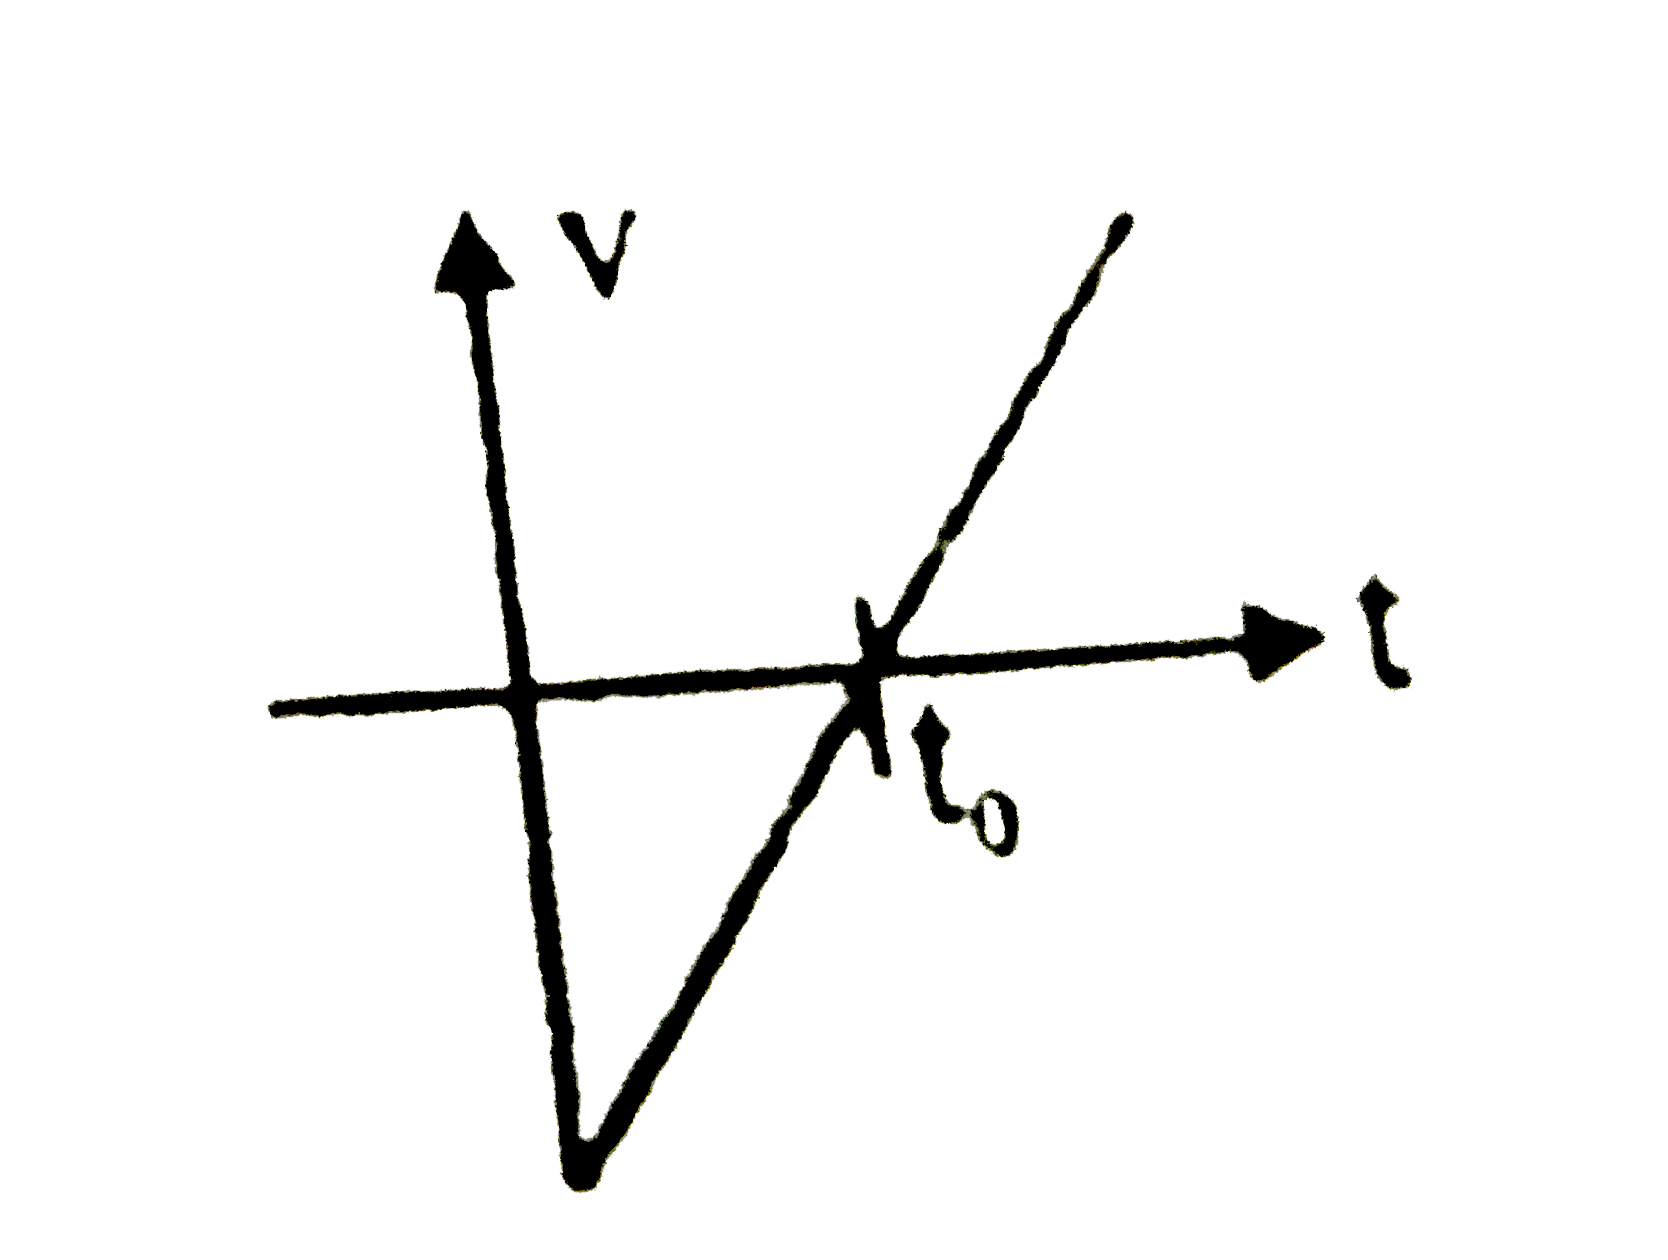
View SolutionThe position - time graph for a particle moving along a straight line is shown in figure. The total distance travelled by it in time t = 0 to t = 10 s is

View SolutionThe velocity (v)-time (t) graph of a partide moving along a straight line is as shown in the figure. The displacement of the particle from t = 0 to t = 4 is

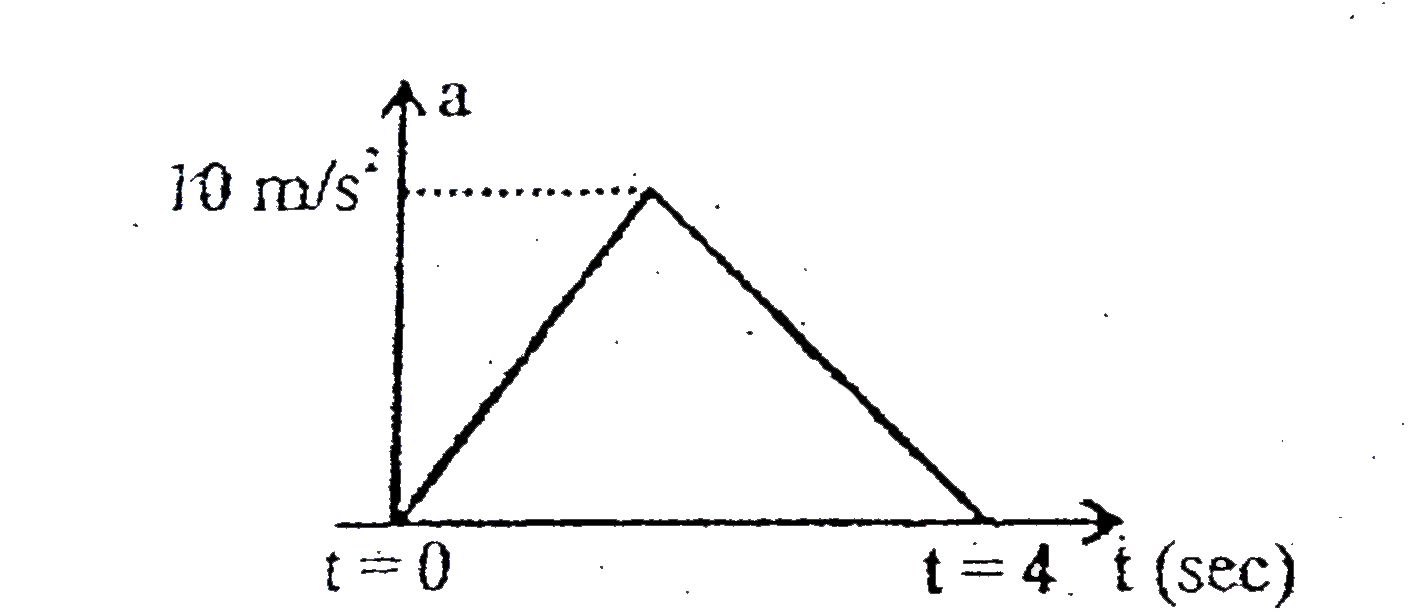
View SolutionAcceleration time graph of a particle moving along a straight line is given. Then average acceleration between t=0 & t=4 is :−
View Solution
