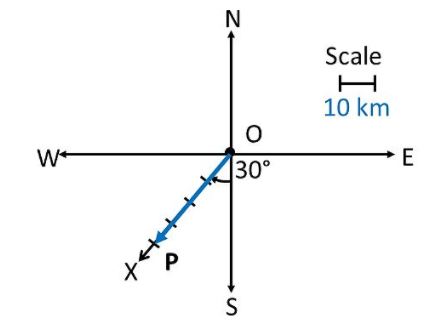
Represent graphically a displacement of 40 km, 30owest of south.
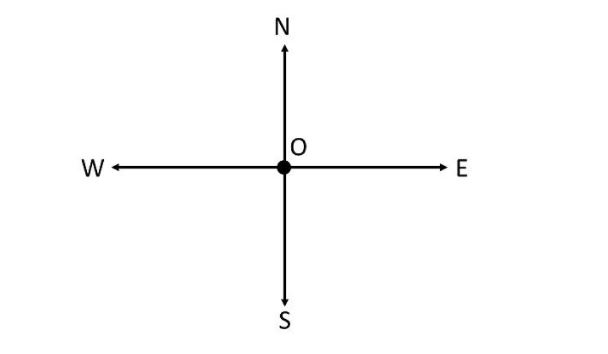
Step 1: Draw north, south, east, west

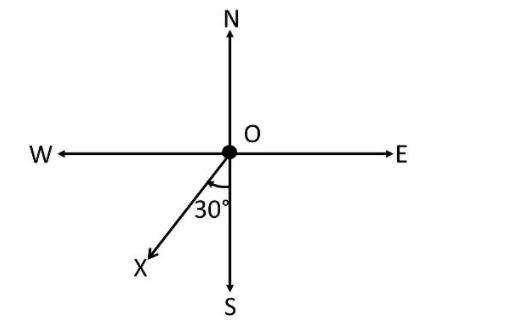
Step 2: Plot a line −−→OX , 30∘ west of north.

Step 3: Define scale and mark 40m on line −−→OX
Let the scale be 10km=1cm
Then −−→OP in the required vector.

Topper's Solved these Questions
Similar Questions
Represent graphically
i. a displacement of 40 km, 300 west of south ii 60 km, 400 east of north iii.50 km south east.
View SolutionRepresent graphically a displacement of 50 km, 50owest of south.
View SolutionRepresent graphically: a displacement of 40km,200 east of south
View SolutionRepresent graphically a displacement of 40 km, 30oeast of north.
View SolutionRepresent graphically a displacement of : 20km south west
View SolutionRepresent graphically: A displacement of 20 m, north east.
View SolutionRepresent graphically a displacement of : 60km,40^o north of west
View SolutionRepresent graphically
(i) a displacement of 60 km, 40∘ east of north
(ii) A displacement of 50 km south-east.
View SolutionRepresent graphically: A displacement of 50 m, 600 south of east
View SolutionRepresent graphically
(a) A displacement of 50 km, 30∘ south of west
(b) A displacement of 40 km, 60∘ north of east
View Solution
