The given distribution shows the number of runs scored by some top batsmen of the world in one-day international cricket matches.Find the mode of the data.
Here, Maximum frequency is 18.
So, Modal class will be corresponding class to 18 that is , 4000−5000.
Now, Mode can be given by formula,
Mode=l+f1−f02f1−f0−f2∗h
Here, l= Lower limit of modal class =4000
f1= Frequency of Modal class =18
f2= Frequency of Pre Modal class =4
f3= Frequency of Succeeding Modal class =9
h= Class interval =1000
Putting these values in Mode formula,
Mode=4000+18−436−4−9∗1000=4000+1400023=4000+608.7=4608.7
Similar Questions
The given distribution shows the number of runs scored by some top batsmen of the world in one-day international cricket matches. Runs scored 3000-4000 4000-5000 5000-6000 6000-7000 7000-8000 8000-9000 9000-10000 10000-11000 No. of batsmen 4 18 9 7 6 3 1 1. Find the mode of the data.
View SolutionThe distribution given below shows the number of wickets taken by bowlers in one-day cricket matches. find the mean and the median of the number of wickets taken

View Solution
Knowledge Check
The ratio of runs scored by Dhawan and Virat in a one-day cricket match is 5:7. If Virat sscored 77 runs find the sum of runs scored by both.
A189B156C135D132
The distribution given below shows the number of wickets taken by bowlers in one-day cricket matches . Find the mean and the median of the number of wickets taken

View Solutionthe distribution given below shows the number of wickets taken by bowlers in one-day cricket matches. find the mean and the median of the number of wickets taken
View SolutionThe distribution below shows the number of wickets taken by bowlers in one-day cricket matches. Find the mean number of wickets by choosing a suitable method. What does the mean signify?
View SolutionFor the given distribution showing the number of runs scored by 50 batsmen. Extimate the mode of the data :

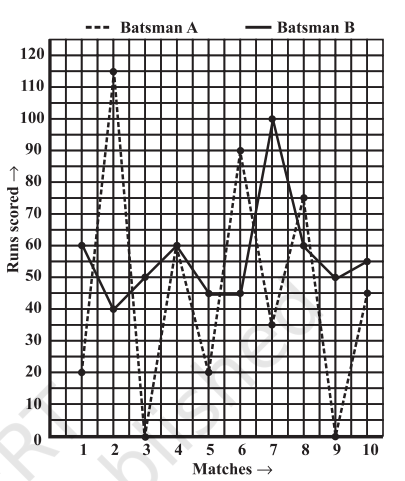
View Solution(A graph on “performance”)The given graph (Fig 15.7) represents the total runs scored by two batsmen A and B, during each of the ten different matches in the year 2007. Study the graph and answer the following questions.(i) What information is given on the two axes?(ii) Which line shows the runs scored by batsman A?(iii) Were the run scored by them same in any match in 2007? If so, in which match?(iv) Among the two batsmen, who is steadier? How do you judge it?

View SolutionThe wickets taken by a bowler in 10 cricket matches are as follows:2 6 4 5 0 2 1 3 2 3 Find the mode of the data.
View SolutionThe marks distribution of 30 students m a mathematics examination are given in Table of Example 1. Find the mode of this data.
View Solution
