The following graph shows the temperature forecast and the actual temperature for each day of a week.(a) On which days was the forecast temperature the same as the actual temperature? (b) What was the maximum forecast temperature during the week?(c) What was the minimum actual temperature during the week?(d) On which day did the actual temperature differ the most from the forecast temperature?
(a) Tue, Fri, Sun
(b)
(c)
(d) thursday
Answers
Topper's Solved these Questions
- INTRODUCTION TO GRAPHSBOOK - NCERT ENGLISHCHAPTER - INTRODUCTION TO GRAPHSEXERCISE - EXERCISE 15.3
2 Videos
- INTRODUCTION TO GRAPHSBOOK - NCERT ENGLISHCHAPTER - INTRODUCTION TO GRAPHSEXERCISE - SOLVED EXAMPLES
8 Videos
- FACTORISATIONBOOK - NCERT ENGLISHCHAPTER - FACTORISATIONEXERCISE - EXERCISE 14.1
3 Videos
- LINEAR EQUATIONS IN ONE VARIABLEBOOK - NCERT ENGLISHCHAPTER - LINEAR EQUATIONS IN ONE VARIABLEEXERCISE - EXERCISE 2.3
9 Videos
Similar Questions
Knowledge Check
Which of the following graph shows the variationi of density of water increase in temperature ?
A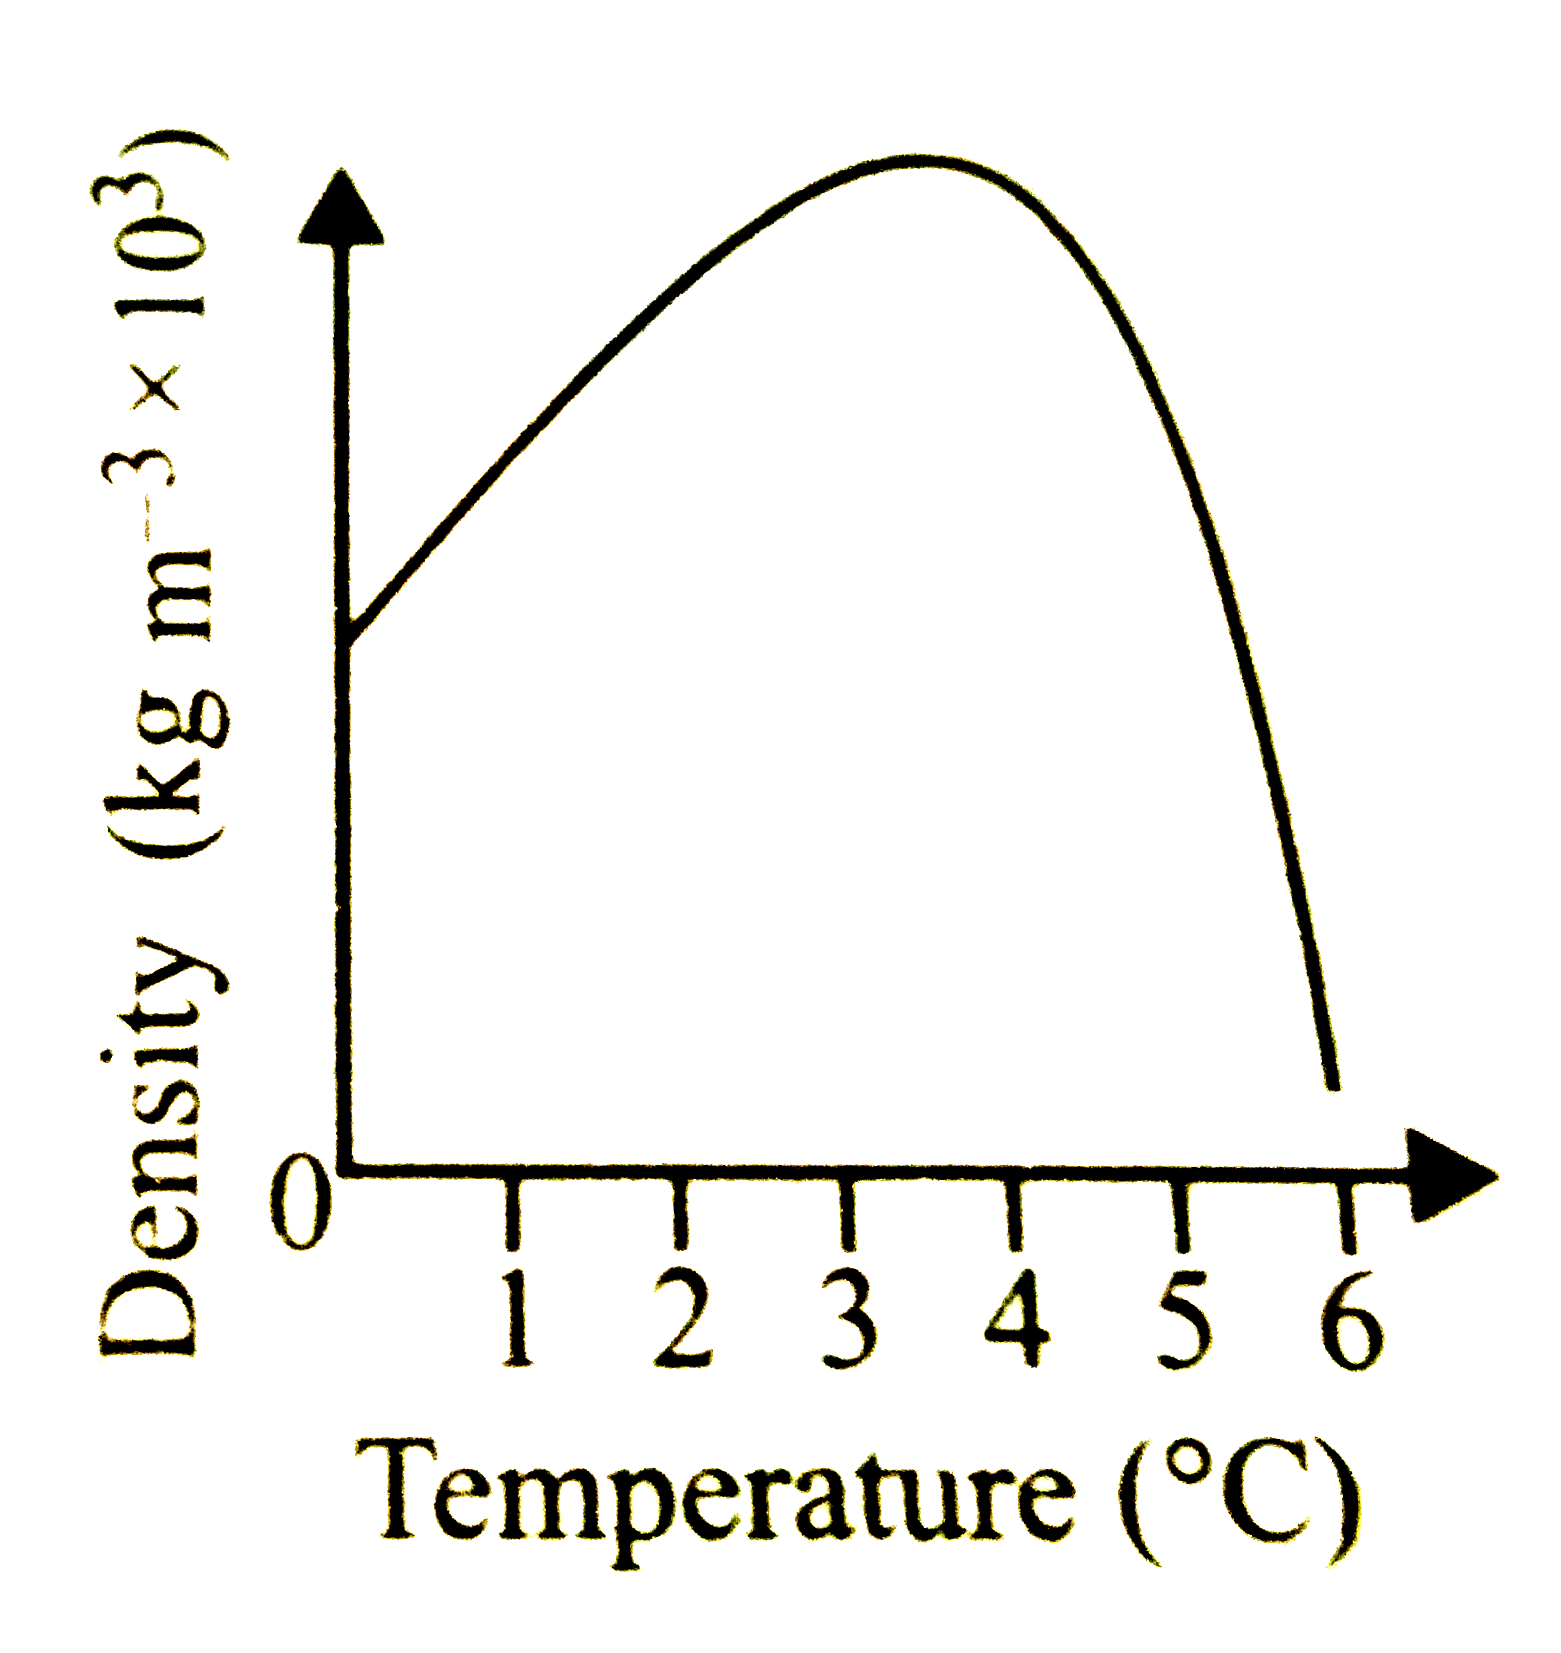 B
B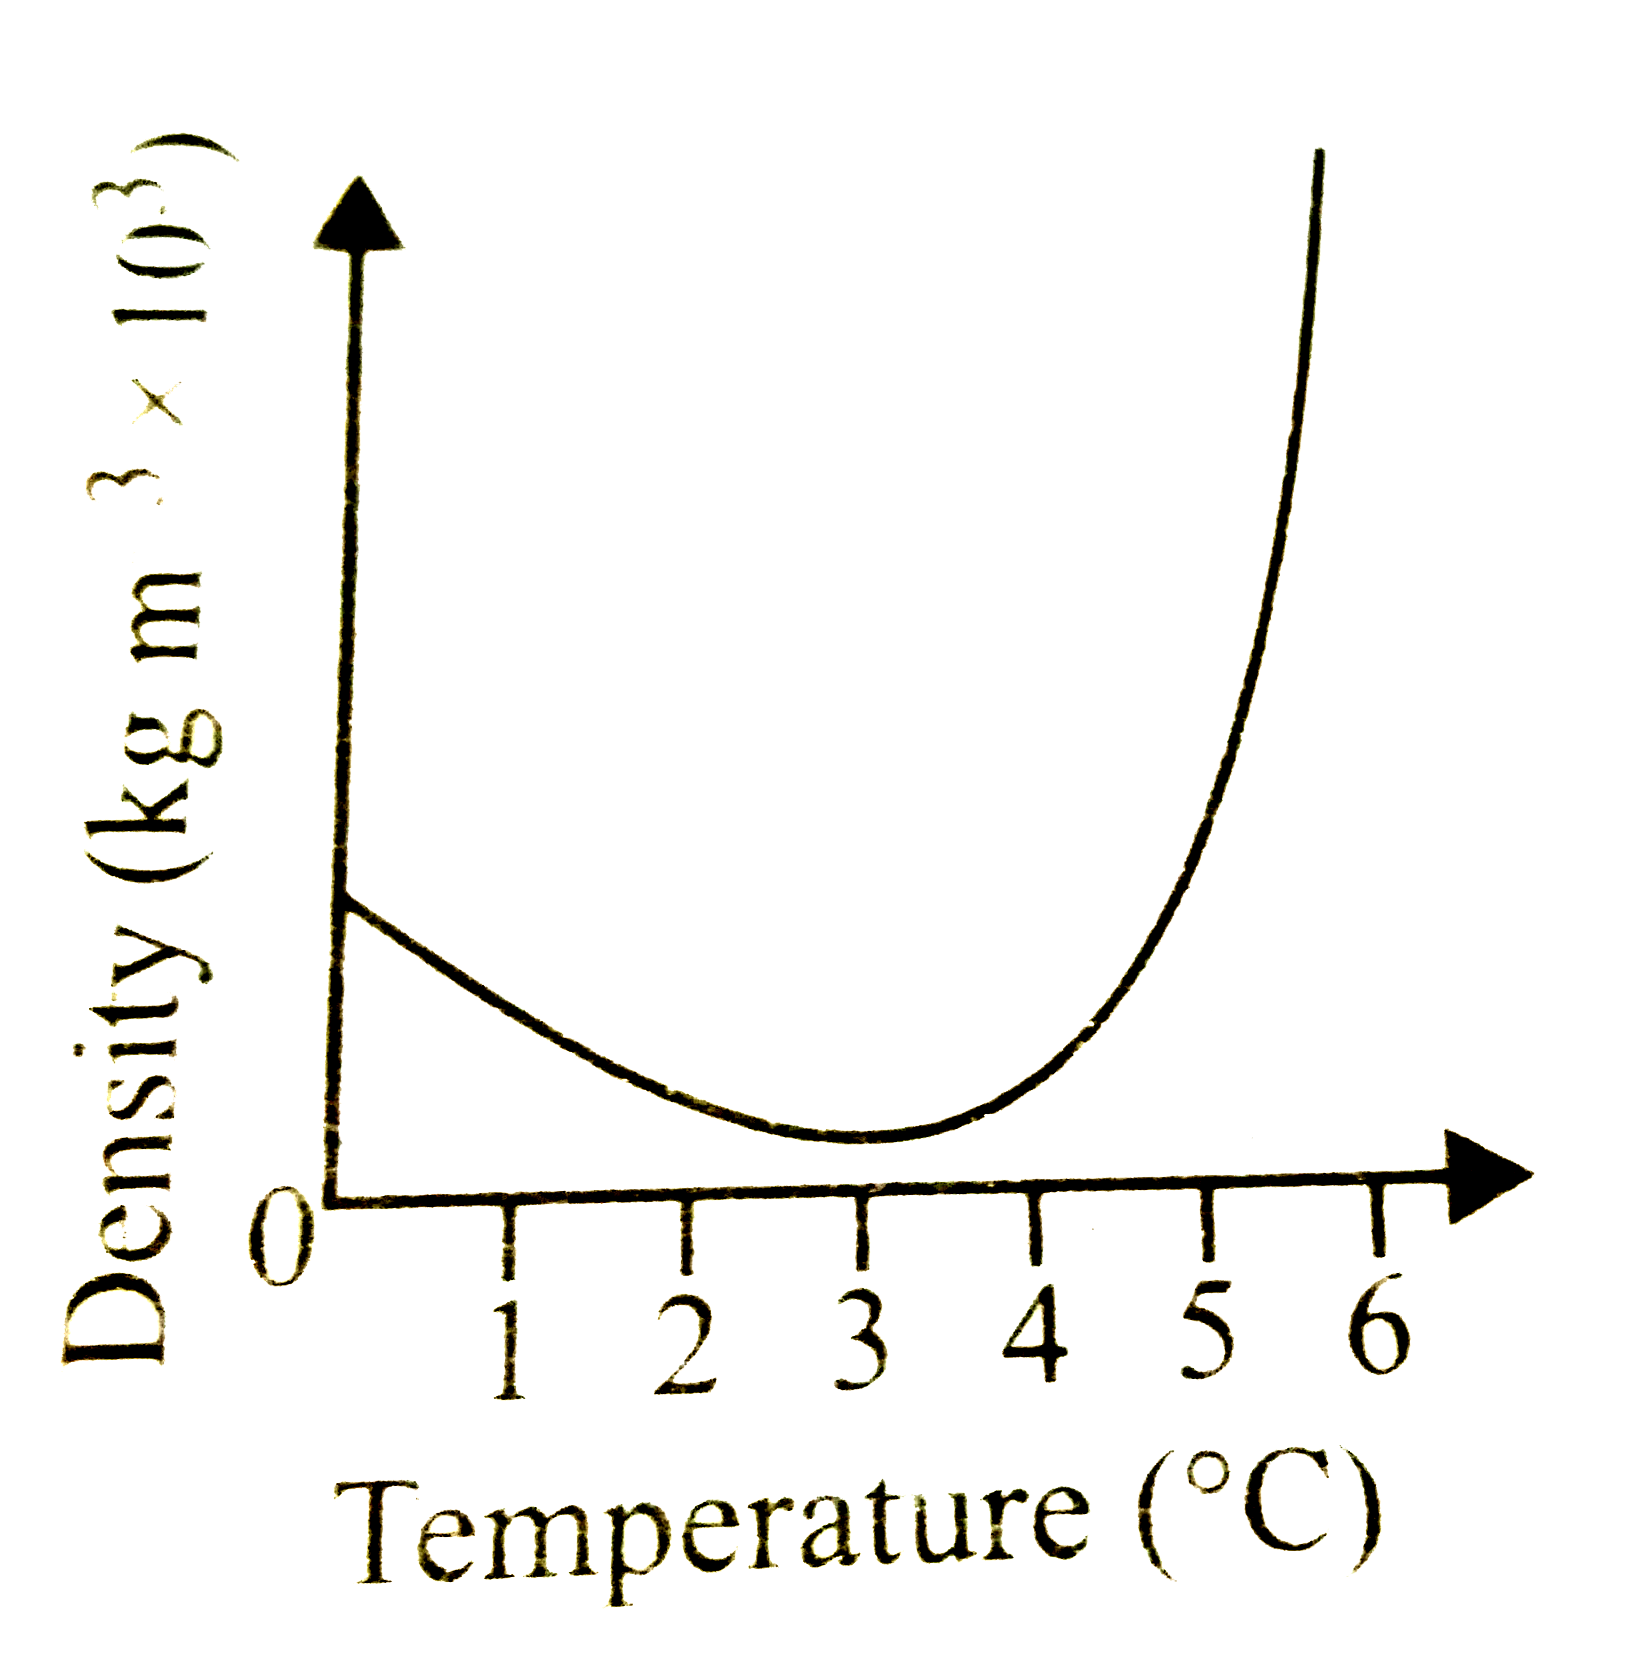 C
C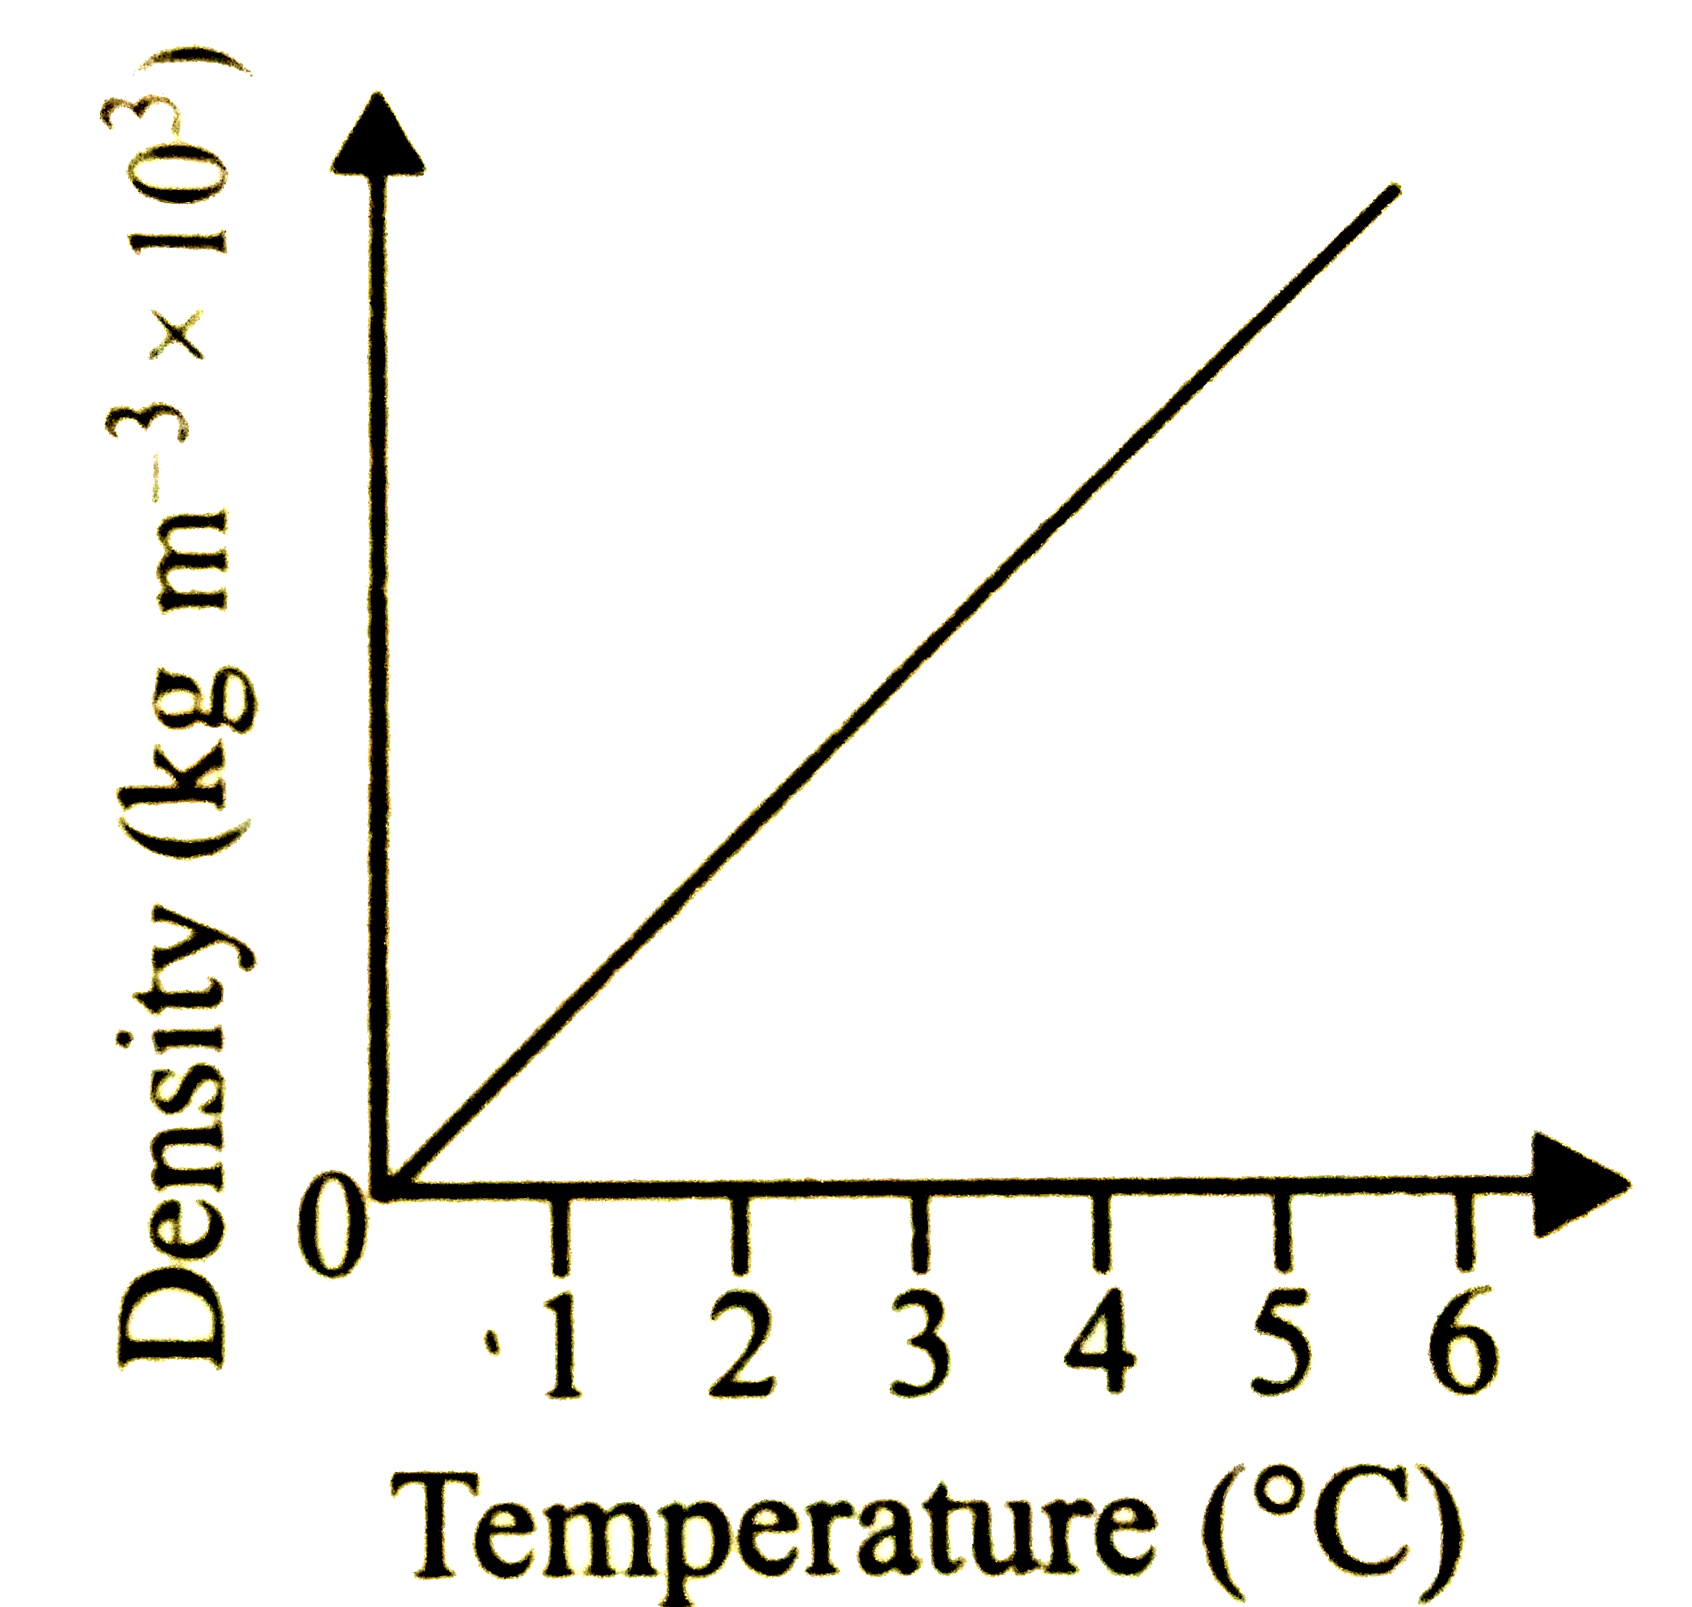 D
D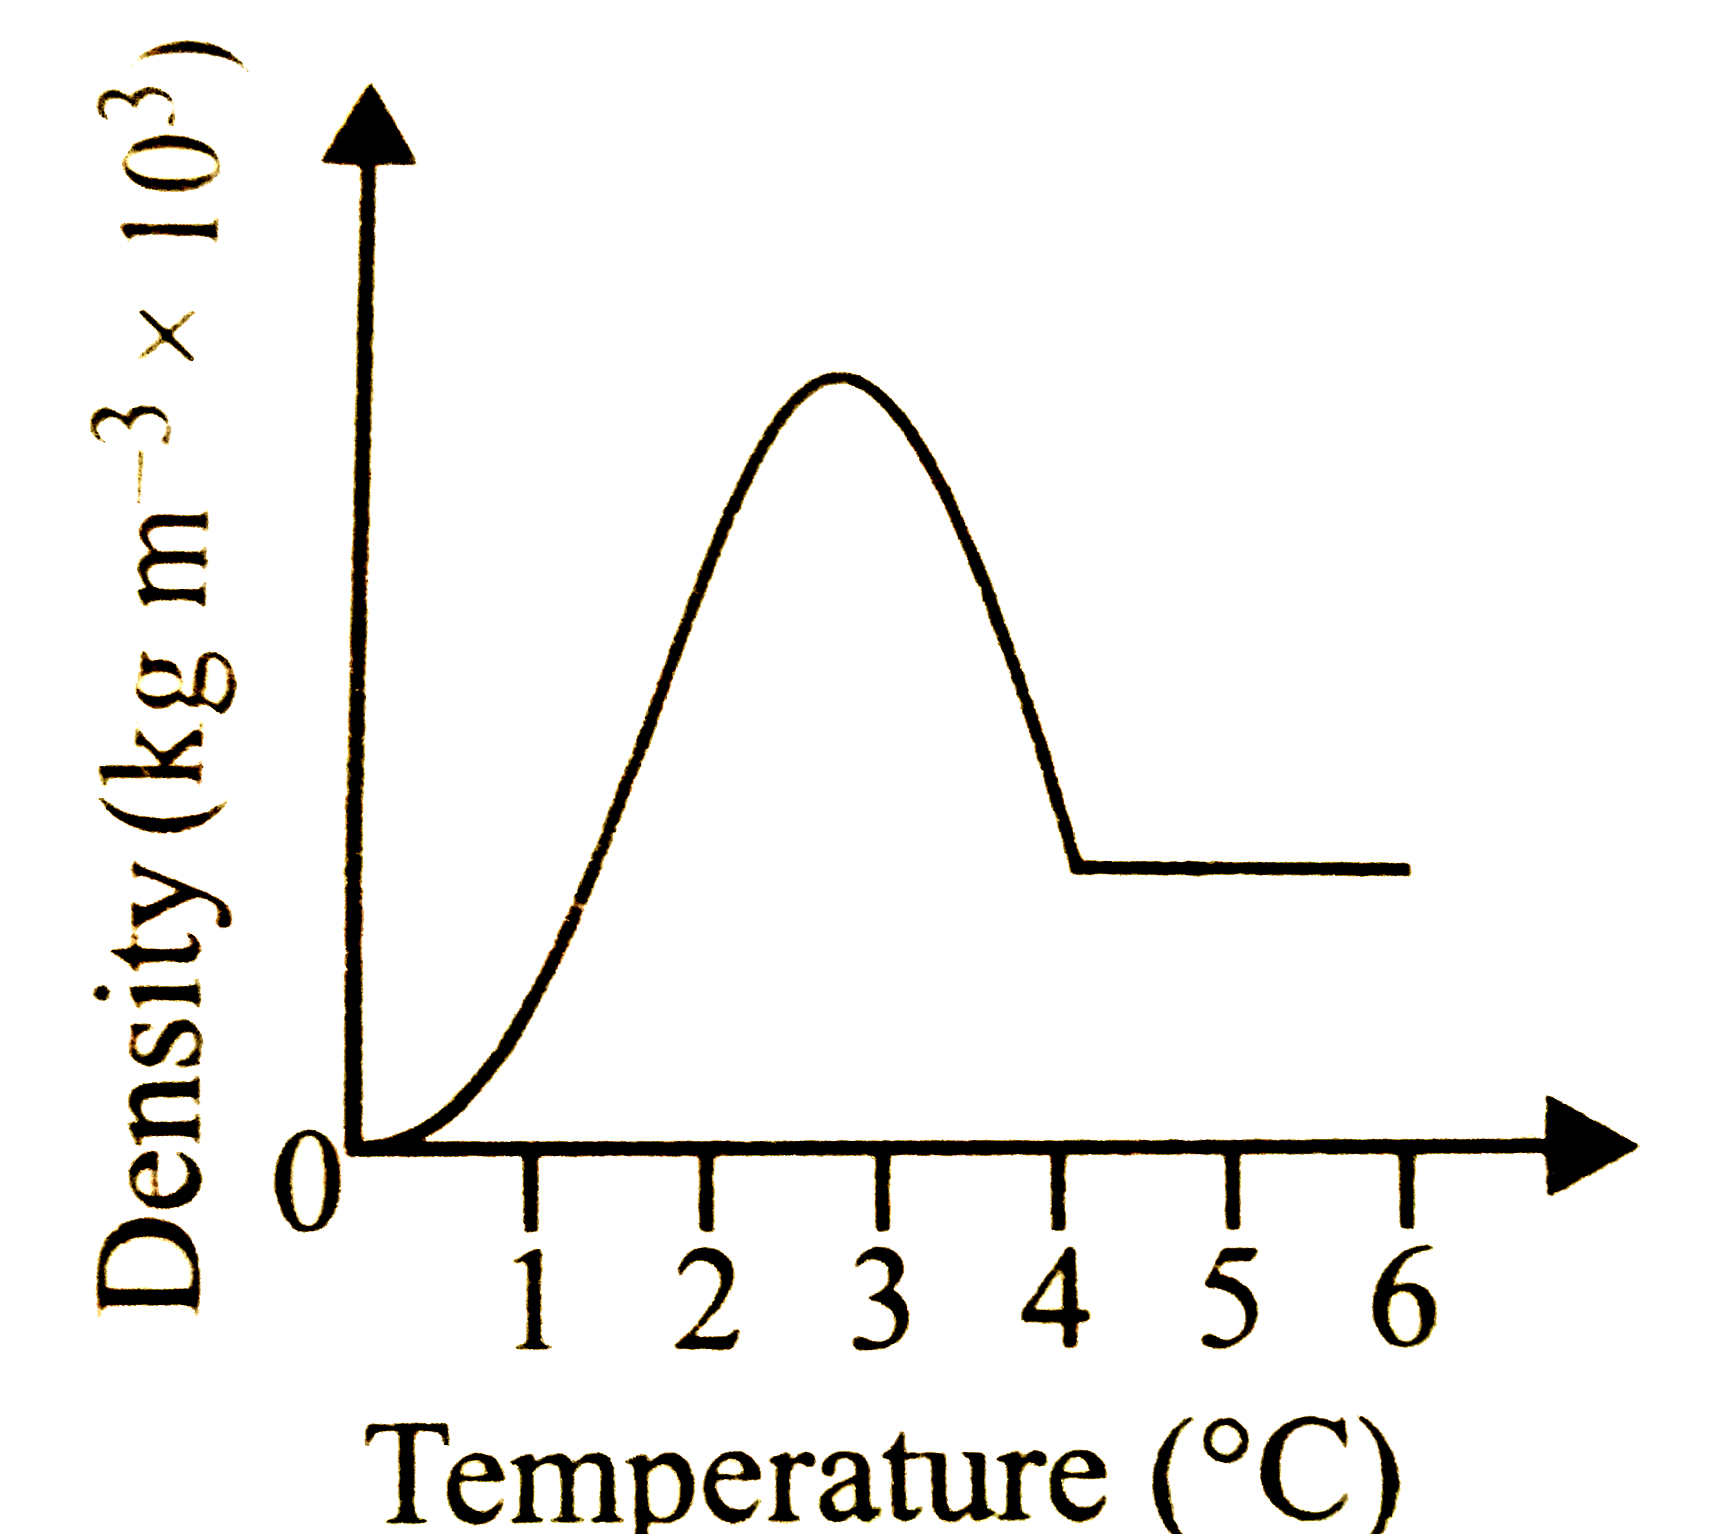
The actual temperature of the place was _______ below zero.
A50 degreesB107 degreesC75 degreesD80 degrees
Difference between the maximum temperature and the minimum temperature in a day is highest in a
View SolutionThe temperature in Simla on night was −4∘C and the next day the temperature went up to 7∘C.
Find the difference between the lowest and the highest temperature.
View SolutionThe following graph show the temprature of a patient in a hospital, recorded every hour, (a) What was the patient's temperature at 1 p.m.? *b) When was the patient's temperature 38.5∘C ? (c) The patient’s temperature was the same two times during the period given. What were these two times? (d) What was the temperature at 1.30 p.m.? How did you arrive at your answer? (e) During which periods did the patients’ temperature showed an upward trend?
View SolutionThe temperature dropped 15 degree celsius in the last 30 days. If the rate of temperature drop remains the same, how many degrees will the temperature drop in the next ten days
View SolutionAt a constant temperature , ΔS will be maximum for which of the following processes:
View SolutionThe following graph gives the minimum and maximum temperatures of various cities on a specific day. Read the graph and answer the following questions
Which city has the largest difference between the minimum and the maximum temperatures on the given day?
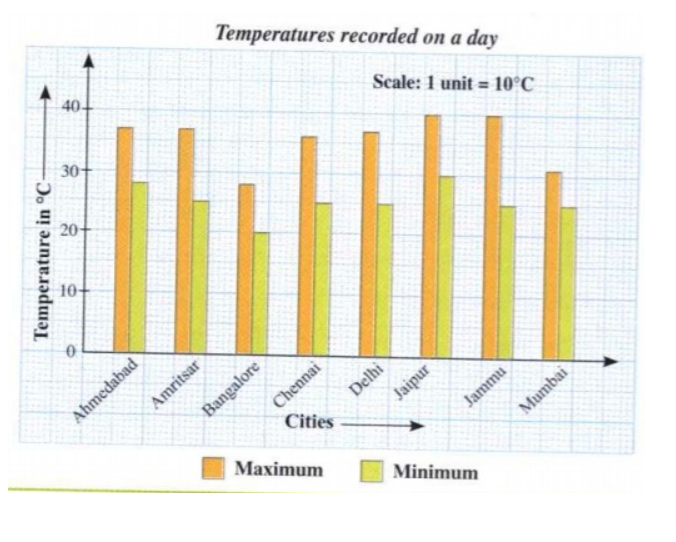
View Solution
