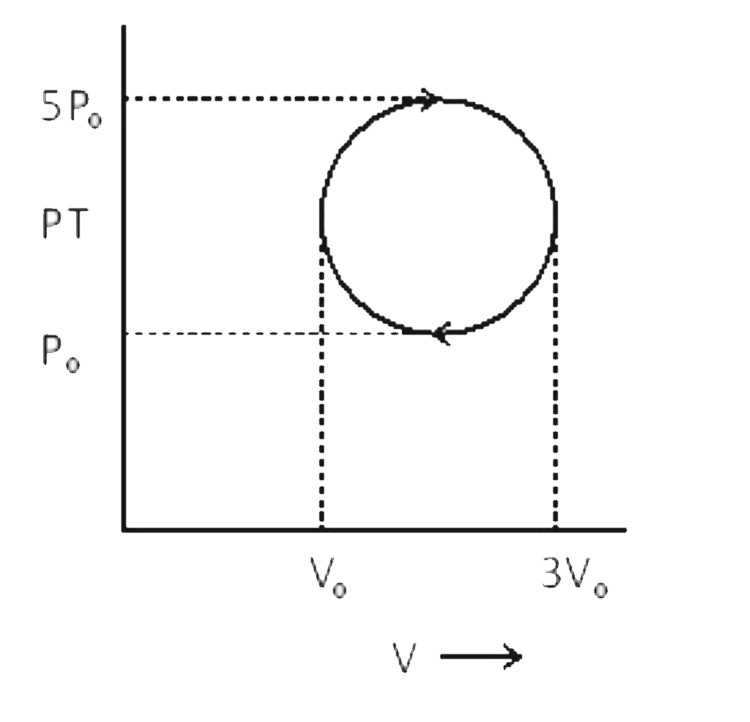
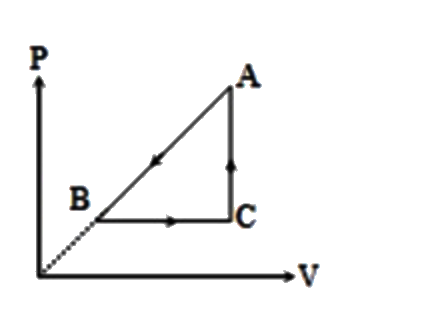
P-V graph of a cyclic process is as shown in the figure.Then its correct T-V curve would be
Step by step video & image solution for P-V graph of a cyclic process is as shown in the figure.Then its correct T-V curve would be by Physics experts to help you in doubts & scoring excellent marks in Class 11 exams.
Similar Questions
Knowledge Check
- Question 1 - Select One
. p-V diagram of a cyclic process ABCA is as shown in figure. Choose the correct statement
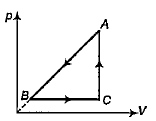 A△QA→B=constantB△UB→C=positiveC△UCAB=negativeDAll of the above
 - Question 2 - Select One or More
P−V diagram of a cyclic process ABCA is as shown in Fig. Choose the correct alternative
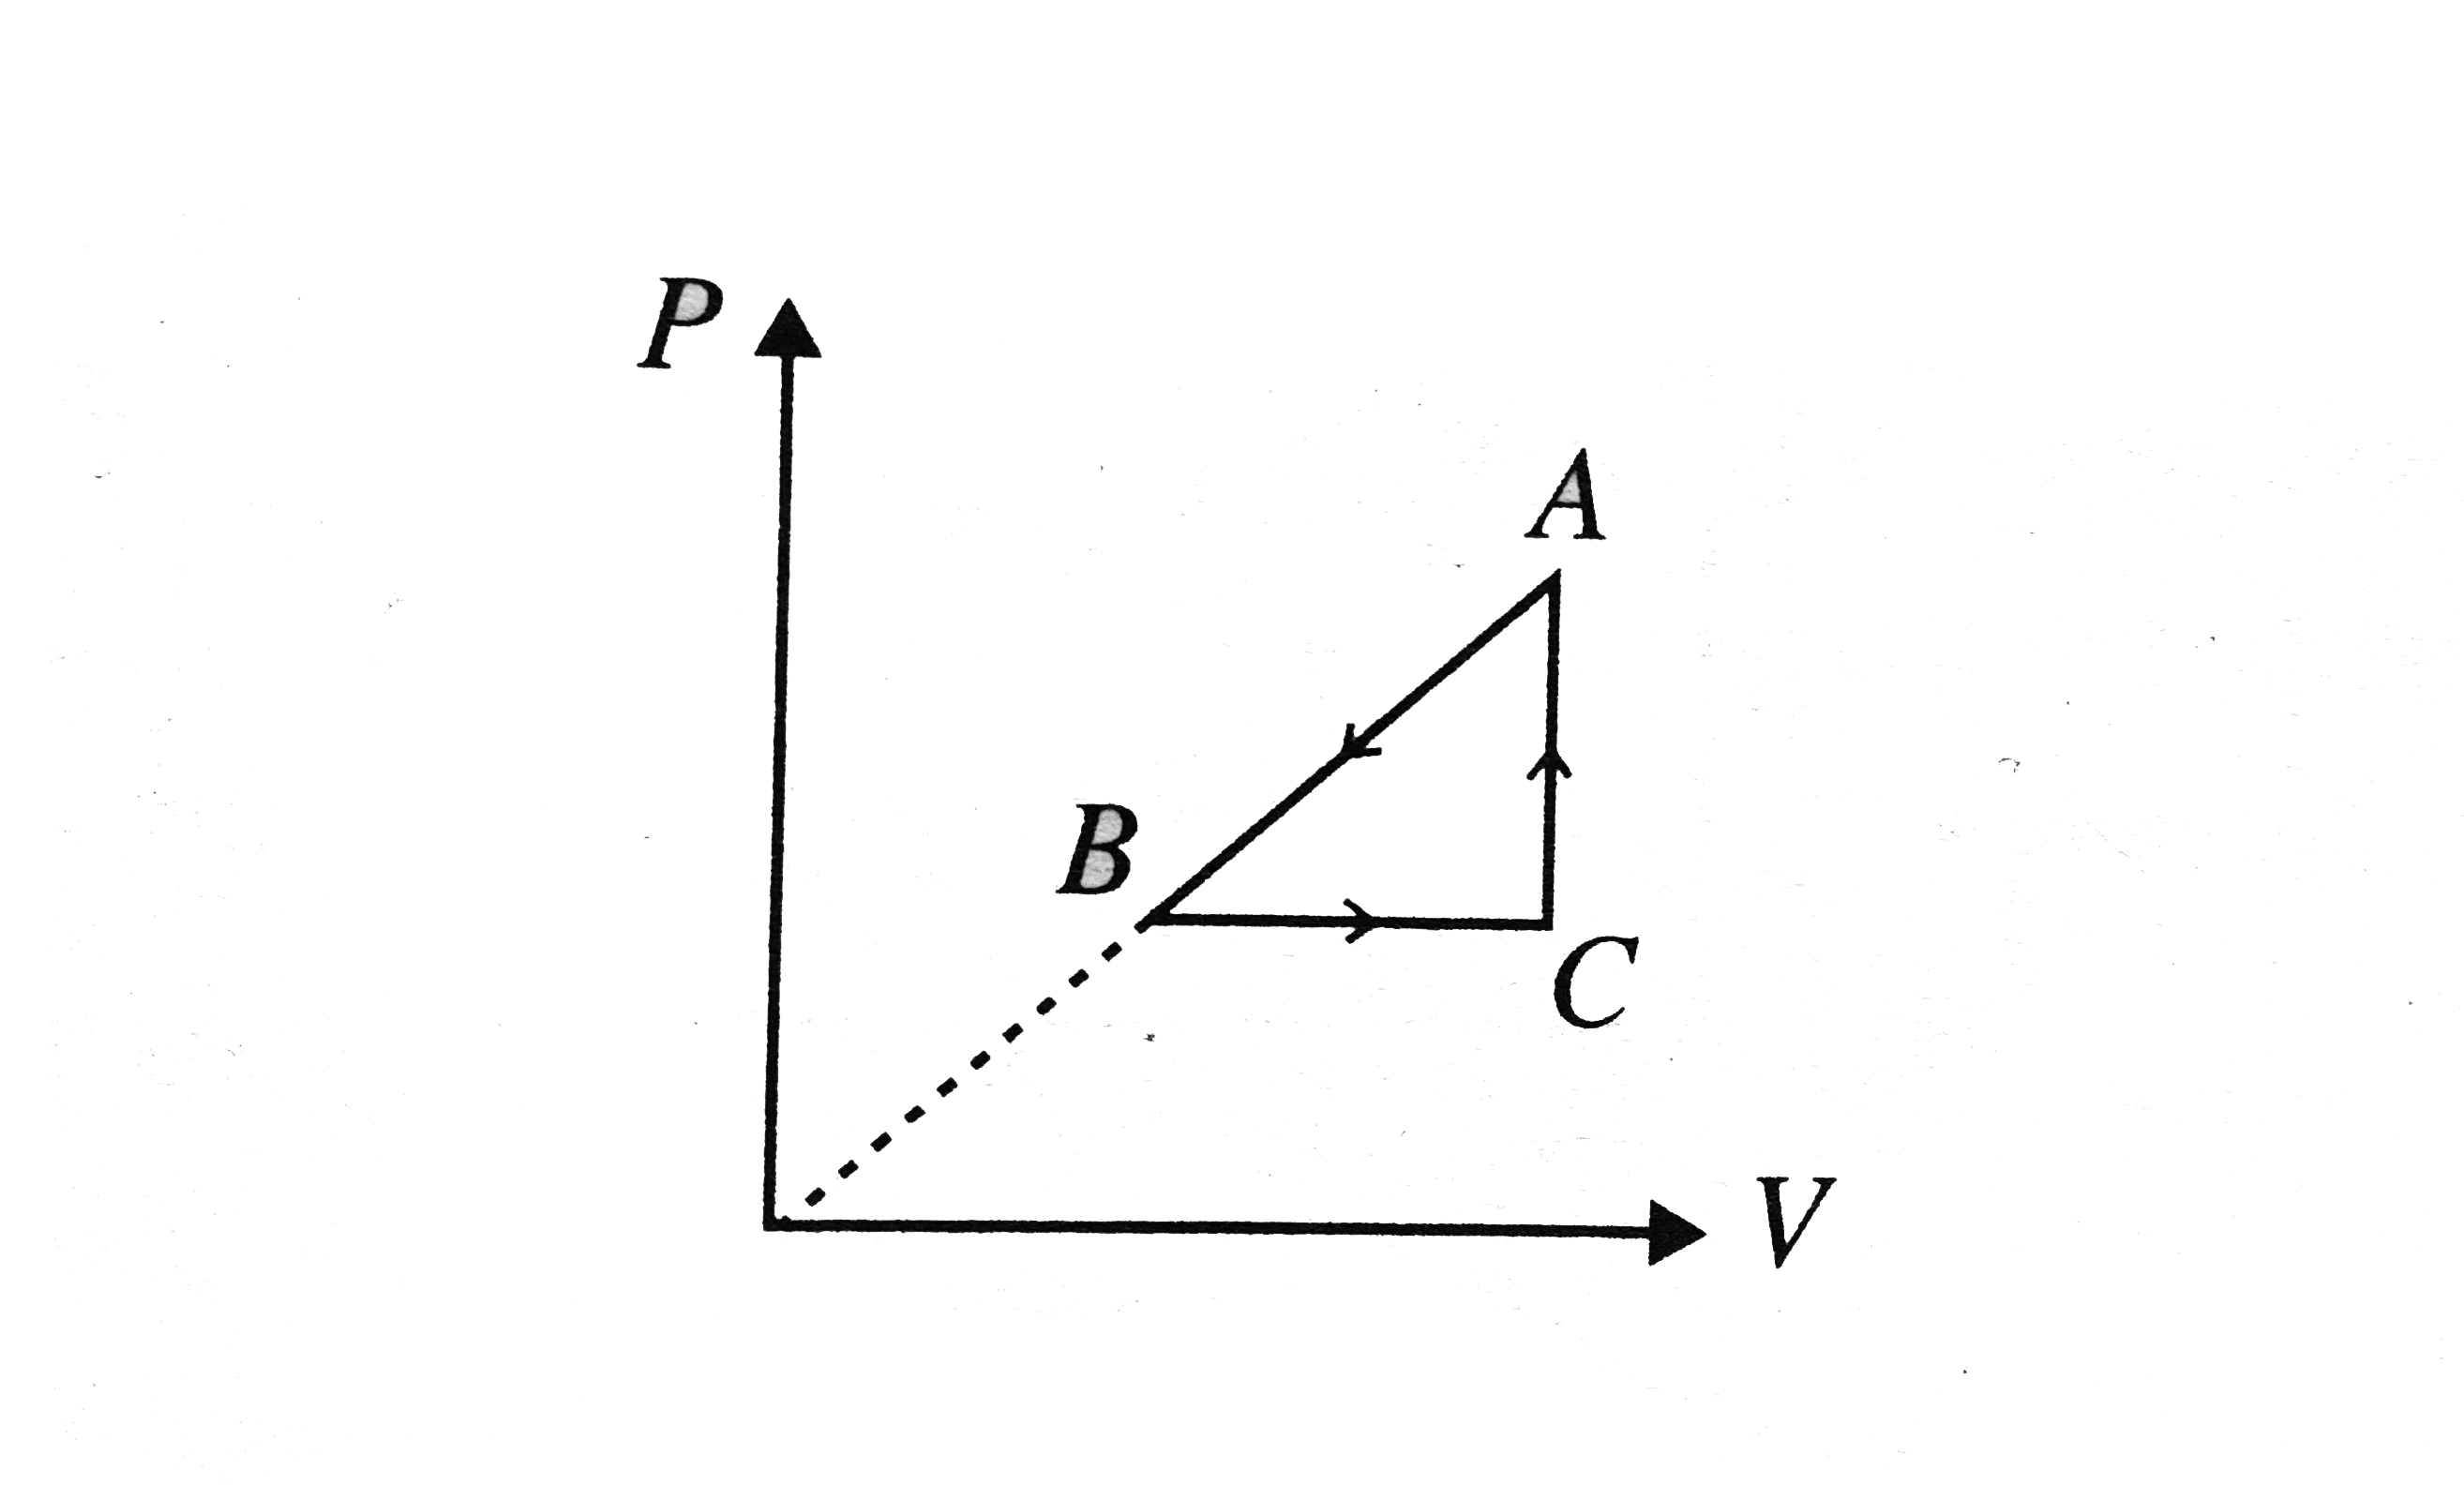 AΔQA→.B is negativeBΔUb→.c is negativeCΔUc→.A is negativeDΔWCAB is negative
 - Question 3 - Select One or More
n mole of an ideal gas undergo an isothernal process at temperature T. Further, P-V graph of the process is as shown in the figure. Tangent at point A, cuts the V-axis at point D. AO is the line joining the point A to the origin O of P-V diagram. Choose from following the correct option(s).
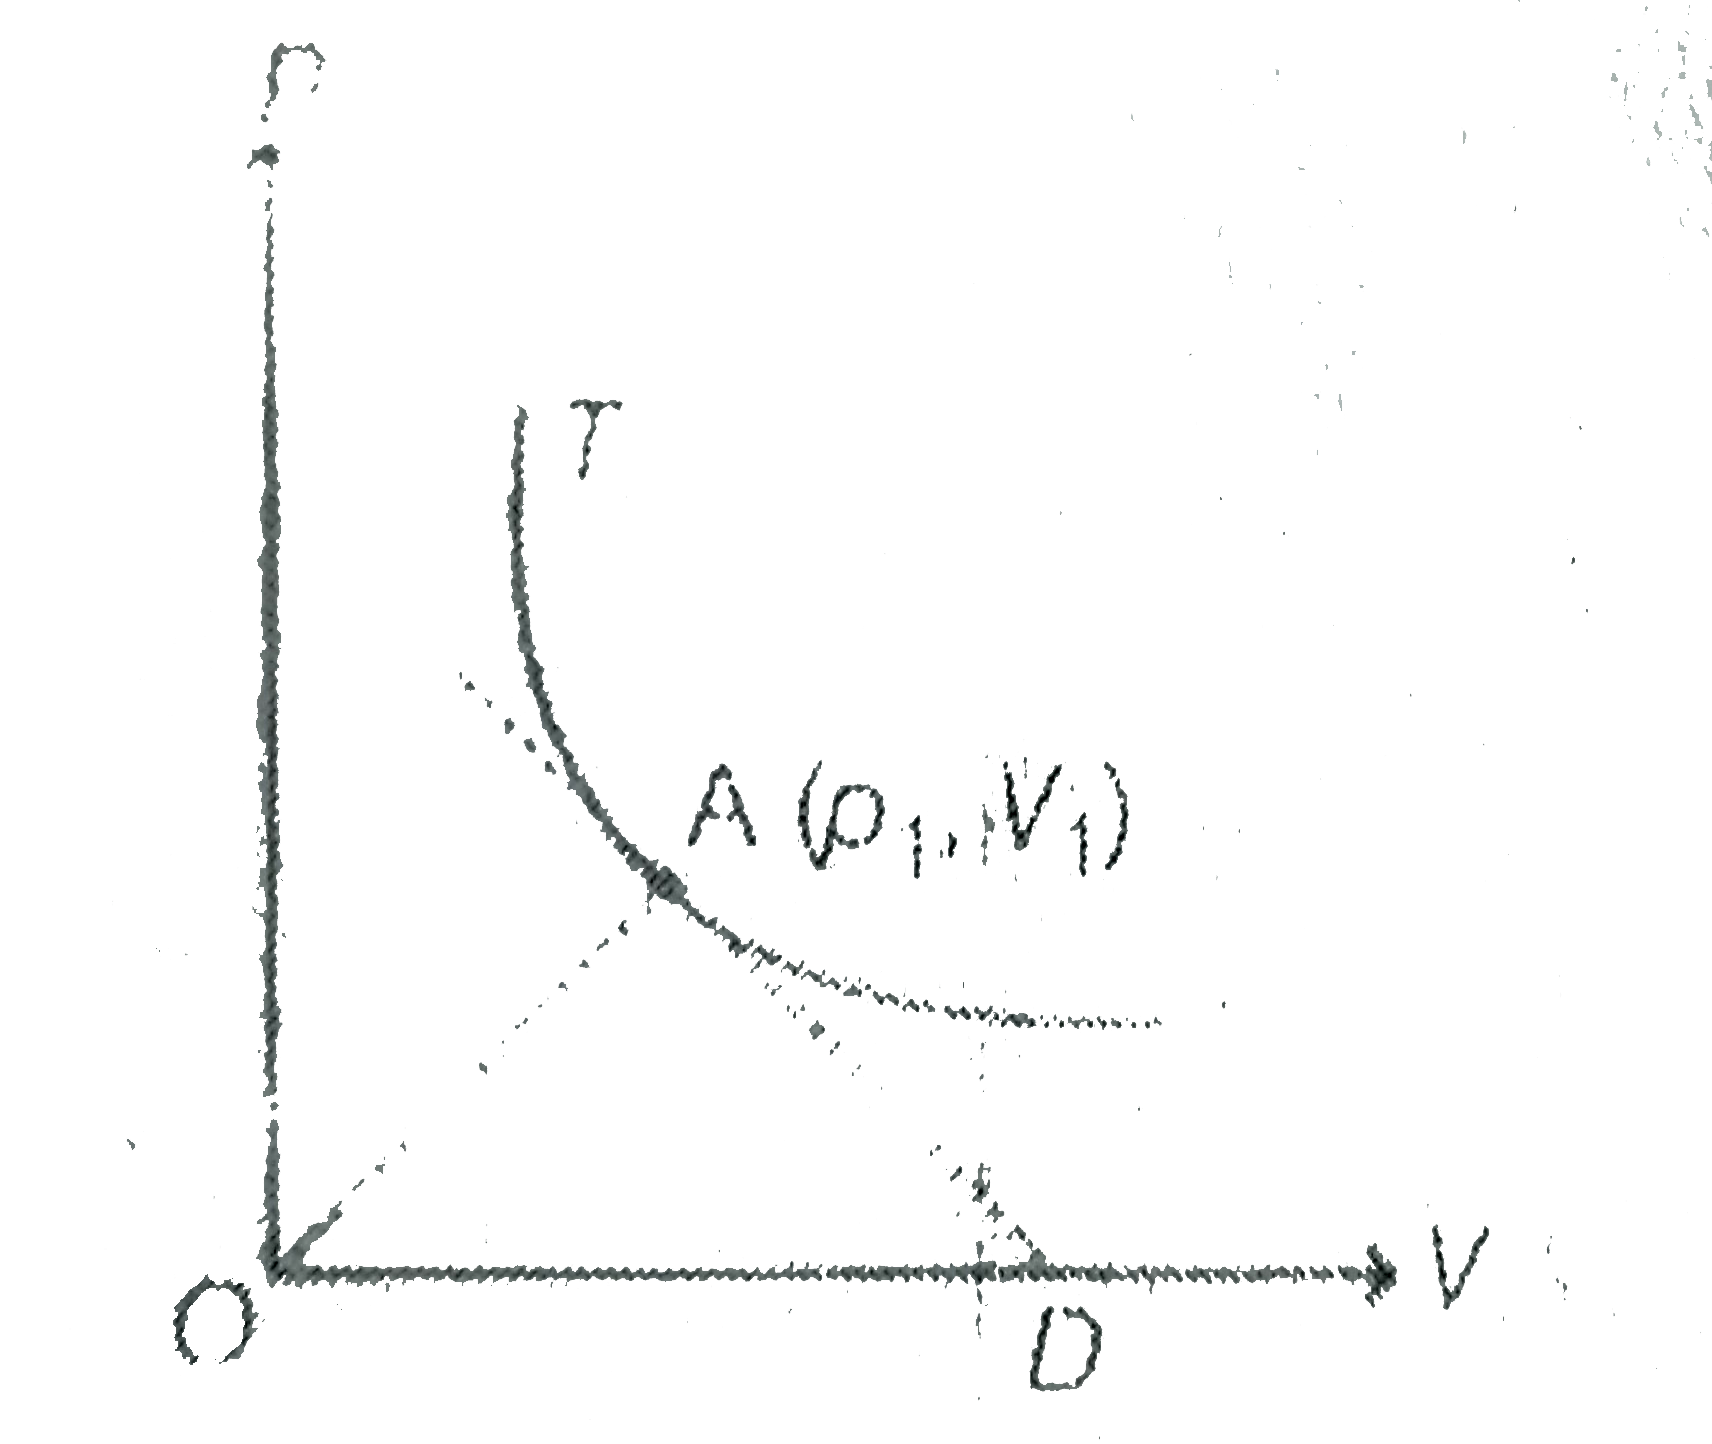 Acoordinates of point D is (3V12,0)Bcoordinates of point D is (2V1,0)Carea of the triangle AOD is nRTDarea of the triangle AOD is 34 nRT
An ideal monatomic gas undergoes a cyclic process ABCA as shown in the figure. Graph of pressure versus volume of the cyclic process ABCA is
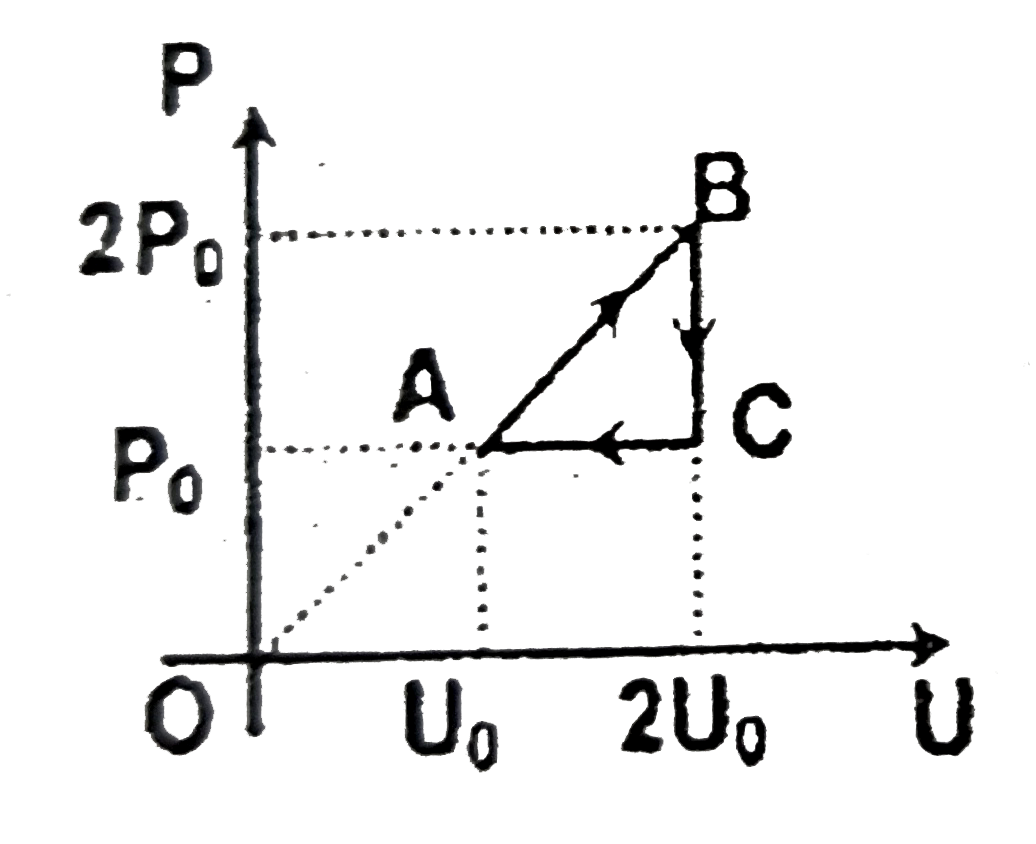 View Solution
One mole of a monatomic ideal gas undergoes a cyclic process as shown in the figure (where V is the volume and T is the temperature). Which of the statements below is (are) true ?
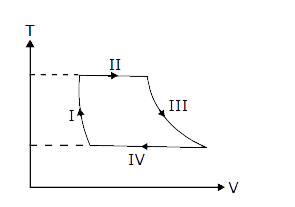 View Solution
One mole of a monatomic ideal gas undergoes a cyclic process as shown in the figure (where V is the volume and T is the temperature). Which of the statements below is (are) true?
 View Solution
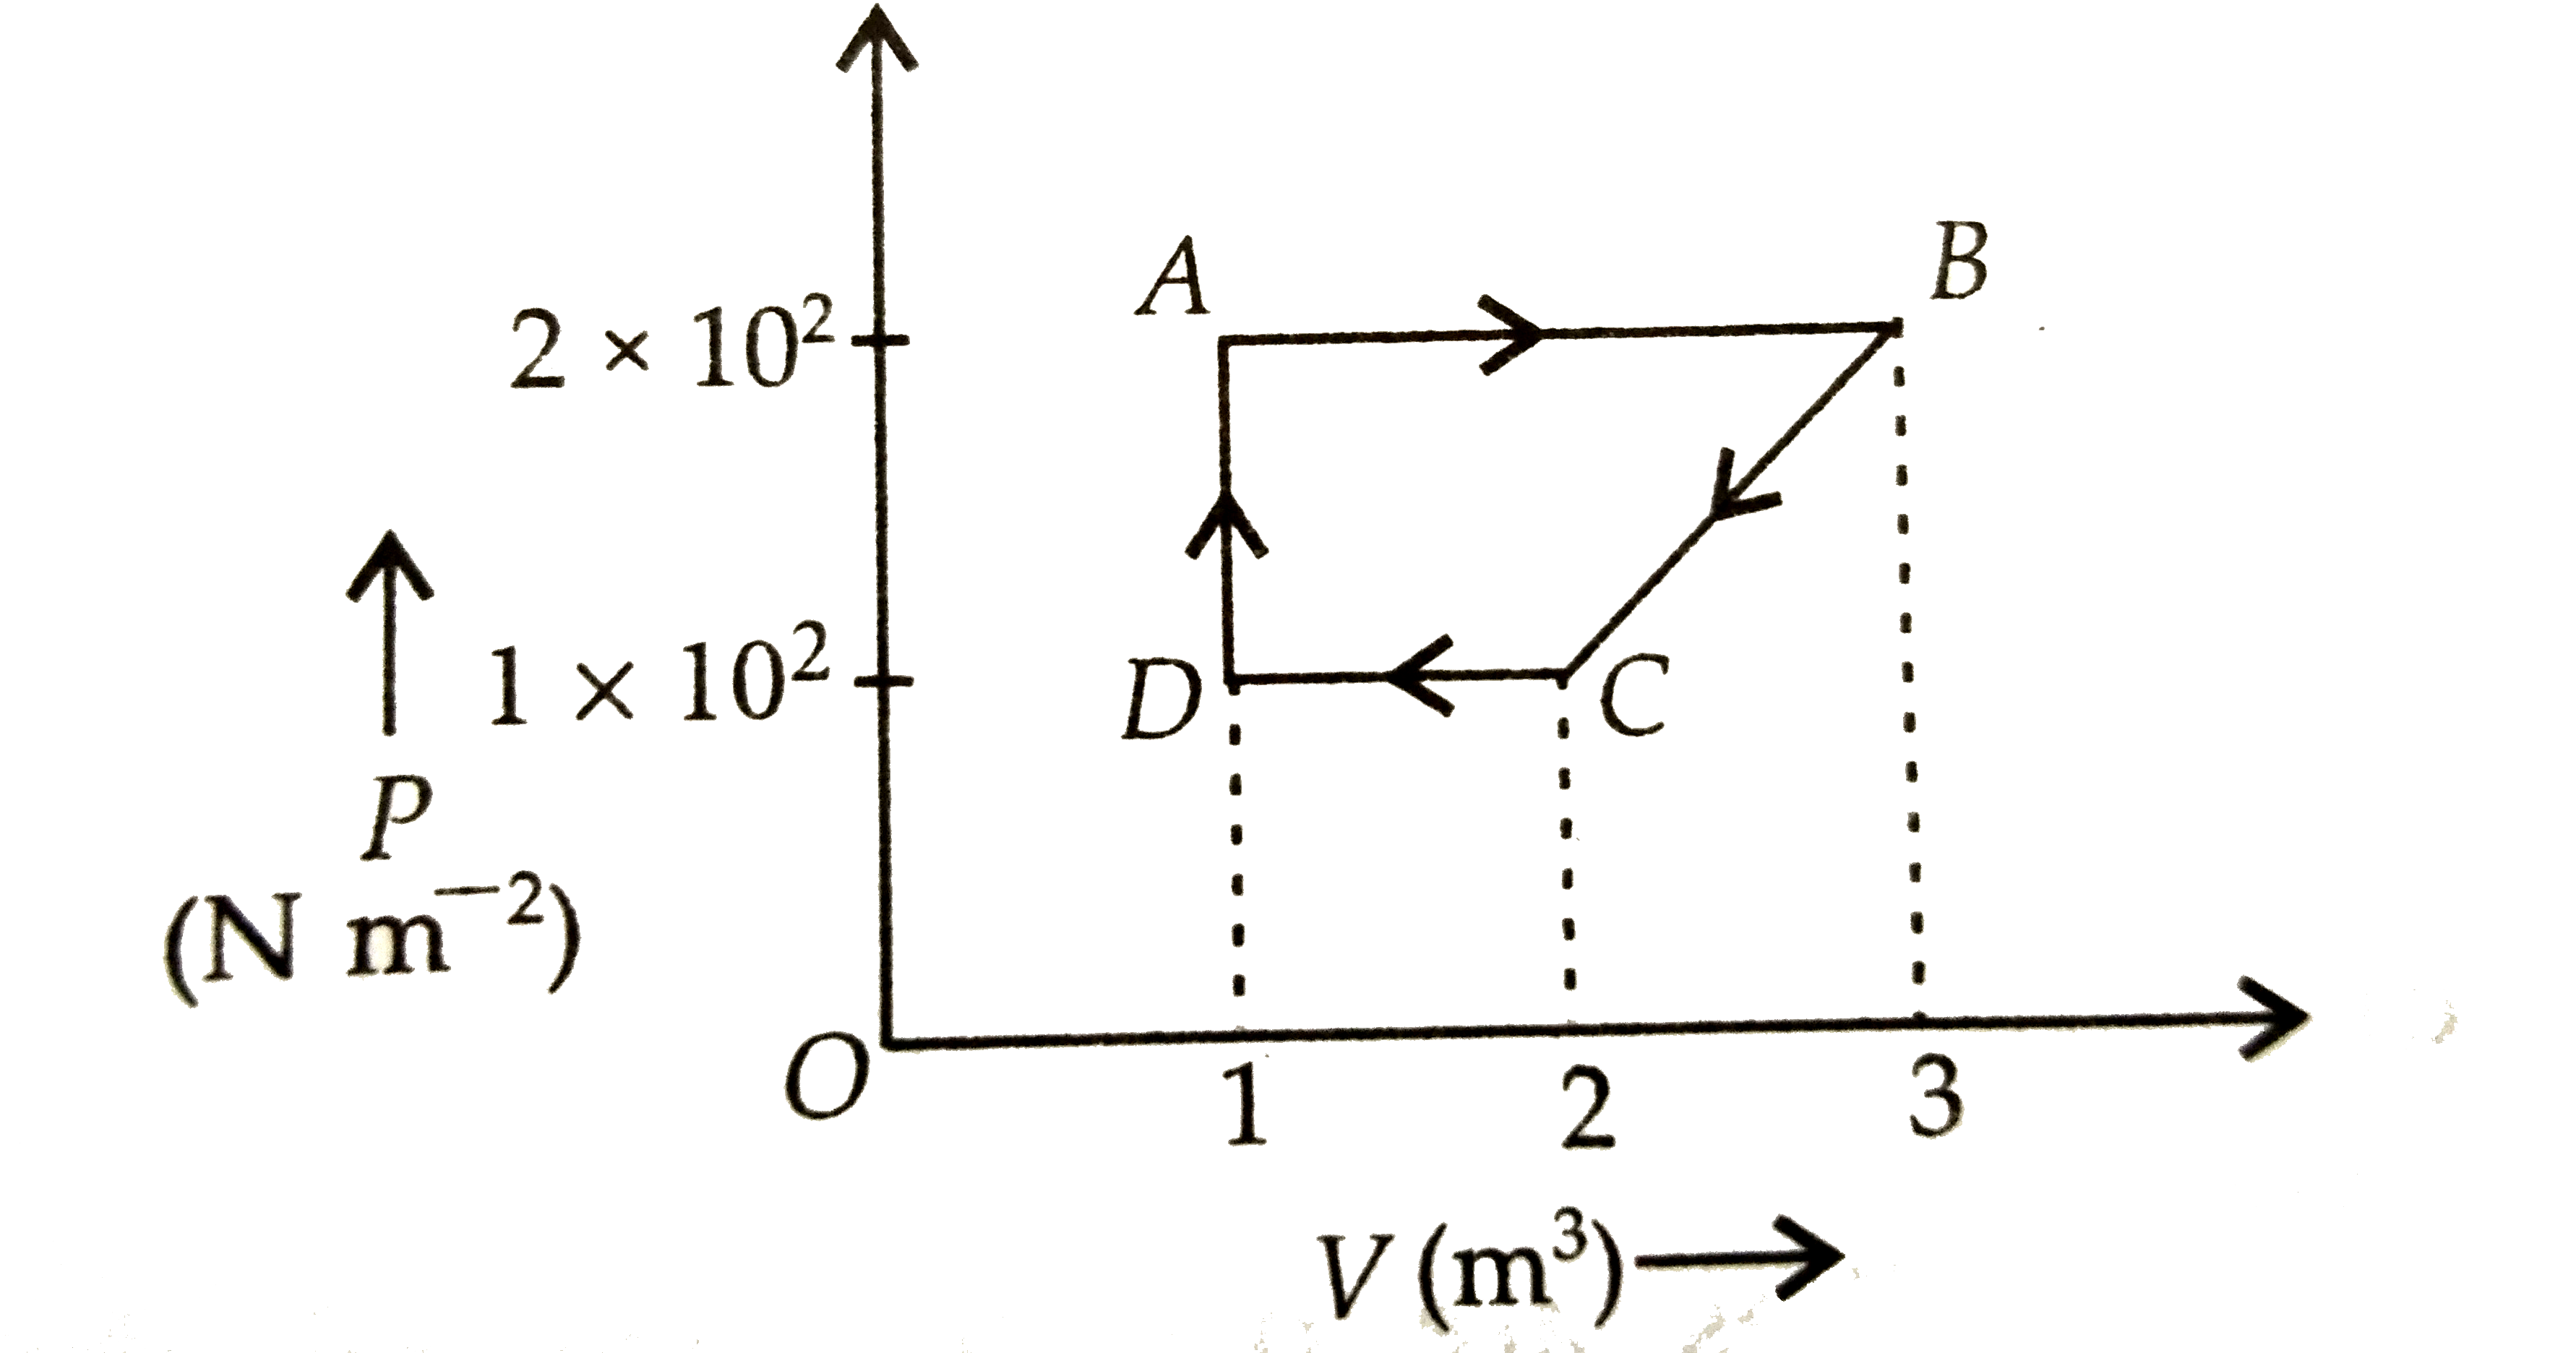
A cyclic process is shown in the figure. Work done during the cyclic process ABCDA is
 View Solution
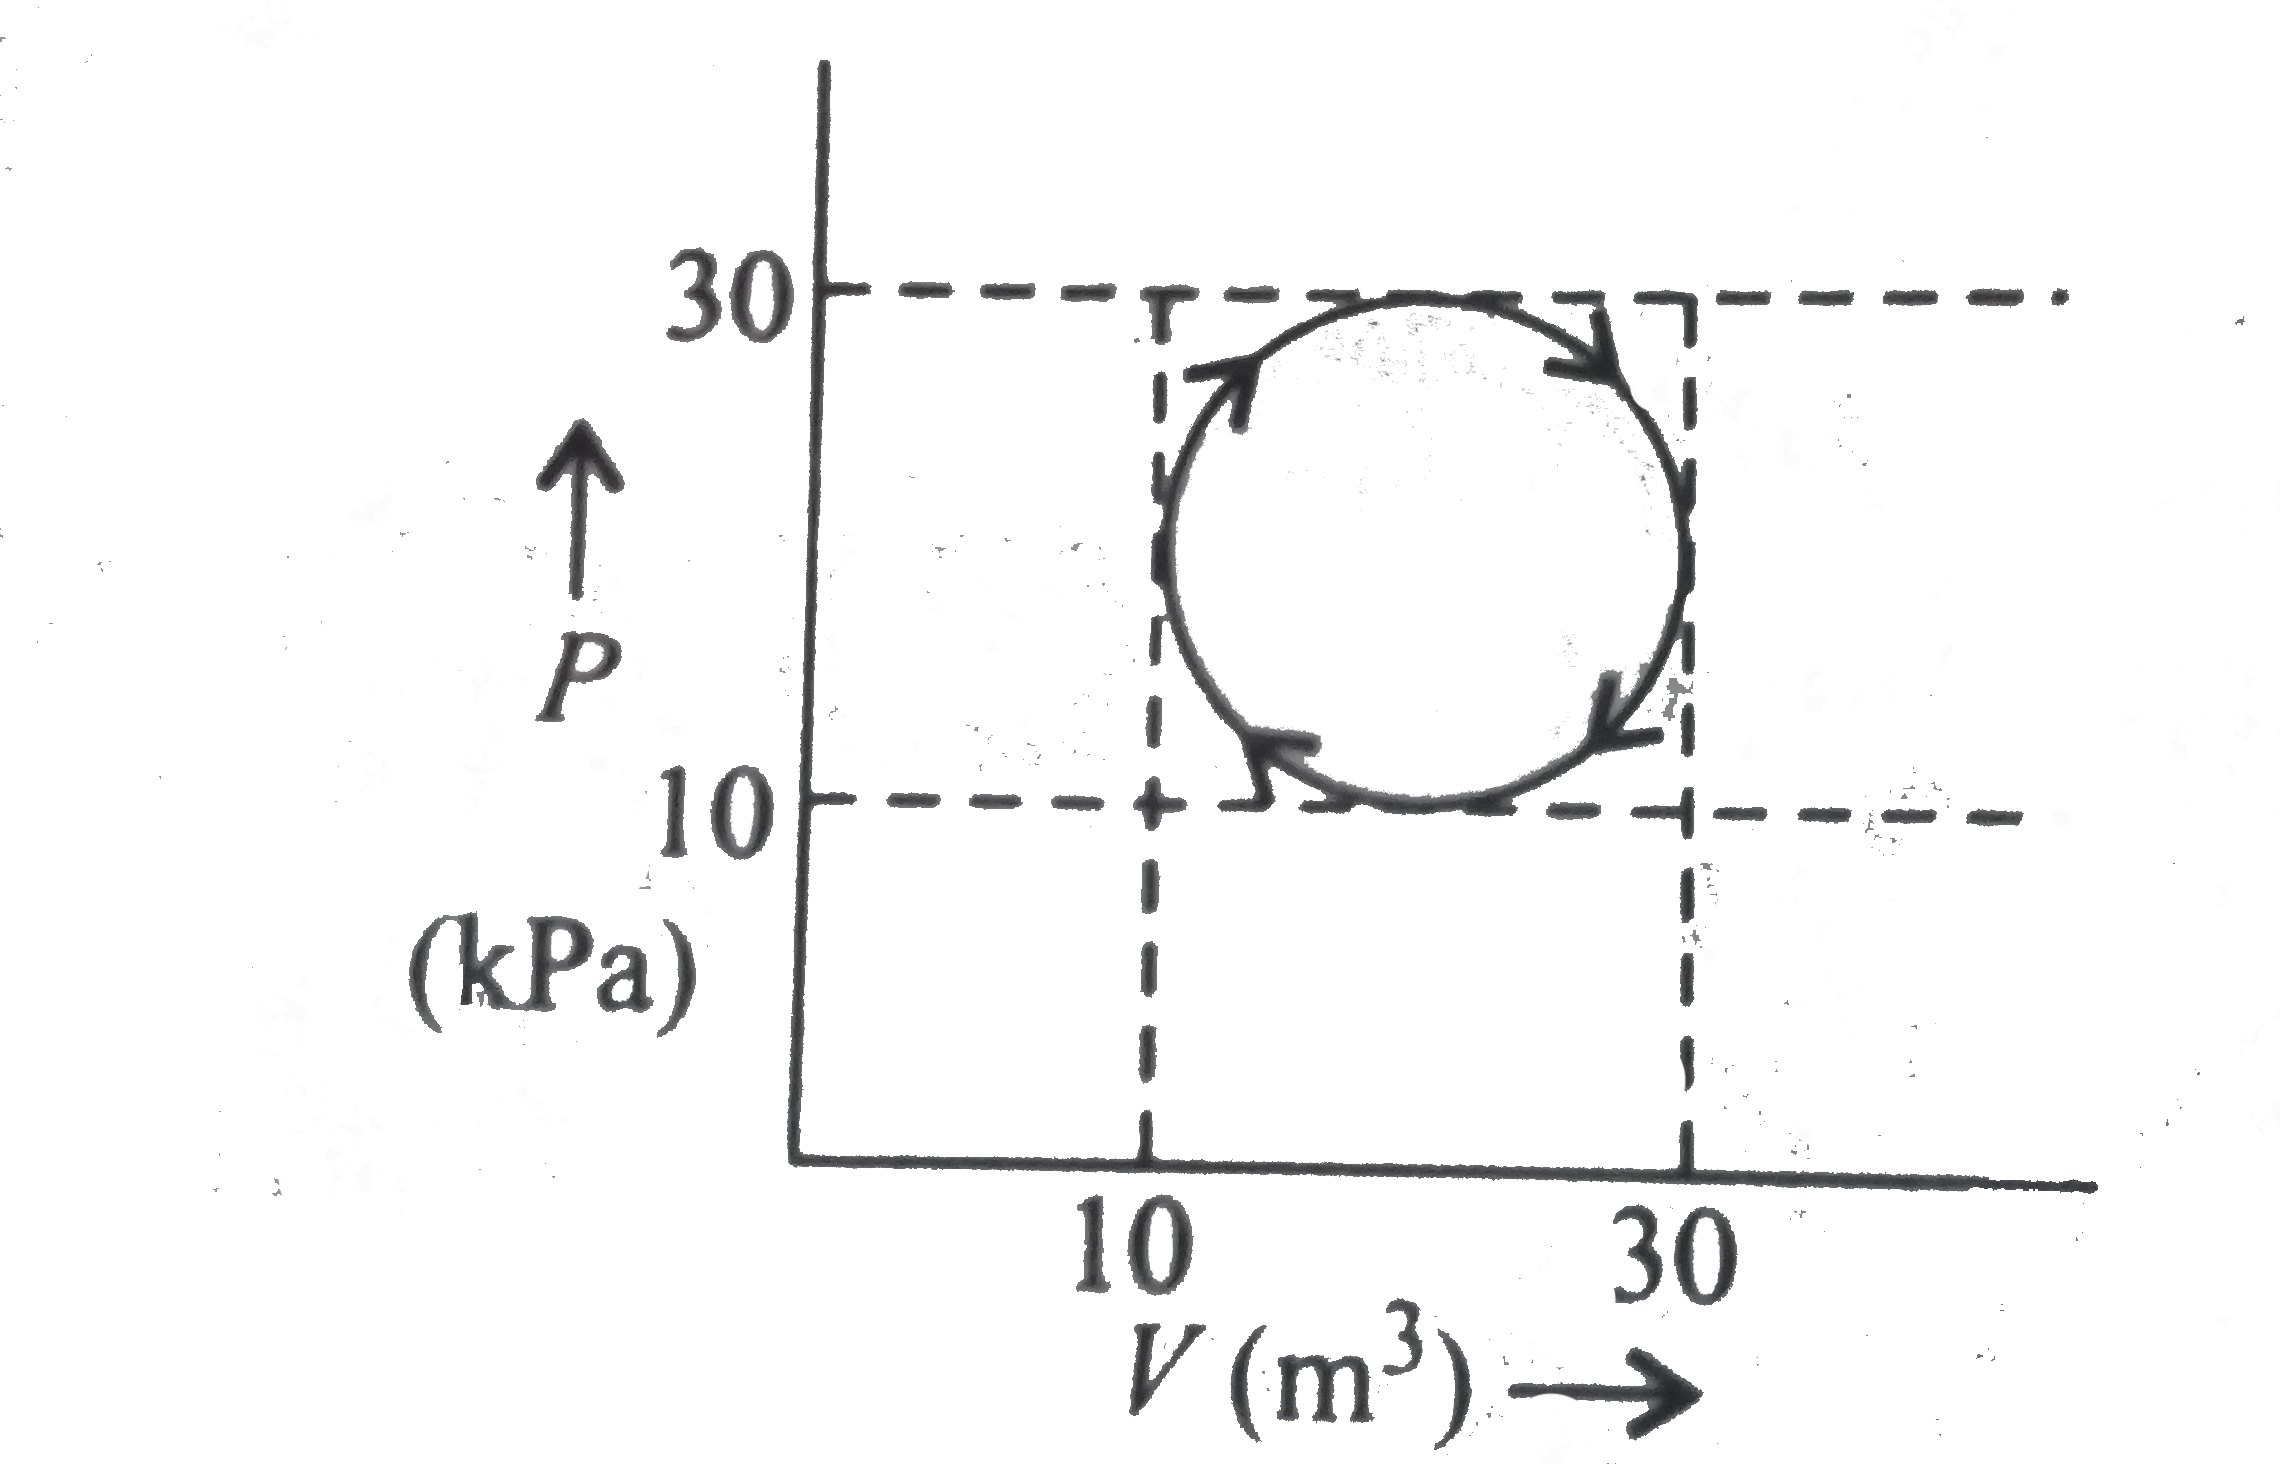
Which one is not correct for a cyclic process as shown in the figure ?
 View Solution

