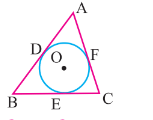
পাশের ছবিতে △ABC-এর অন্তবৃত্ত AB, BC ও CA যথাক্রমে D, E ও F বিন্দুতে স্পর্শ করেছে। প্রমাণ করো যে, AD+BE+CF=AF+CE+BD=△ABC -এর পরিসীমার অর্ধেক। 
Step by step video & image solution for পাশের ছবিতে triangleABC-এর অন্তবৃত্ত AB, BC ও CA যথাক্রমে D, E ও F বিন্দুতে স্পর্শ করেছে। প্রমাণ করো যে, AD+BE+CF = AF+CE+BD =triangleABC -এর পরিসীমার অর্ধেক। by Maths experts to help you in doubts & scoring excellent marks in Class 10 exams.
Updated on:21/07/2023Topper's Solved these Questions
- বৃত্তের স্পর্শক সংক্রান্ত উপপাদ্যBOOK - NCERT BANGLISH (BANGLISH MEDIUM)CHAPTER - বৃত্তের স্পর্শক সংক্রান্ত উপপাদ্যEXERCISE - EXERCISE
23 Videos
- বৃত্তের স্পর্শক অঙ্কন BOOK - NCERT BANGLISH (BANGLISH MEDIUM)CHAPTER - বৃত্তের স্পর্শক অঙ্কন EXERCISE - EXERCISE
8 Videos
- ভেদBOOK - NCERT BANGLISH (BANGLISH MEDIUM)CHAPTER - ভেদEXERCISE - EXERCISE
38 Videos
Similar Questions
16 সেমি. দৈর্ঘ্যের ব্যাস বিশিষ্ট একটি বৃত্তের কেন্দ্র থেকে 17 সেমি. দূরত্বে অবস্থিত বহিঃস্থ একটি বিন্দু থেকে অঙ্কিত বৃত্তের স্পর্শকের দৈর্ঘ্য হিসাব করে লেখো।
View Solution2.8 সেমি. দৈর্ঘ্যের ব্যাসার্ধবিশিষ্ট একটি বৃত্ত অঙ্কন করো । বৃত্তের কেন্দ্র থেকে 7.5 সেমি. দূরে একটি বিন্দু নাও । ওই বহিঃস্থ বিন্দু থেকে বৃত্তের স্পর্শক অঙ্কন করো ।
View Solutionবিপিনকাকুর ট্যাক্সি 25 মিনিটে 14 কিমি. পথ অতিক্রম করে। একই গতিবেগে ট্যাক্সি চালিয়ে 5 ঘণ্টায় তিনি কতটা পথ যাবেন তা ভেদতত্ত্ব প্রয়োগ করে হিসাব করো।
View SolutionHow many lines of symmetry does the above figure have ?
View SolutionWhich of the following are correct chain isomers of butane ? (i)
View SolutionDetermine the point of symmetry of a regular hexagon.
View SolutionDtermine the images of the following figure about the given line :
View SolutionIn the figure above (not to scale), ¯¯¯¯¯¯AB⊥¯¯¯¯¯¯CDandAD is the bisector of ∠BAE.AB=3cm and AC=5cm. Find CD.
View SolutionMatch the following Column A to Column B

View SolutionMatch the following Column A to Column B

View SolutionMatch the following Column A to Column B

View SolutionThe inequation represented by the graph given below is :
View SolutionThe inequation that best describes the graph given below is _________
View SolutionThe inequation that best describes the following graph is _________
View SolutionWhich inequations represent the shaded region in the given figure
View Solution
