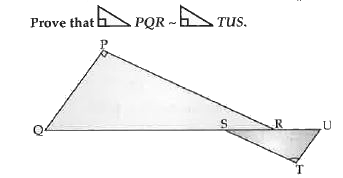
In the figure, ∠QPR=∠UTS=90∘ and PR∣∣TS. Prove that
 Solution in Kannada
The correct Answer is:ΔPQR~ΔTUS
Step by step video, text & image solution for In the figure, /_ QPR = /_ UTS = 90^(@) and PR || TS. Prove that by Maths experts to help you in doubts & scoring excellent marks in Class 10 exams.
Topper's Solved these Questions
- BOOK - OSWAAL PUBLICATIONCHAPTER - TRIANGLESEXERCISE - TOPIC-1 BASIC PROPORTIONALITY THEOREM (LONG ANSWER TYPE QUESTIONS)16videos
TRIANGLES
- BOOK - OSWAAL PUBLICATIONCHAPTER - TRIANGLESEXERCISE - TOPIC-1 BASIC PROPORTIONALITY THEOREM (VERY SHORT ANSWER TYPE QUESTIONS)17videos
TRIANGLES
- BOOK - OSWAAL PUBLICATIONCHAPTER - TRIANGLESEXERCISE - TEXTBOOK CORNER (EXERCISE 2.6)10videos
TRIANGLES
- BOOK - OSWAAL PUBLICATIONCHAPTER - SURFACE AREA AND VOLUMESEXERCISE - EXERCISE 15.55videos
SURFACE AREA AND VOLUMES
Similar Questions
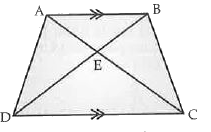
In the trapezium ABCD, AB∣∣DC and ΔARD - ΔBEC. Then Prove that AD = BC.
 01:37View Solution
State "Basic proportionality theorem"
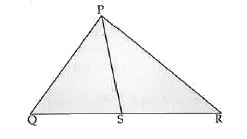
02:11View SolutionIn the figure given below, PS is the bisector of ∠QPR of ΔPQR . Prove that QSSR=PQPR
 01:31View Solution
A copper wire, 3mm in diameter , is wound about a cylinder whose length is 12cm, and diameter 10cm, so as to cover the curved surface of the cylinder . Find the length and mass of the wire, assuming the density of copper to be 8.88gpercm3
02:45View SolutionHow many lines of symmetry does the above figure have ?
02:17View SolutionDetermine the point of symmetry of a regular hexagon.
05:41View SolutionDtermine the images of the following figure about the given line :
02:21View SolutionMatch the following Column A to Column B
 02:03View Solution
Match the following Column A to Column B
 02:10View Solution
Match the following Column A to Column B
 02:17View Solution
Find the area of the figure given below.
 02:10View Solution
The area of the shaded part in the figure given below is ______.
 04:23View Solution
The inequation represented by the graph given below is :
01:59View SolutionThe inequation that best describes the graph given below is _________
01:19View SolutionThe inequation that best describes the following graph is _________
01:52View Solution

