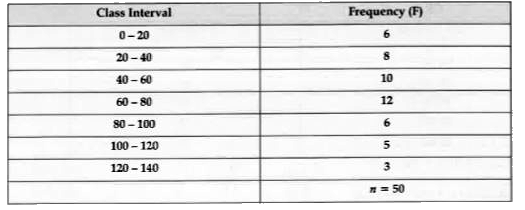
Consider the following distribution:

(i) Calculate the frequency of the class 30-40.
(ii) Calculate the class mark of the class 10-25 Solution in Kannada
Step by step video & image solution for Consider the following distribution: (i) Calculate the frequency of the class 30-40. (ii) Calculate the class mark of the class 10-25 by Maths experts to help you in doubts & scoring excellent marks in Class 10 exams.
Updated on:21/07/2023Topper's Solved these Questions
- STATISTICSBOOK - OSWAAL PUBLICATIONCHAPTER - STATISTICSEXERCISE - TOPIC -1 MEAN, MEDIAN AND MODE (LONG ANSWER TYPE QUESTIONS- I )
11 Videos
- STATISTICSBOOK - OSWAAL PUBLICATIONCHAPTER - STATISTICSEXERCISE - TOPIC -1 MEAN, MEDIAN AND MODE (LONG ANSWER TYPE QUESTIONS - II )
12 Videos
- STATISTICSBOOK - OSWAAL PUBLICATIONCHAPTER - STATISTICSEXERCISE - TOPIC -1 MEAN, MEDIAN AND MODE (VERY SHORT ANSWER TYPE QUESTIONS )
1 Videos
- SSLC KARNATAKA TOPPERS' ANSWERS MARCH 2018 Class-XBOOK - OSWAAL PUBLICATIONCHAPTER - SSLC KARNATAKA TOPPERS' ANSWERS MARCH 2018 Class-XEXERCISE - SECTION-E
4 Videos
- SURFACE AREA AND VOLUMESBOOK - OSWAAL PUBLICATIONCHAPTER - SURFACE AREA AND VOLUMESEXERCISE - EXERCISE 15.5
5 Videos
Similar Questions
Calculate the median for the following data

View SolutionLiteracy rates of 40 cities ue given in the following table. U it is given that mean literacy rate is 63.S, then find the missing frequencies x and y.

View SolutionIn the following frequency distribution, find the median class.

View SolutionSolve the equation x2−x−2=0 graphically.
View SolutionA copper wire, 3mm in diameter , is wound about a cylinder whose length is 12cm, and diameter 10cm, so as to cover the curved surface of the cylinder . Find the length and mass of the wire, assuming the density of copper to be 8.88gpercm3
View SolutionHow many lines of symmetry does the above figure have ?
View SolutionWhich of the following are correct chain isomers of butane ? (i)
View SolutionDetermine the point of symmetry of a regular hexagon.
View SolutionDtermine the images of the following figure about the given line :
View SolutionMatch the following Column A to Column B

View SolutionMatch the following Column A to Column B

View SolutionMatch the following Column A to Column B

View SolutionCalculate the volume of the given solid.
ltimg src="https://d10lpgp6xz60nq.cloudfront.net/physics_images/PS_MATH_VII_C06_E03_002_Q01.png" width="80%"gt
View SolutionThe inequation represented by the graph given below is :
View SolutionThe inequation that best describes the graph given below is _________
View SolutionThe inequation that best describes the following graph is _________
View Solution
