The the following table, the area of plates and separation benvcen the places are given. In the nearby figure, q→ V graph for the,n are shown. Determine which graph is for which capacitor.

1→C2 2→C3 3→C1
1→C1 2→C2 3→C3
1→C2 2→C1 3→C3
1→C3 2→C1 3→C2
The correct Answer is:A, B, C
C1=ε0Ad,C2=ε0(2A)d,C3=ε0A2d
From this relation C2>C1>C3
Moreover slope of graph q→ V indicates capacitances .
∴ The slope of 1 is highest, hence it is C2 capacitor. The slope of 3 is lowest hence it is C3 capacitor and slope of 2 is lower than 1 and higher than 3, hence it is C1 capacitor.
∴ Correct option is (C)
Topper's Solved these Questions
- ELECTROSTATIC POTENTIAL AND CAPACITANCEBOOK - KUMAR PRAKASHANCHAPTER - ELECTROSTATIC POTENTIAL AND CAPACITANCEEXERCISE - Section D ( MCQs asked in Cometitive Exams )
39 Videos
- ELECTROSTATIC POTENTIAL AND CAPACITANCEBOOK - KUMAR PRAKASHANCHAPTER - ELECTROSTATIC POTENTIAL AND CAPACITANCEEXERCISE - Section C ( NCERT Exemplar Solution ) ( Long Answer Type Questions )
12 Videos
- ELECTROMAGNETIC WAVESBOOK - KUMAR PRAKASHANCHAPTER - ELECTROMAGNETIC WAVESEXERCISE - BOARD.S QUESTION PAPER MARCH - 2020 (PART - B) SECTION - C
5 Videos
- MAGNETISM AND MATTERBOOK - KUMAR PRAKASHANCHAPTER - MAGNETISM AND MATTEREXERCISE - SECTION D Multiple Choice Questions (MCQs) (MCQs asked in Competitive Exams) MCQs asked in Board Exam and GUJCET
7 Videos
Similar Questions
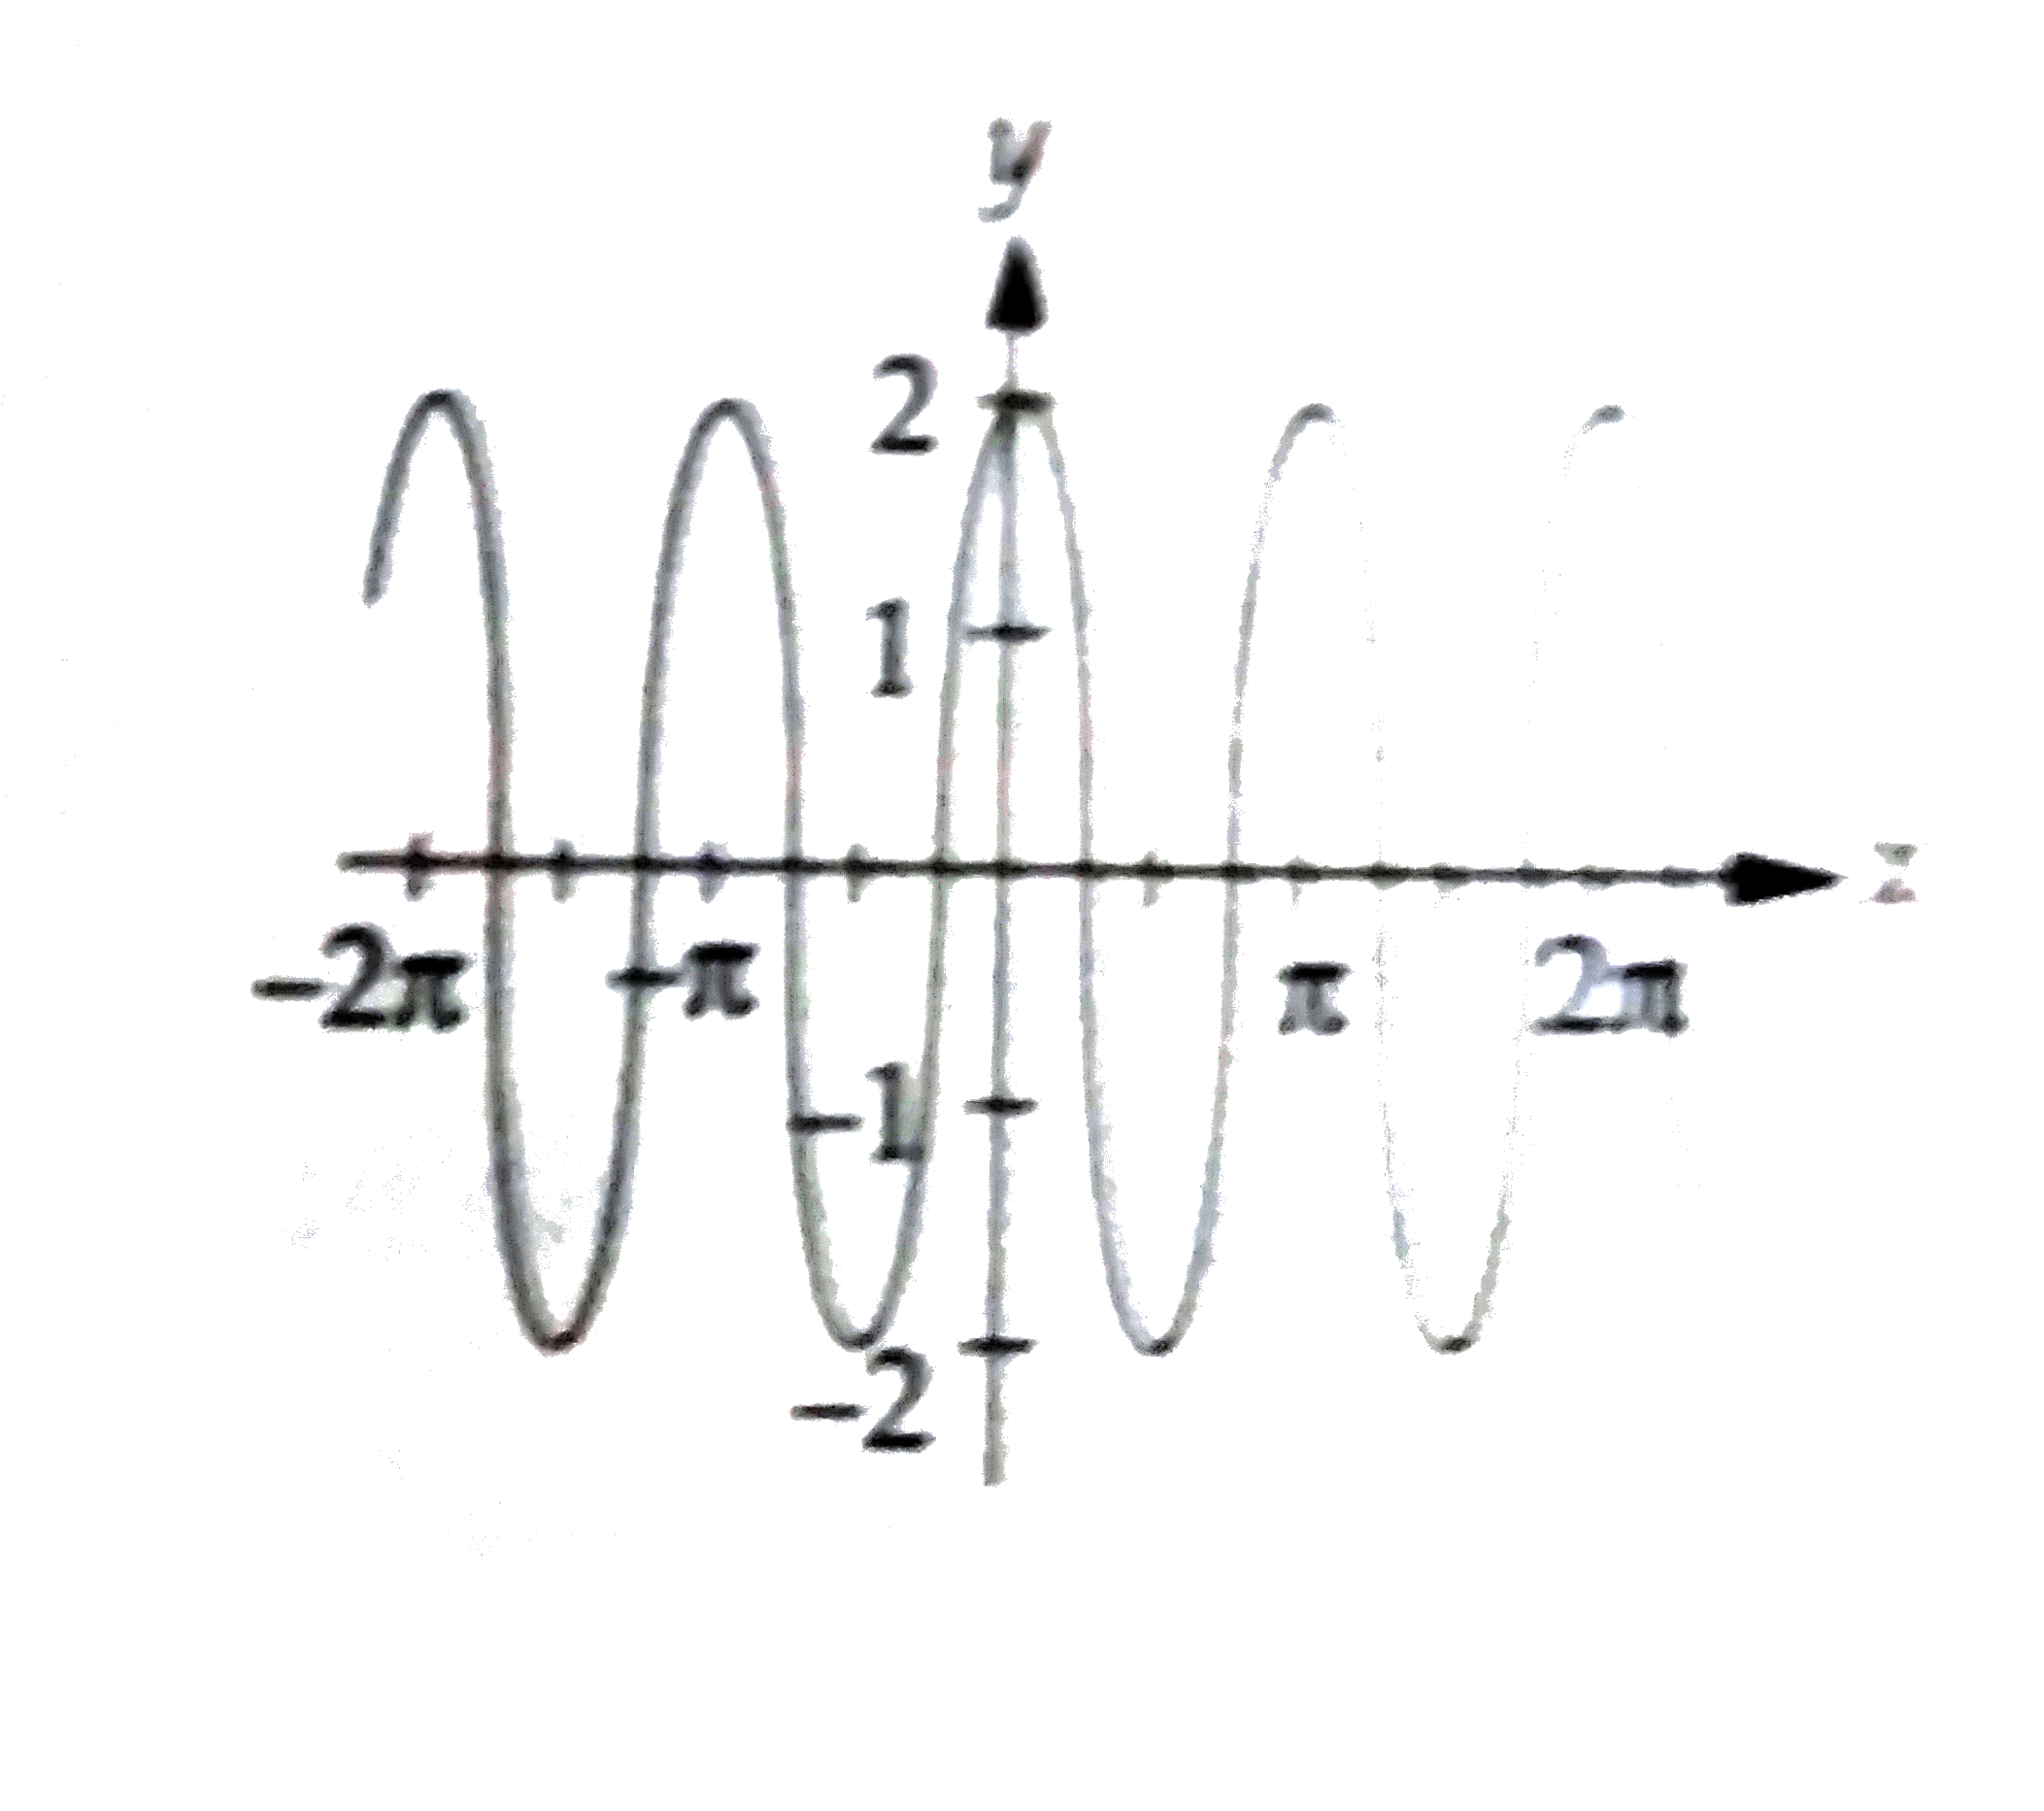
Which of the following is an equation of the graph shown in Figure
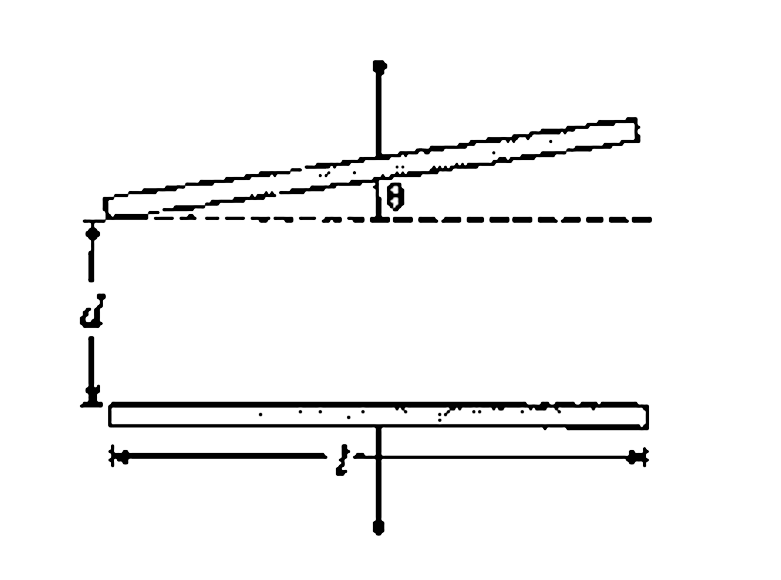
View SolutionFigure shows a parallel plate capacitor with its plate area A=lb and plate separation d at left end of the plates. Upper plate of capacitor is slightly tilted by a very small angle 8 as shown. Find the capacitance of this capacitor.
View Solution
Knowledge Check
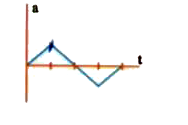
Which of the following v Vs t graph are correct representation for the acceleration Vs time graph shown below
 A
A B
B C
C D
D
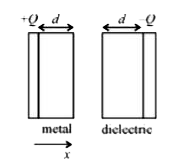
Plates of a parallel plate capacitor are at a separation 3d. Region between the plates is filled with a metal plate and a dielectric each of thickness d as shown. Which of the following graphs correctly represent variation of potential V with x?
 A
A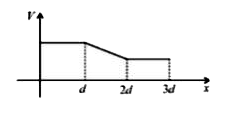 B
B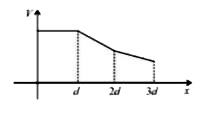 C
C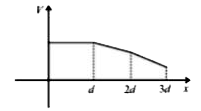 D
D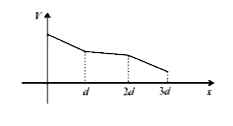
A condcuting slab of thickness d2 is inserted between the plates of parallel plate capacitor as shown in the figure . The energy stored in the capacitor when terminals of capacitor are connected across a battery of emf 2V is (plate area is A)
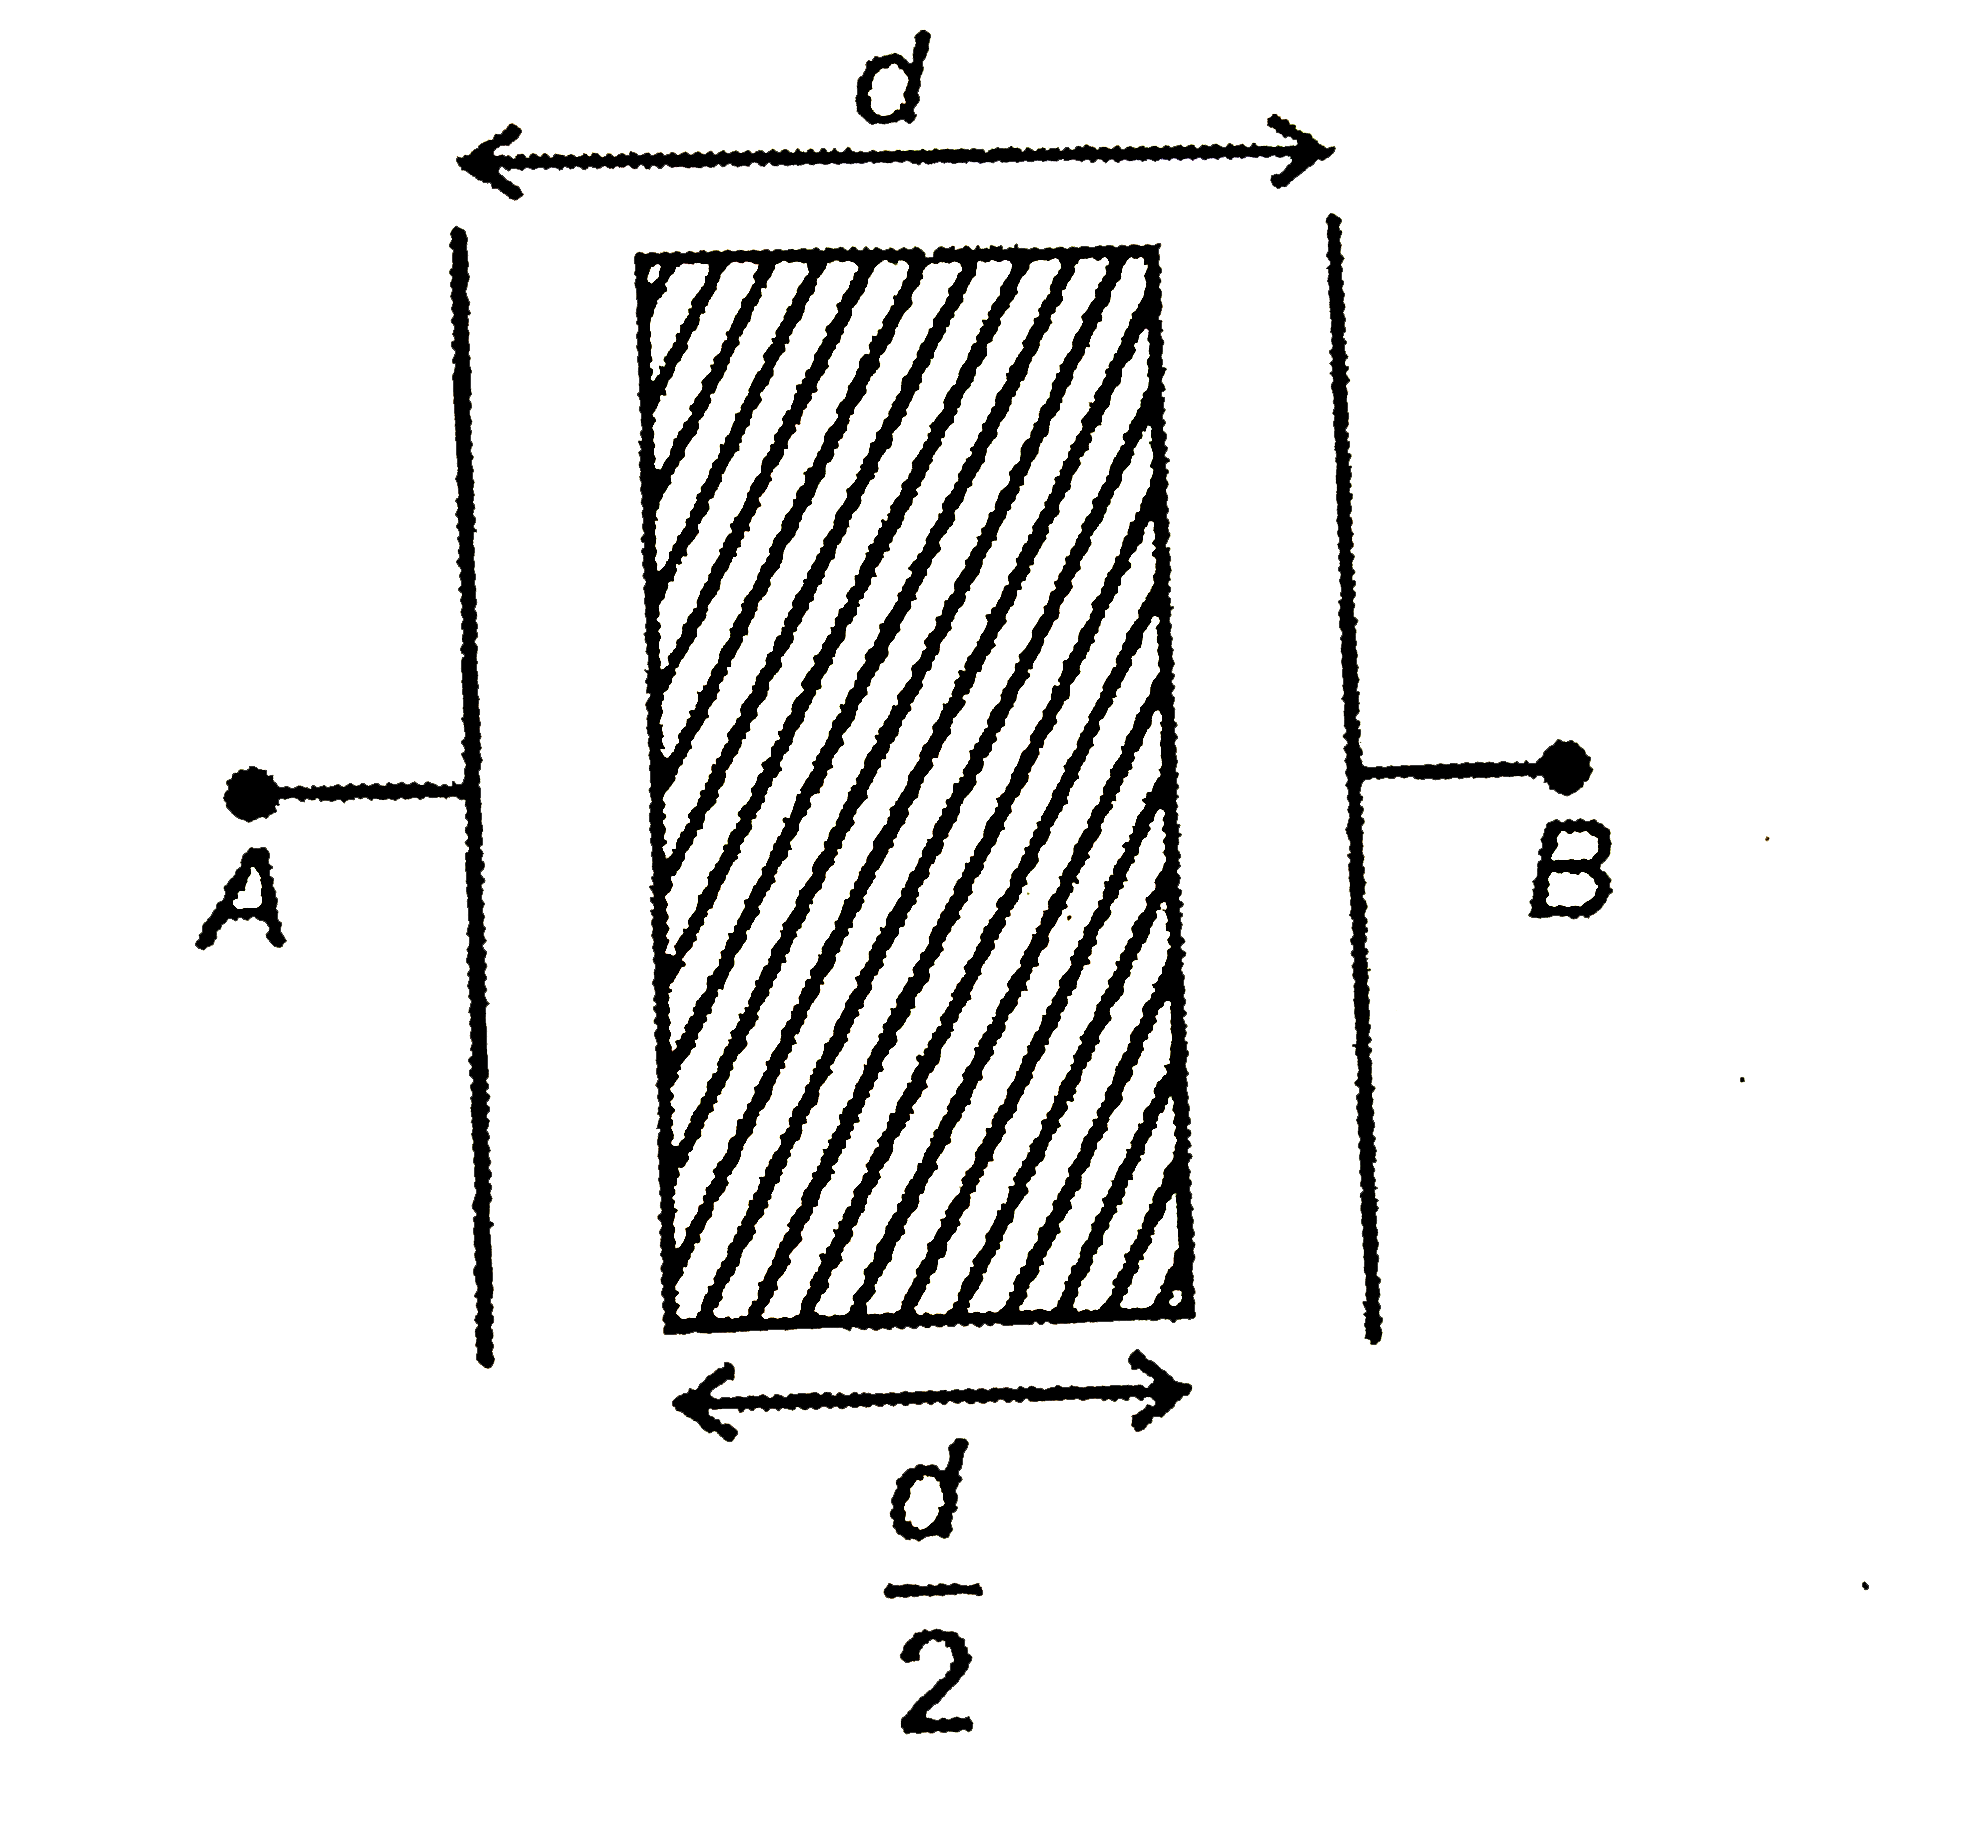 A2Aε0dV2BAε02dV2CAε0dV2D4Aε0dV2
Find the capacitances of the capacitance of the capacitors shown In figure .The plate area is A and the separation between the plate is d. Different dielectric slab in a particular part of the figure area of the same thickness and the entire gap between the plate is filled with the dielectric slabs.
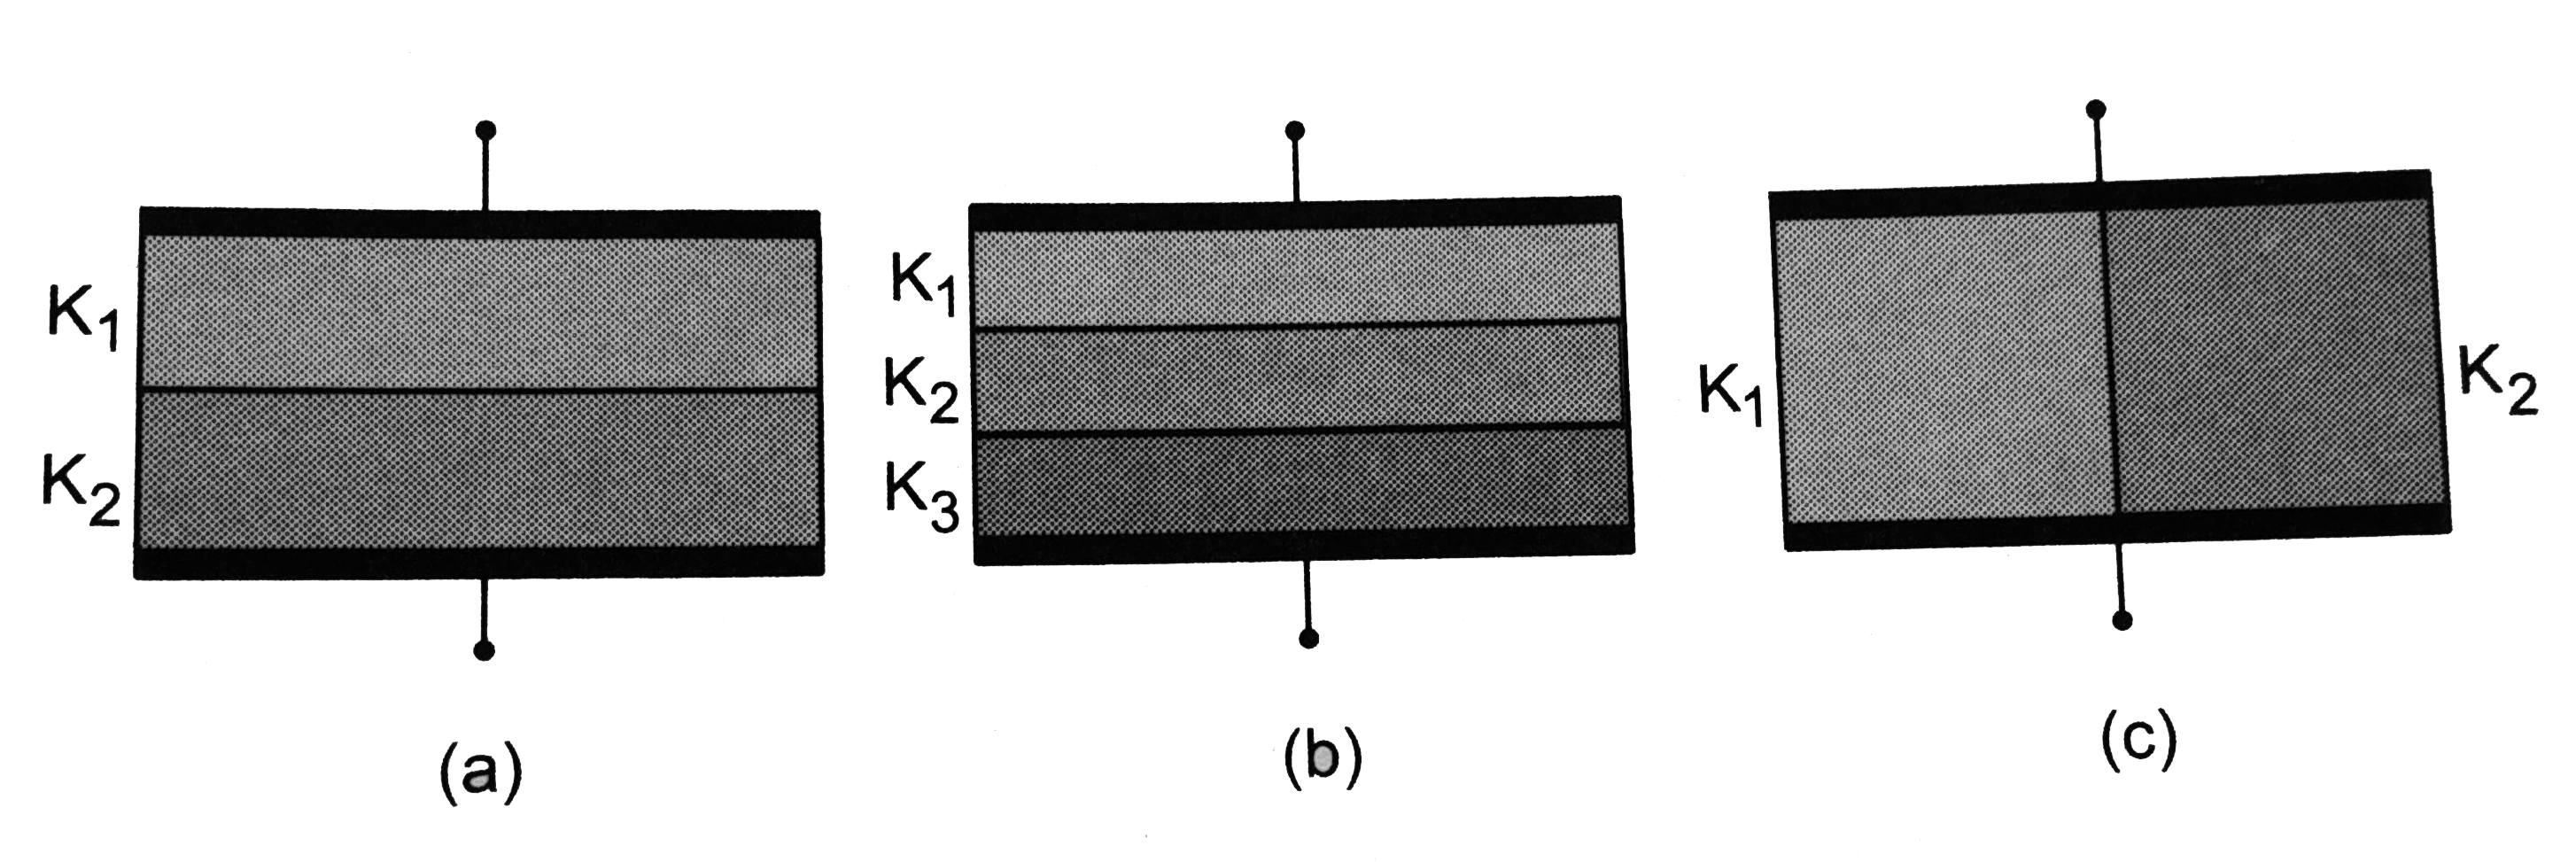
View SolutionFind the capacitances of the capacitance of the capacitors shown In figure .The plate area is Aand the separation between the plate is d. Different dielectric slabe in a particular part of the figure area of the same thickness and the entire gap between the plate is filled with the dielectric slabs.

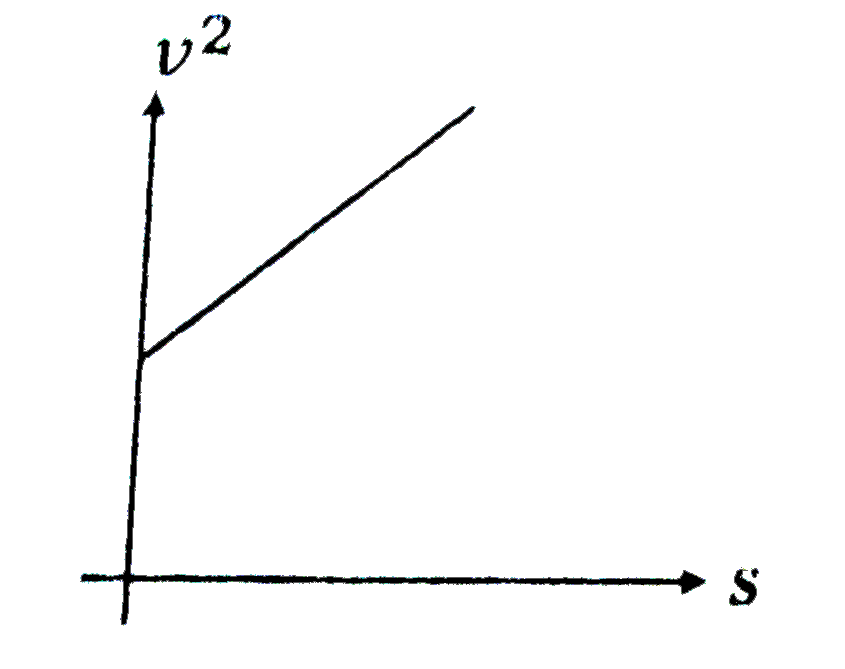
View Solutionv2 versus s-graph of a particle moving in a straight line is shown in the figure. From the graph some conculsions are drawn. State which statement is wrong ?
View SolutionA parallel -plate capacitor having plate area 25.0cm^2 and a separation2.00mm between the plates .the capacitor is connected to a battery of 12.0V. (a) Find the charge on the capacitor. (b) the plate separation is decreased to 1.00mm. Find the extra charge given by the battery to the positive plate.
View Solutionv2 versus s-graph of a particle moving in a straight line is shown in the figure. From the graph some conculsions are drawn. State which statement is wrong ?

View Solution
