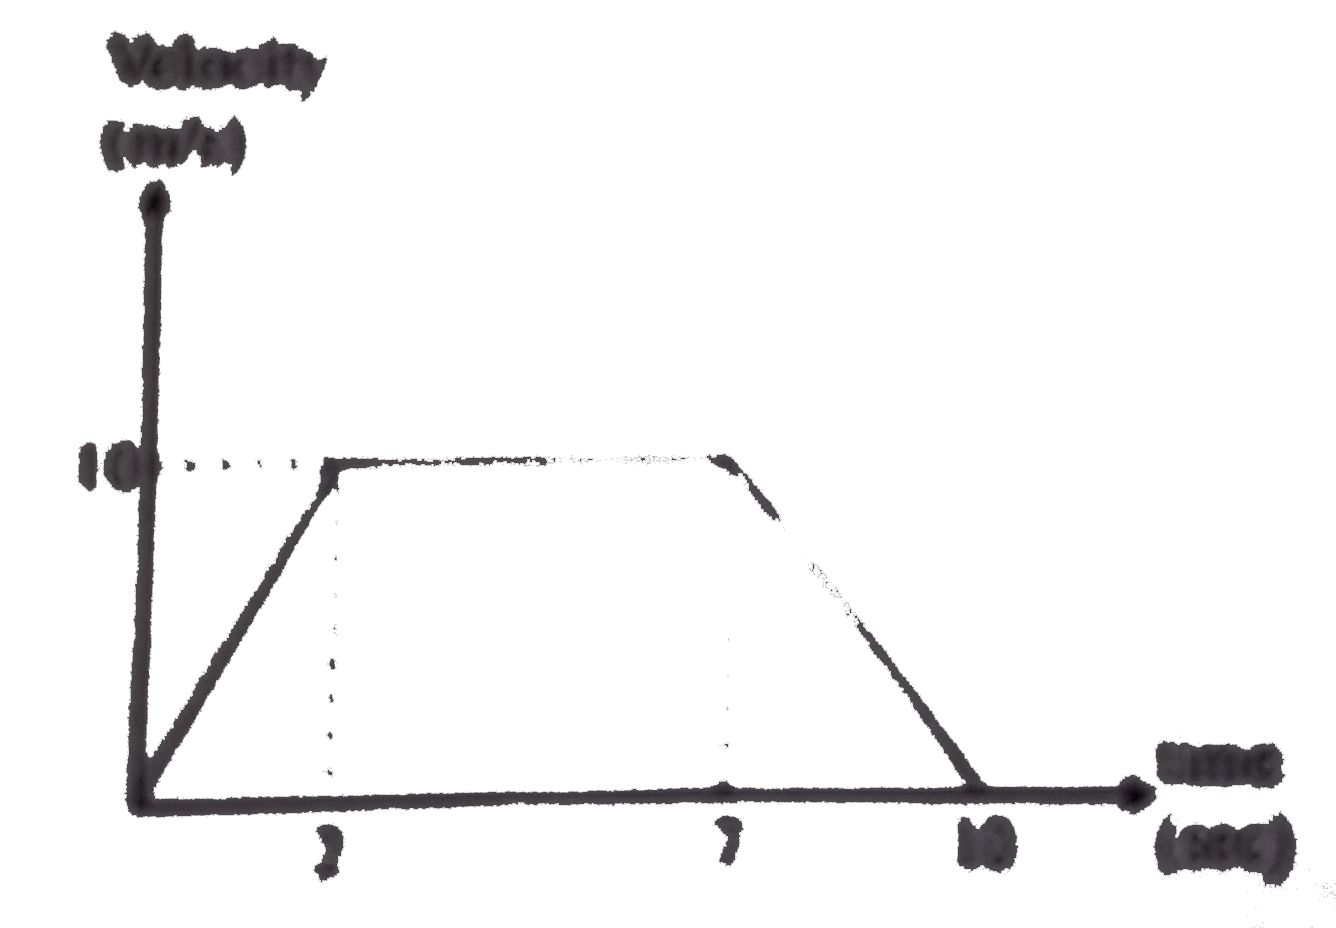
Figure gives the speed-time graph of the motion of a car. What is the ratio of the distance travelled by the car during the last two seconds to the total distance travelled in seven seconds?

19
29
13
49
The correct Answer is:B
Distance travelled in the last two seconds is
S = area of triangle BDC=12×20×2=20m
Total distance travelled in seven seconds is
S. = area of triangle OAE + area of rectangle ABDE +area of traingle BDC
=12×20×3×20×2+12×20×2×=90m
∴SS.=20m90m=29
Topper's Solved these Questions
- KINEMATICS BOOK - MTG GUIDECHAPTER - KINEMATICS EXERCISE - Topicwise Practice Questions (KINEMATIC EQUATIONS FOR UNIFORMLY ACCELERATED MOTION
48 Videos
- KINEMATICS BOOK - MTG GUIDECHAPTER - KINEMATICS EXERCISE - Topicwise Practice Questions (RELATIVE VELOCITY)
15 Videos
- KINEMATICS BOOK - MTG GUIDECHAPTER - KINEMATICS EXERCISE - Topicwise Practice Questions (ACCELERATION)
12 Videos
- GRAVITATIONBOOK - MTG GUIDECHAPTER - GRAVITATIONEXERCISE - AIPMT/NEET MCQS
32 Videos
- LAWS OF MOTIONBOOK - MTG GUIDECHAPTER - LAWS OF MOTIONEXERCISE - AIPMT /NEET (MCQ)
24 Videos
Similar Questions
The speed of a car increases uniformly from zero to 10ms−1 in 2s and then remains constant (figure)
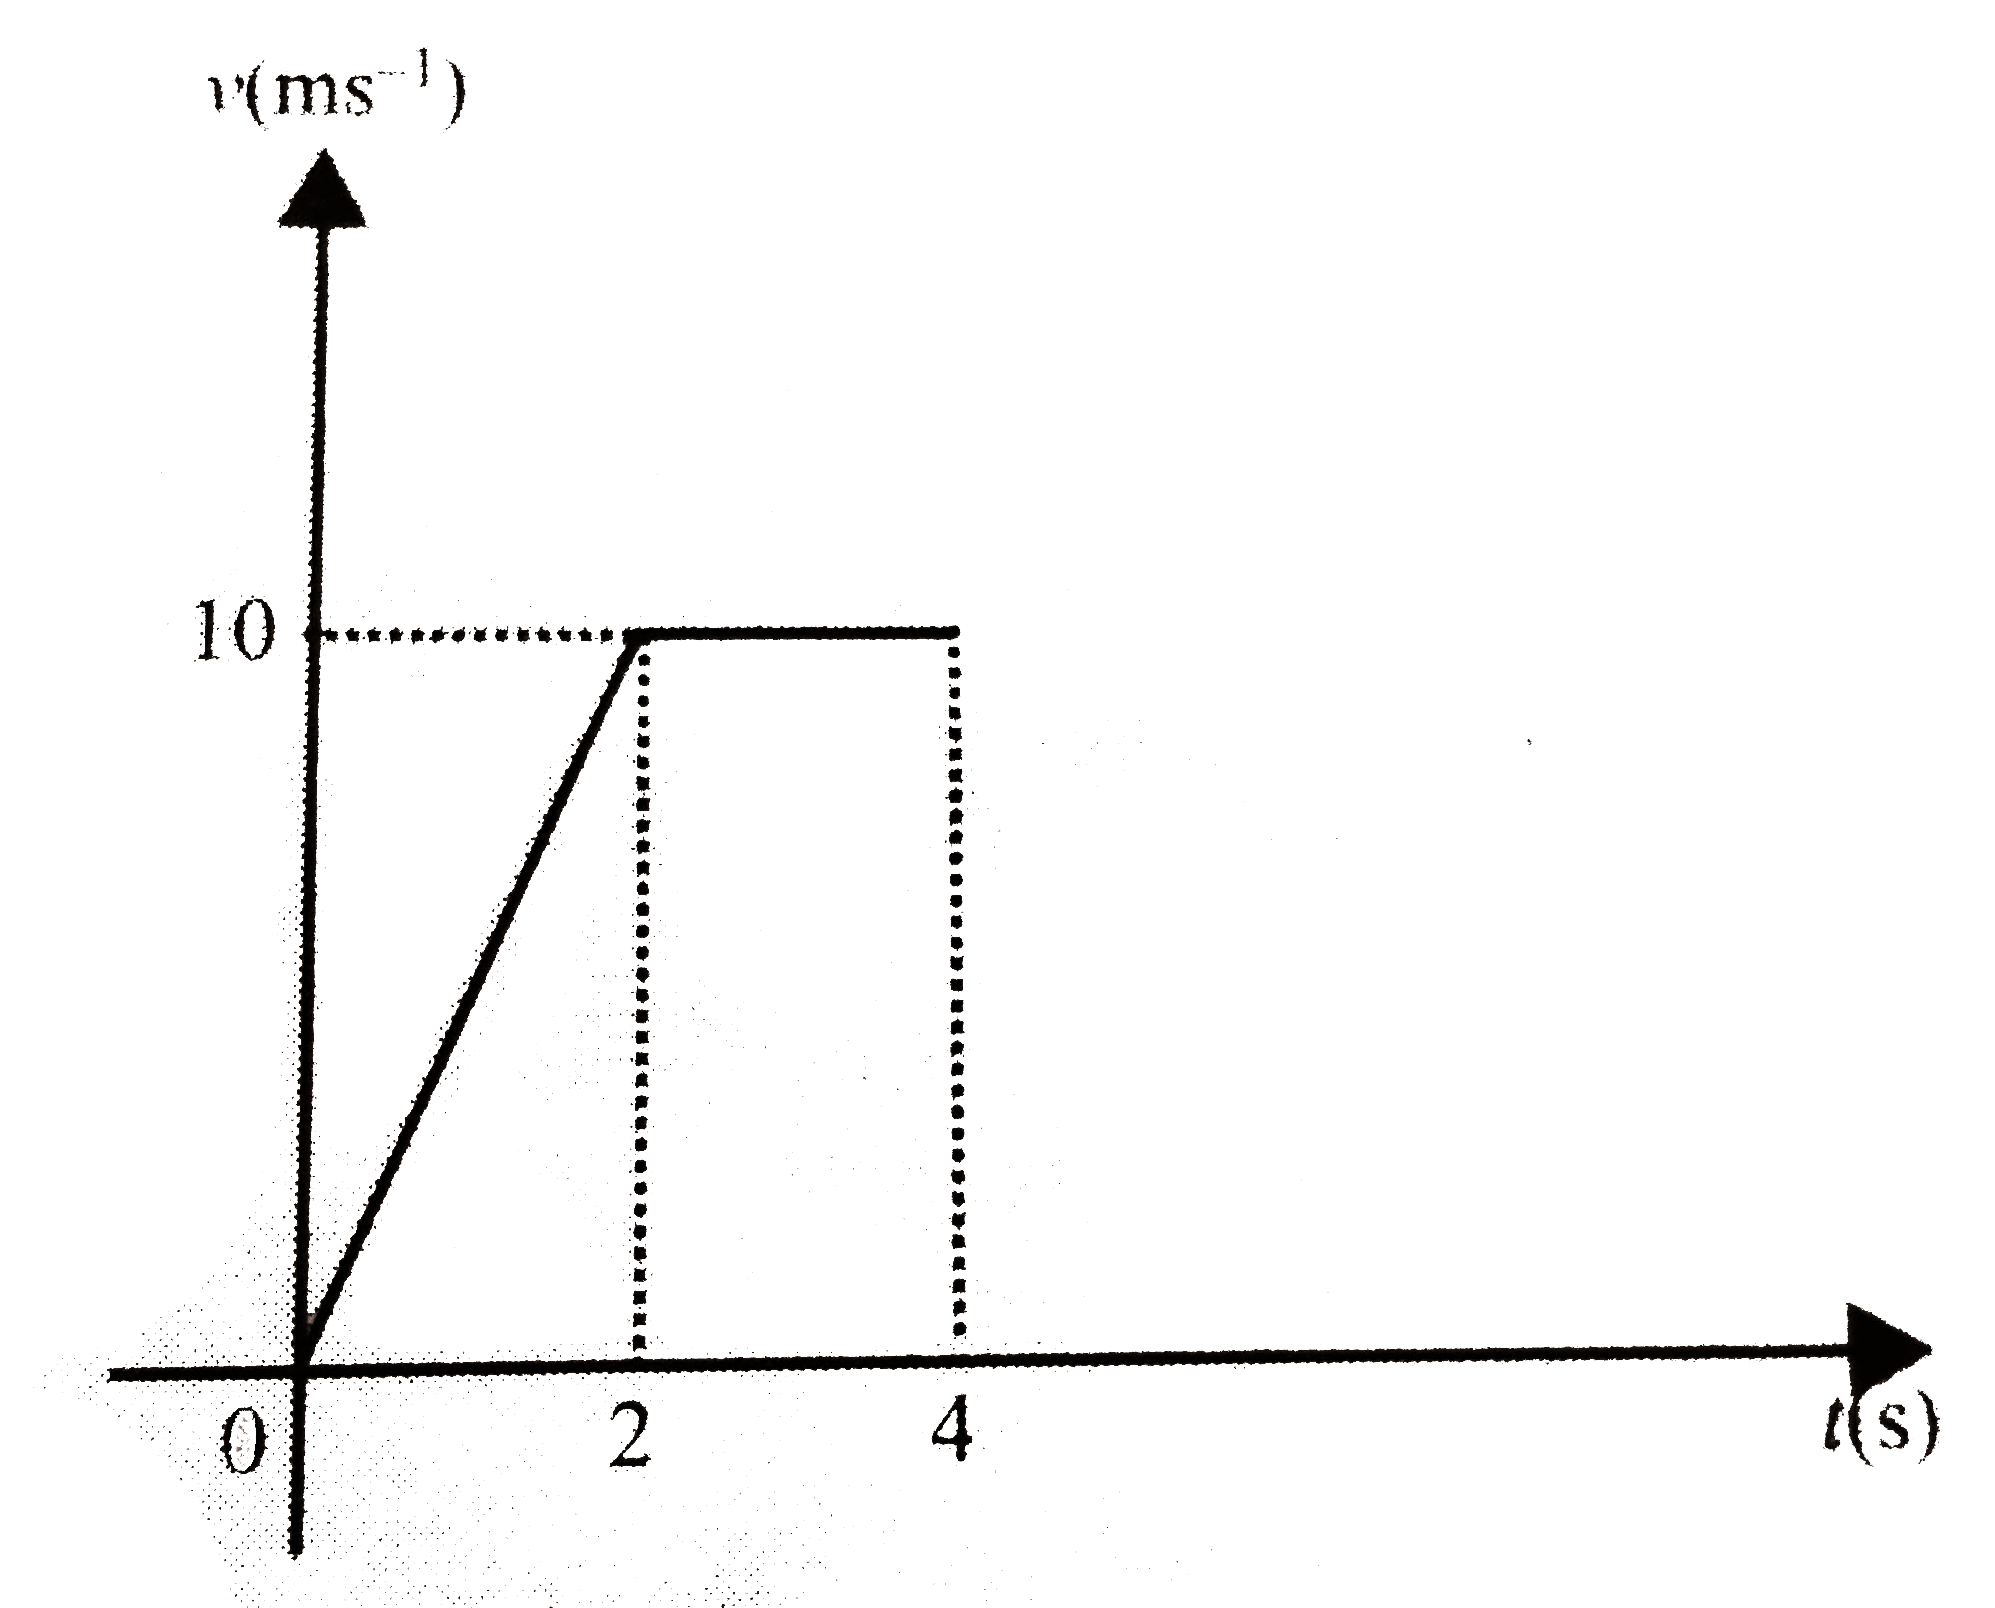
a. Find the distance travelled by the car in the first two seconds.
b. Find the distance travelled by the car in the next two seconds.
c. Find the total distance travelled in 4s.
View SolutionThe speed of a car increases uniformly from zero to 10ms−1 in 2s and then remains constant (figure)

a. Find the distance travelled by the car in the first two seconds.
b. Find the distance travelled by the car in the next two seconds.
c. Find the total distance travelled in 4s.
View Solution
Knowledge Check
In Q.94, total distance travelled by the car is:
Aα+β(α2+β2)t22Bα−β(α2+β2)t22Cαβ(α−β)t22Dαβ(α+β)t22Figure given shows the distance - time graph of the motion of a car. It follows from the graph that the car is
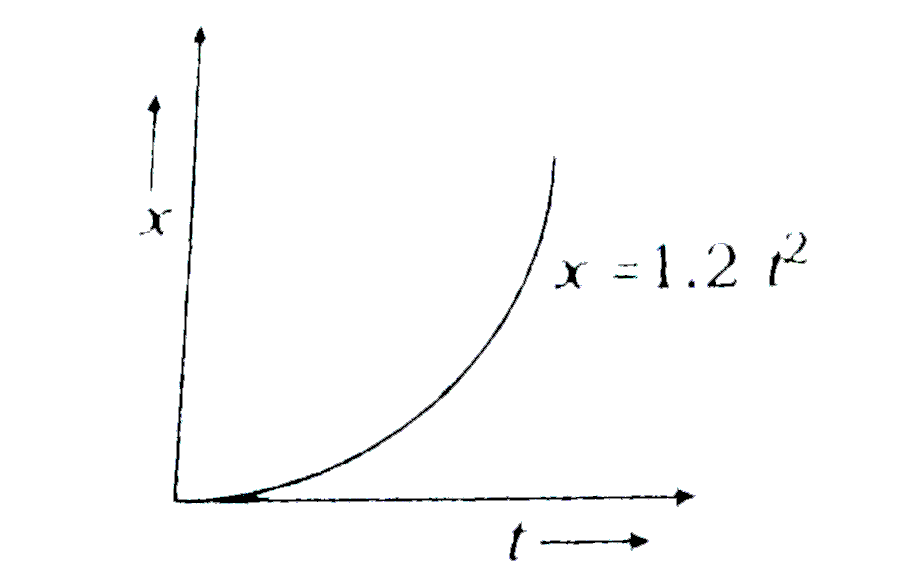 Aat restBin uniform motionCin non-uniform accelerationDuniformly accelerated
Given figure shows the distance-time graph of the motion of a car. It follows from the,| graph that the car is
 Aat restBin uniform motionCin non-uniform accclerationDunifommly accelerated.
Figure given shows the distance - time graph of the motion of a car. It follows from the graph that the car is

View SolutionThe speed- time graph of a car is given in (figure) The car weights 1000kg
(a) What is the distance travelled by the car in first two seconds?
(b) What is the braking force applied at the end of 5seconds to bring the car to a stop within one second?
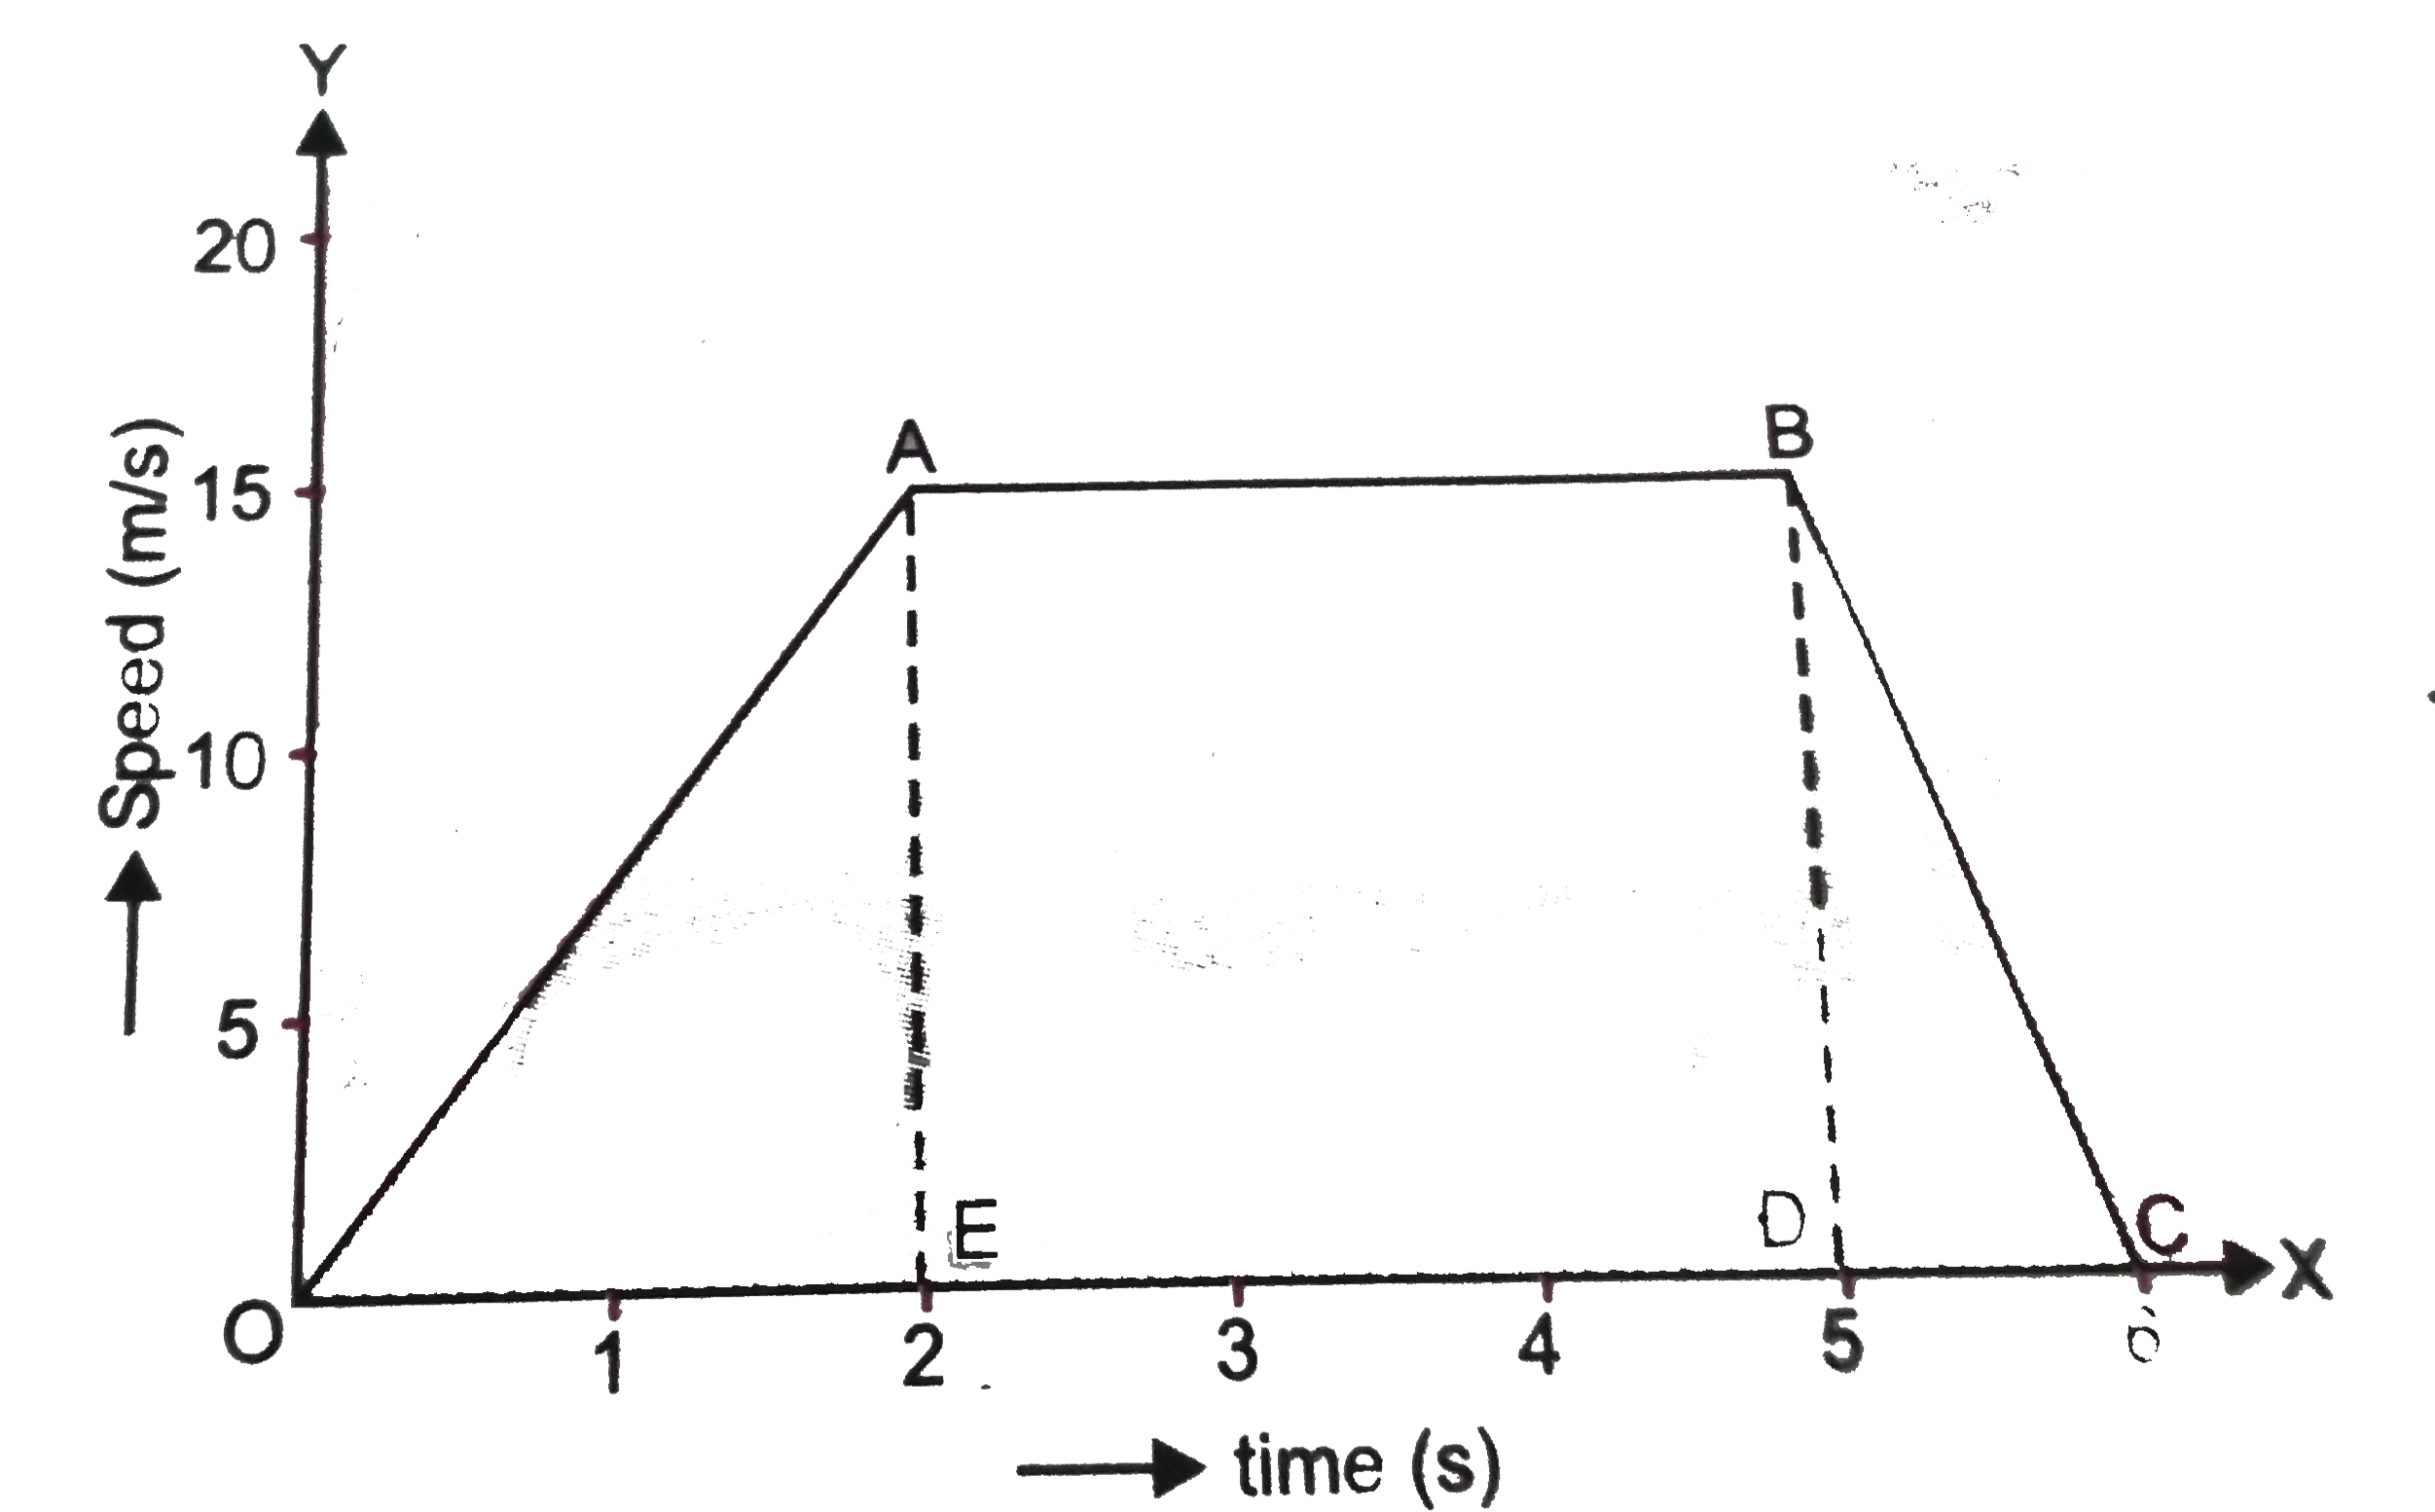
View SolutionThe speed- time graph of a car is given in (figure) The car weights 1000kg
(a) What is the distance travelled by the car in first two seconds?
(b) What is the braking force applied at the end of 5seconds to bring the car to a stop within one second?

View SolutionThe velocity- time graph of car moving on a straight track is given below. The car weight 1000kg.
 The distance travelled by the car during the whole motion is:
View SolutionA car travels at a speed of 75 m/s. for 2 hours. What is the distance (in km) travelled by the car?
View Solution
