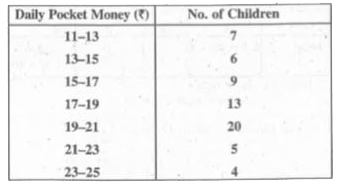
The following distrubution shows the daily pocket allowance or childern of a localuty , if the mean pocket allowance is ₹ 18, find the missing frequency ?

The correct Answer is:f=20
Step by step video & image solution for The following distrubution shows the daily pocket allowance or childern of a localuty , if the mean pocket allowance is ₹ 18, find the missing frequency ? by Maths experts to help you in doubts & scoring excellent marks in Class 10 exams.
Updated on:21/07/2023Topper's Solved these Questions
- MEAN,MEDAN,MODE OF GROUPED,DATA CUMULATIVE FREQUENCY GRAPH AND OGIVE BOOK - RS AGGARWALCHAPTER - MEAN,MEDAN,MODE OF GROUPED,DATA CUMULATIVE FREQUENCY GRAPH AND OGIVE EXERCISE - EXERCISE 18 B
14 Videos
- MEAN,MEDAN,MODE OF GROUPED,DATA CUMULATIVE FREQUENCY GRAPH AND OGIVE BOOK - RS AGGARWALCHAPTER - MEAN,MEDAN,MODE OF GROUPED,DATA CUMULATIVE FREQUENCY GRAPH AND OGIVE EXERCISE - EXERCISE 18 C
10 Videos
- MEAN,MEDAN,MODE OF GROUPED,DATA CUMULATIVE FREQUENCY GRAPH AND OGIVE BOOK - RS AGGARWALCHAPTER - MEAN,MEDAN,MODE OF GROUPED,DATA CUMULATIVE FREQUENCY GRAPH AND OGIVE EXERCISE - Exercise 18A
2 Videos
- LINEAR EQUATIONS IN TWO VARIABLES BOOK - RS AGGARWALCHAPTER - LINEAR EQUATIONS IN TWO VARIABLES EXERCISE - QUESTION
2 Videos
- PERIMETER AND AREA OF PLANE FIGURES BOOK - RS AGGARWALCHAPTER - PERIMETER AND AREA OF PLANE FIGURES EXERCISE - TEST YOURSELF (SHORT -ANSWER QUESTIONS)
1 Videos
Similar Questions
The following distribution shows the daily pocket allowance of children of a locality. The mean pocket allowance is Rs 18. Find the missing frequency f.
View SolutionMean pocket allowance is Rs18. Find the missing frequency k.
View SolutionCH. 14 STATISTICS Q1 Class 0-8 8-16 16-24 24-32 32-40 Frequency 10 12 26 9 15 e mean of above data by: () Direct method () Assumed mean method (ii) Step deviati iop metod. Q2 The following distribution shows the daily pocket allowance of children of a locali ty. The mean pocket allowance is Rs 20. Find the missing frequency Daily Pocket 0-20 20-40 40-60 0-80 80-100 No. Of Children 7 10 9 13 Q3. The following table shows age distribution of persons in a particular region. Find the: (0) mean age (i)modal age (ili) median age Age→ Below!0 Below20 Below30 Below 40, Below 50 Belo No, persons → 250 190 100 40 15 4 Arithmetic mean of the following frequency distribution is 50. Find the missing frequencies C.I. → 0-20 20-40 40-60 60-80 80-100 Tota
View SolutionThe following distribution shows the daily pocket allowance of children of a locality. The mean pocket allowance is Rs 18. Find the missing frequency f.
View SolutionThe following table represent pocket allowance of children of a colony. The mean pocket allowance is Rs 18. Find missing frequency.

View SolutionThe following distribution shows the daily pocket money of children of a school.
Find the average daily pocket money of children.

View SolutionThe following distribution shows the daily pocket allowance given to the children of a multistorey building. The average pocket allowance is Rs 18.00. Find out the missing frequency: Class 11-13 13-15 15-17 17-19 19-21 21-23 23-25 interval: Frequency: 7 6 9 13 - 5 4
View SolutionIf the mean of the following table is 30 , then find the missing frequencies .

View SolutionIf the mean of the following distribution is 54 , find the missing frequency x :

View SolutionIf the median of the following data is 32.5, find the missing frequencies.

View Solution
