The median and mode of a frequency distribution are 26 and 29 respectively. Then , the mean is
27.5
24.5
28.4
25.8
The correct Answer is:B
To find the mean of a frequency distribution when the median and mode are given, we can use the relationship between these three measures of central tendency. The formula that relates mode, median, and mean is:
Mode=3×Median−2×Mean
Given:
- Median = 26
- Mode = 29
We need to find the mean. Let's denote the mean as Mean.
Step 1: Substitute the values into the formula
Using the formula, we can rearrange it to find the mean:
29=3×26−2×Mean
Step 2: Calculate 3×26
Now, calculate 3×26:
3×26=78
Step 3: Substitute back into the equation
Now substitute this value back into the equation:
29=78−2×Mean
Step 4: Rearrange the equation to isolate 2×Mean
Rearranging gives us:
2×Mean=78−29
Step 5: Calculate 78−29
Now calculate 78−29:
78−29=49
Step 6: Solve for the mean
Now we have:
2×Mean=49
To find the mean, divide both sides by 2:
Mean=492
Step 7: Calculate 492
Calculating 492:
Mean=24.5
Conclusion
Thus, the mean of the frequency distribution is 24.5.
---
- Median = 26
- Mode = 29
Using the formula, we can rearrange it to find the mean:
Now, calculate 3×26:
Now substitute this value back into the equation:
Rearranging gives us:
Now calculate 78−29:
Now we have:
Calculating 492:
Thus, the mean of the frequency distribution is 24.5.
Topper's Solved these Questions
- BOOK - RS AGGARWALCHAPTER - MEAN,MEDAN,MODE OF GROUPED,DATA CUMULATIVE FREQUENCY GRAPH AND OGIVE EXERCISE - MUTIPLE-CHOICE QUESTIONS (MCQ)8videos
MEAN,MEDAN,MODE OF GROUPED,DATA CUMULATIVE FREQUENCY GRAPH AND OGIVE
- BOOK - RS AGGARWALCHAPTER - MEAN,MEDAN,MODE OF GROUPED,DATA CUMULATIVE FREQUENCY GRAPH AND OGIVE EXERCISE - Test Yourself18videos
MEAN,MEDAN,MODE OF GROUPED,DATA CUMULATIVE FREQUENCY GRAPH AND OGIVE
- BOOK - RS AGGARWALCHAPTER - MEAN,MEDAN,MODE OF GROUPED,DATA CUMULATIVE FREQUENCY GRAPH AND OGIVE EXERCISE - Exercise 18F9videos
MEAN,MEDAN,MODE OF GROUPED,DATA CUMULATIVE FREQUENCY GRAPH AND OGIVE
- BOOK - RS AGGARWALCHAPTER - LINEAR EQUATIONS IN TWO VARIABLES EXERCISE - QUESTION2videos
LINEAR EQUATIONS IN TWO VARIABLES
- BOOK - RS AGGARWALCHAPTER - PERIMETER AND AREA OF PLANE FIGURES EXERCISE - TEST YOURSELF (SHORT -ANSWER QUESTIONS)1videos
PERIMETER AND AREA OF PLANE FIGURES
Similar Questions
Knowledge Check
- Question 1 - Select One
In the following question, A statement of Assertion (A) is followed by a statement of Reason (R). Mark the correct choice as.
Assertion (A): If the median and mode of a frequency distribution are 150 and 154 respectively. Then its mean is 148.
Reason (R): Mean, median and mode of a frequency distribution are related as 3Mean=3Median - Mode.ABoth A and R are true and R is the correct explanation for A.BBoth A and R are true and R is not correct explanation for A.CA is true but R is false.DA is false but R is true. - Question 2 - Select One
The mean and mode of a frequency distribution are 28 and 16 respectively .The median is
A22B23.5C24D24.5 - Question 3 - Select One
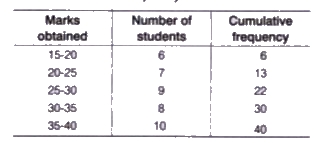
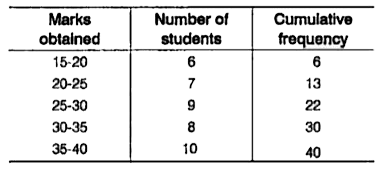
The median of the frequency distribution is
 A28.88B30.88C35.88DNone of these
In an asymmetrical distribution, if the mean and median of the distribution are 270 and 220 respectively, then the mode of the data is
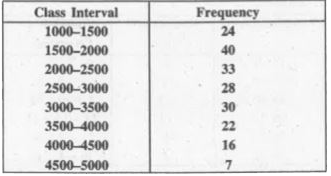
View SolutionFind the mode of following frequency distribution :
 View Solution
The median of the frequency distribution is
 View Solution
Mean and median of a simple distribution are 38 and 39 respectively. Then, mode will be
View SolutionThe mean and median of a moderately skewed distribution are 5 and 6 respectively. Then the value of mode in such a situation is approximately equal to
View Solution

