In the above diagram A & B represent respectively
 Solution in Telugu
Mesophyll cells in upper epidemics & lower epidermis
Mesophyll cells in temperature & tropical plant leaves
Chloroplast alignment at high & low light in tensity
Variation in Chloroplast number in different seasons
The correct Answer is:C
Step by step video, text & image solution for In the above diagram A & B represent respectively by Biology experts to help you in doubts & scoring excellent marks in Class 12 exams.
Topper's Solved these Questions
- BOOK - AAKASH SERIESCHAPTER - PHOTOSYNTHESIS IN HIGHER PLANTS EXERCISE - Exercise - III27videos
PHOTOSYNTHESIS IN HIGHER PLANTS
- BOOK - AAKASH SERIESCHAPTER - PHOTOSYNTHESIS IN HIGHER PLANTS EXERCISE - Exercise - III27videos
PHOTOSYNTHESIS IN HIGHER PLANTS
- BOOK - AAKASH SERIESCHAPTER - ORGANISMS AND POPULATIONSEXERCISE - EXERCISE-III (PREVIOUS AIPMT/NEET QUESTIONS)35videos
ORGANISMS AND POPULATIONS
- BOOK - AAKASH SERIESCHAPTER - PLANT GROWTH AND DEVELOPMENT EXERCISE - EXERCISE -III (PREVIOUS AIPMT/NEET QUESTIONS)27videos
PLANT GROWTH AND DEVELOPMENT
Similar Questions
Phosphoenol pyruvate (PEP) is the primary CO2 acceptor in :
00:46View SolutionPhosphoenol pyruvate (PEP) is the primary CO2 acceptor in :
04:34View SolutionAsymptote in a logistic growth curve is obtained when
04:25View SolutionRoot hairs develop from the rgion of :
01:49View Solution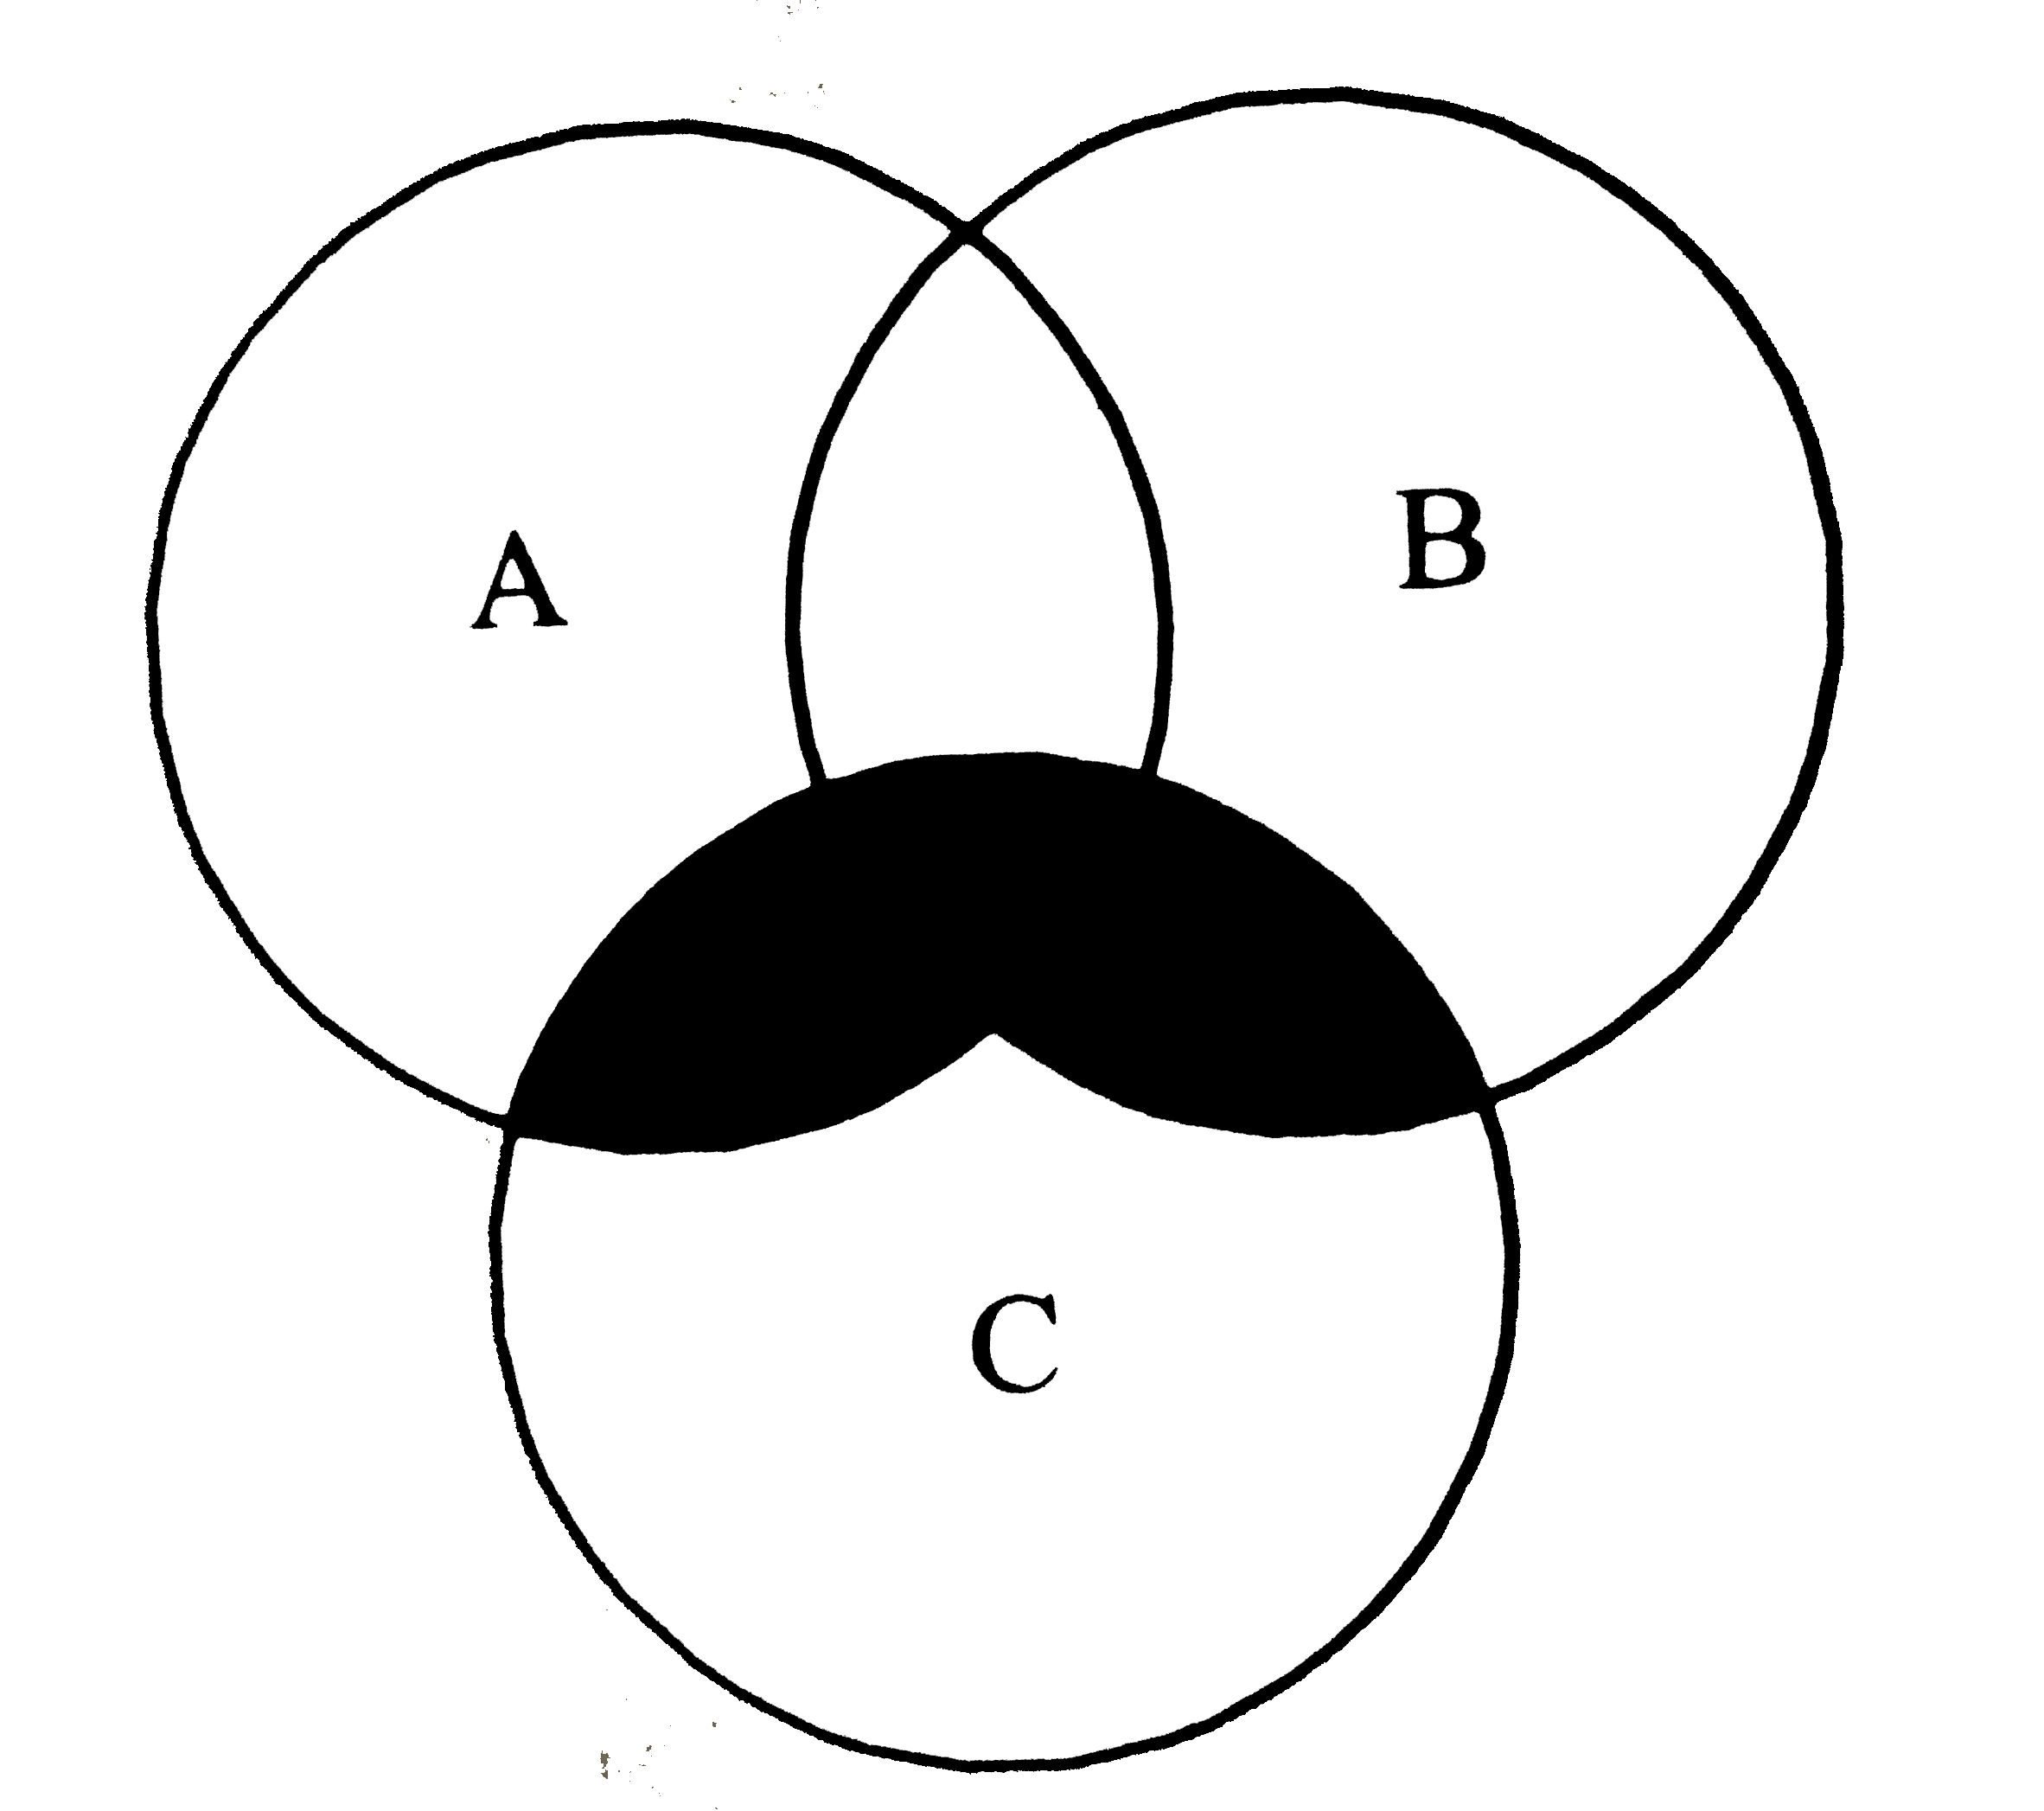
What does the shaded region in the above diagram represent?02:01View SolutionIn the diagram of types of placentation givne above A,B,C and D respectively
View SolutionA'∩Bतथा (A∩B)' को वेग आरेख द्वारा प्रदर्शित कीजिए
01:31View SolutionIn given diagram A, B, C and D respectively represents :-
05:02View SolutionBased on the below diagram, answer the following question.
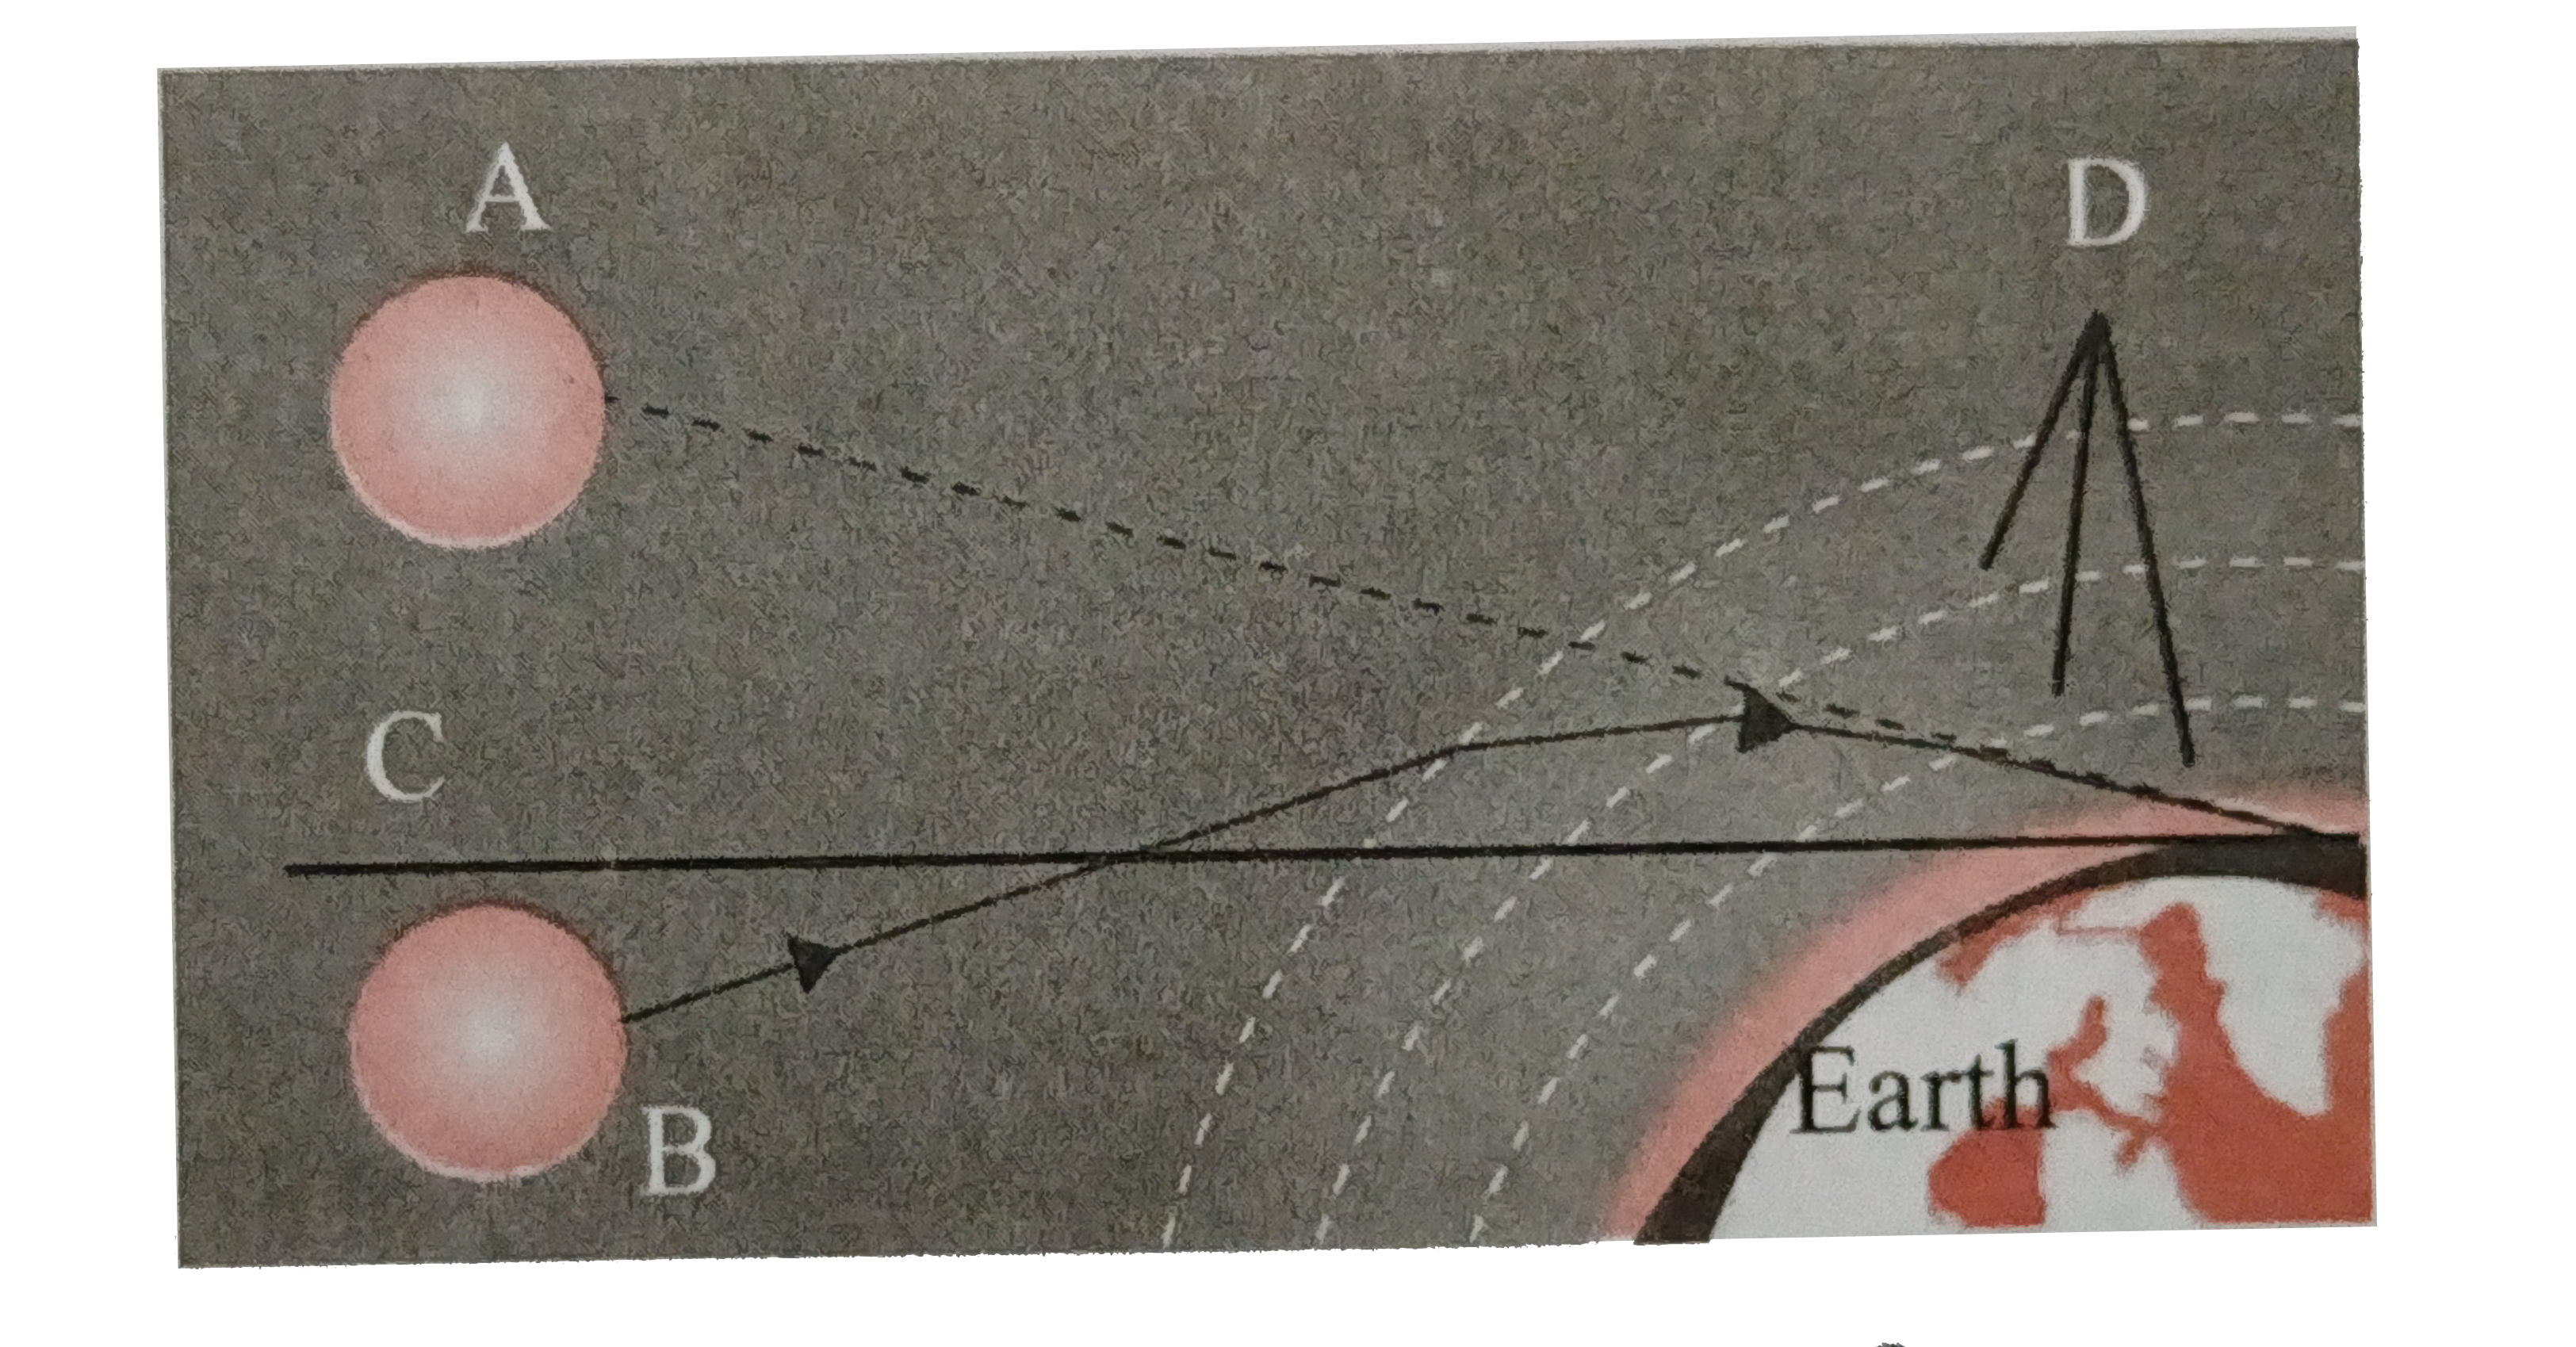
What does the above diagram represent?02:42View SolutionIn above diagram 'A' represents :
02:42View SolutionThe sources of the square equation representing the graph in the diagram above.
06:28View Solutionआरेख A तथा आरेख B है क्रमशः
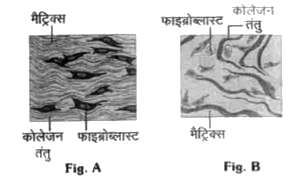 02:59View Solution
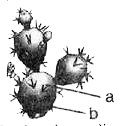
In the above diagram a & b respectively02:12View Solution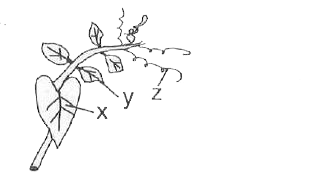
In the above diagram 'x' represents the02:02View Solutionदिया गया आरेख सेमिनीफेरस ट्युब्यूल्स के एक भाग को दर्शाता है। क्रमशः A, B, C, D, E तथा F को पहचानिए
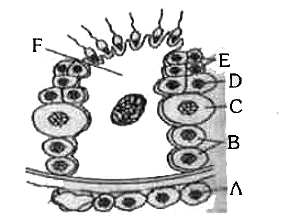 01:49View Solution
Based on the below diagram, answer the following question. What does the above diagram represent?
03:44View Solution

