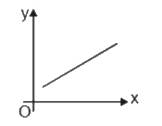
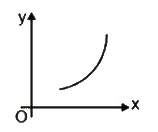
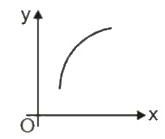
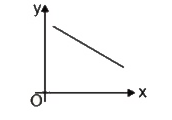
In Ellingham diagrams of ΔG oxide formation Vs T, which of the following graphs has negative slope ?
A
C→CO
B
Fe→Fe2O3
C
Mg→MgO
D
All of these
Video Solution
|
Answer
Step by step video & image solution for In Ellingham diagrams of DeltaG oxide formation Vs T, which of the following graphs has negative slope ? by Chemistry experts to help you in doubts & scoring excellent marks in Class 12 exams.
Updated on:21/07/2023Topper's Solved these Questions
- GENERAL PRINCIPLES AND PROCESSES OF ISOLATION OF ELEMENTSBOOK - AAKASH INSTITUTECHAPTER - GENERAL PRINCIPLES AND PROCESSES OF ISOLATION OF ELEMENTSEXERCISE - Objective type Questions (More than one option are correct)
10 Videos
- GENERAL PRINCIPLES AND PROCESSES OF ISOLATION OF ELEMENTSBOOK - AAKASH INSTITUTECHAPTER - GENERAL PRINCIPLES AND PROCESSES OF ISOLATION OF ELEMENTSEXERCISE - Linked Comprehension Type Questions
7 Videos
- GENERAL PRINCIPLES AND PROCESSES OF ISOLATION OF ELEMENTSBOOK - AAKASH INSTITUTECHAPTER - GENERAL PRINCIPLES AND PROCESSES OF ISOLATION OF ELEMENTSEXERCISE - Try Yourself
33 Videos
- GENERAL PRINCIPLES AND PROCESSES OF ISOLATION OF ELEMENTSBOOK - AAKASH INSTITUTECHAPTER - GENERAL PRINCIPLES AND PROCESSES OF ISOLATION OF ELEMENTSEXERCISE - Assignment (Section-D) Assertion-Reason Type Question
15 Videos
- HALOALKANES AND HALOARENES BOOK - AAKASH INSTITUTECHAPTER - HALOALKANES AND HALOARENES EXERCISE - ASSIGNMENT SECTION -D
15 Videos
Similar Questions
Knowledge Check
In Elingham diagrams of ΔG de formation Vs T, which of the following graphs has negative slope?
AC→COBFe→Fe2O3CM>oMgODAll of theseWhich of the following graphs has a positive , decreasing slope ?
A B
B C
C D
D
Ellingham diagram can be drawn for the following:
ASulphidesBOxidesCHalidesDAll of these
In Ellingham diagrams plots of ΔG (oxide formation) show positive slopes except for the formation of CO(g) from coke. Why?
View SolutionEllingham diagrams are plots of ΔG∘1 Vs T for the formation of
View SolutionFrom the Ellingham graphs of carbon, which of the following statements is false?
View SolutionFrom the Ellingham graphs of carbon, which of the following statements is false?
View SolutionFrom the Ellingham graphs of carbon, which of the following statements is false?
View Solution
