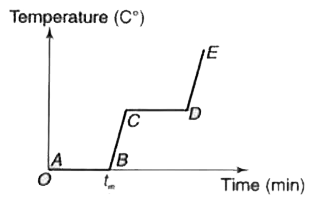
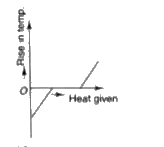
100 g of ice at was heated. The rise in temperature of ice was plotted against the heat given to ice. Which of the following graphs (Fig. 6.2) correctly depicts this behaviour?
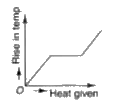
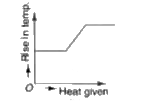
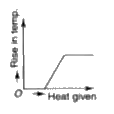
The correct Answer is:D
To solve the question regarding the heating of 100 g of ice at -15°C and the corresponding graph of rise in temperature against heat given, we can follow these steps:
1. Identify Initial Conditions:
- The initial temperature of the ice is -15°C.
2. Heating the Ice:
- When heat is applied to the ice, the first change will be the increase in temperature from -15°C to 0°C. This process involves heating the ice without changing its state.
3. Phase Change at 0°C:
- Once the temperature reaches 0°C, the ice begins to melt. During this phase change, the temperature remains constant at 0°C until all the ice has melted into water. This means that even though heat is being added, the temperature does not increase during this time.
4. Heating the Water:
- After all the ice has melted, the temperature of the water (which is now at 0°C) will start to rise as more heat is added. The temperature will continue to increase until it reaches the boiling point of water (100°C).
5. Graph Representation:
- The graph will show an initial linear increase in temperature as heat is added from -15°C to 0°C. At 0°C, the graph will flatten out (indicating a phase change) as the ice melts. After the phase change, the graph will again show a linear increase in temperature as the water is heated.
6. Select the Correct Graph:
- Based on the described behavior, the correct graph will depict a rise in temperature from -15°C to 0°C, followed by a flat line at 0°C during melting, and then a rise in temperature as the water is heated.
Conclusion:
The correct graph that depicts this behavior is Option 4.
- The initial temperature of the ice is -15°C.
- When heat is applied to the ice, the first change will be the increase in temperature from -15°C to 0°C. This process involves heating the ice without changing its state.
- Once the temperature reaches 0°C, the ice begins to melt. During this phase change, the temperature remains constant at 0°C until all the ice has melted into water. This means that even though heat is being added, the temperature does not increase during this time.
- After all the ice has melted, the temperature of the water (which is now at 0°C) will start to rise as more heat is added. The temperature will continue to increase until it reaches the boiling point of water (100°C).
- The graph will show an initial linear increase in temperature as heat is added from -15°C to 0°C. At 0°C, the graph will flatten out (indicating a phase change) as the ice melts. After the phase change, the graph will again show a linear increase in temperature as the water is heated.
- Based on the described behavior, the correct graph will depict a rise in temperature from -15°C to 0°C, followed by a flat line at 0°C during melting, and then a rise in temperature as the water is heated.
The correct graph that depicts this behavior is Option 4.
Topper's Solved these Questions
- HEATBOOK - MCGROW HILL PUBLICATIONCHAPTER - HEATEXERCISE - HIGHER ORDER THINKING QUESTIONS
15 Videos
- GRAVITATION BOOK - MCGROW HILL PUBLICATIONCHAPTER - GRAVITATION EXERCISE - HIGHER ORDER THINKING QUESTIONS
25 Videos
- HEATING AND MAGNETIC EFFECTS OF CURRENT BOOK - MCGROW HILL PUBLICATIONCHAPTER - HEATING AND MAGNETIC EFFECTS OF CURRENT EXERCISE - HIGHER ORDER THINKING QUESTIONS
34 Videos
Similar Questions
Knowledge Check
100 g of ice at −15∘––C was heated ,the rise in termperature of ice was plotted against the heat given to ice .Which of the following graphs correctly depicts this behaviour ?
A B
B C
C D
D
Heat given (H) to a substance was plotted against rise in temperature (θ). Which of the following parts of the graph (Fig. 6.3), most correctly depicts the latent heat of the substance?
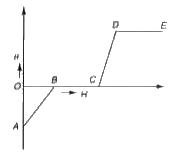 AABBBC onlyCCDDBC and DE
Refer to the plot of temperature versus time showing the changes in the state of ice on heating (not to scale).
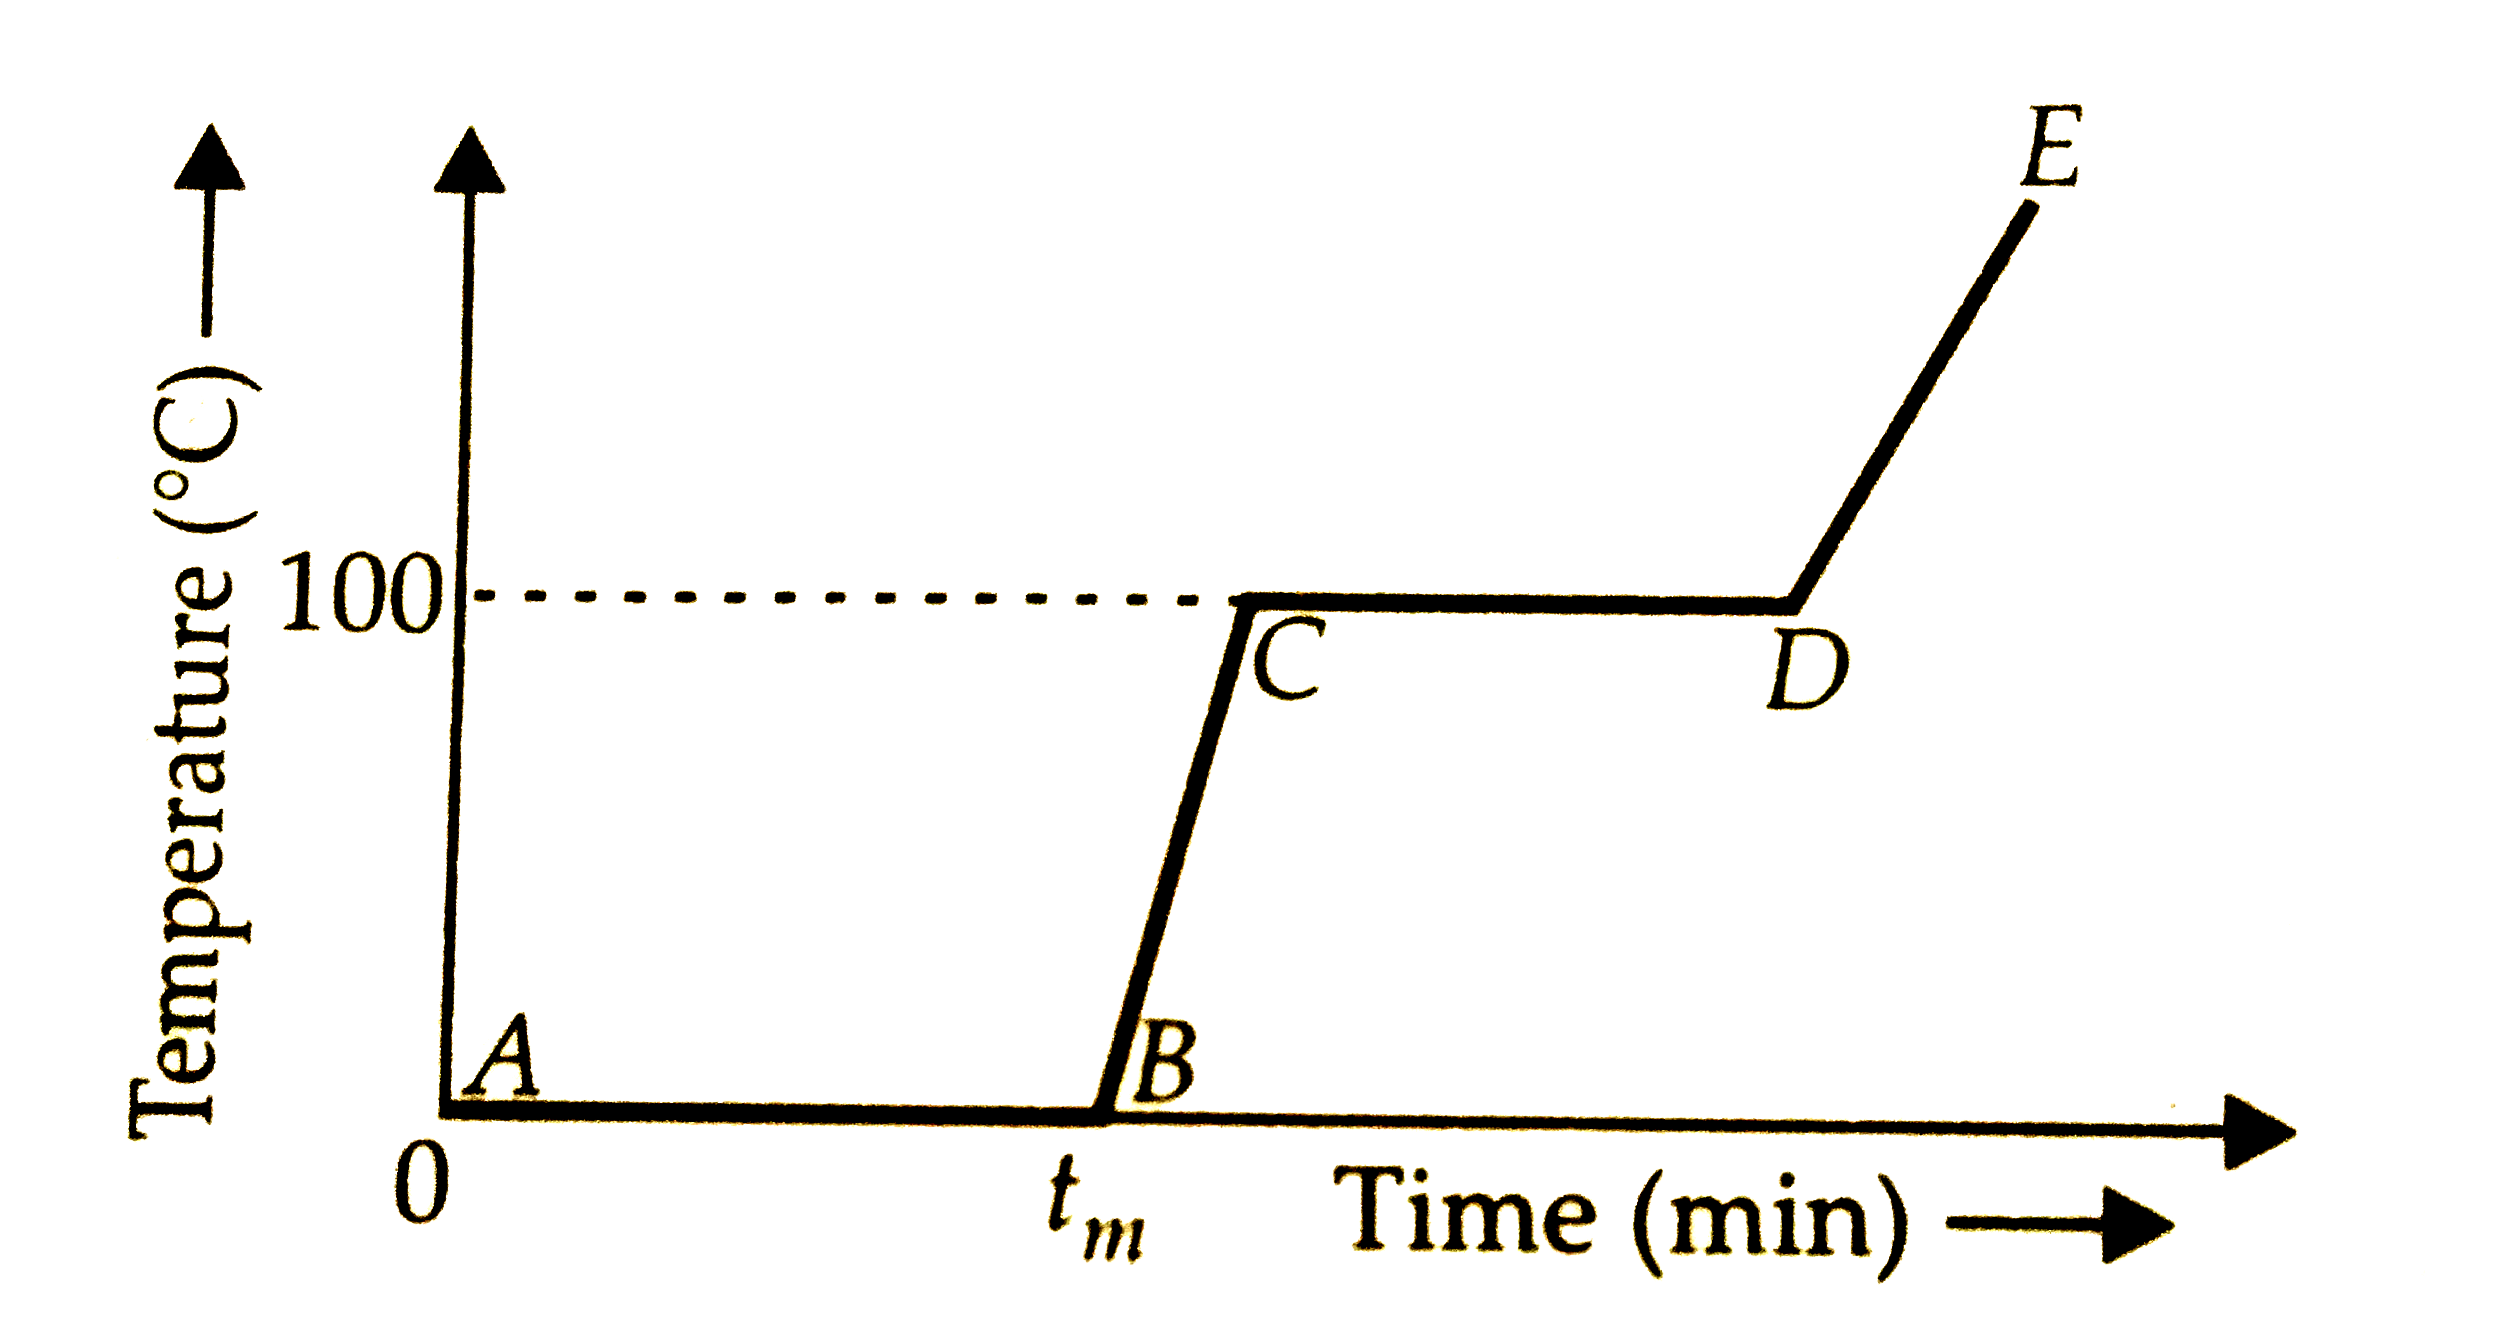
Which of the following is correct ?AAB represents ice and water are not in the thermal equilibriumBAt B water starts boiling.CAt C all the water gets converted into steam.DCD represents water and steam in equilibrium at boiling point.
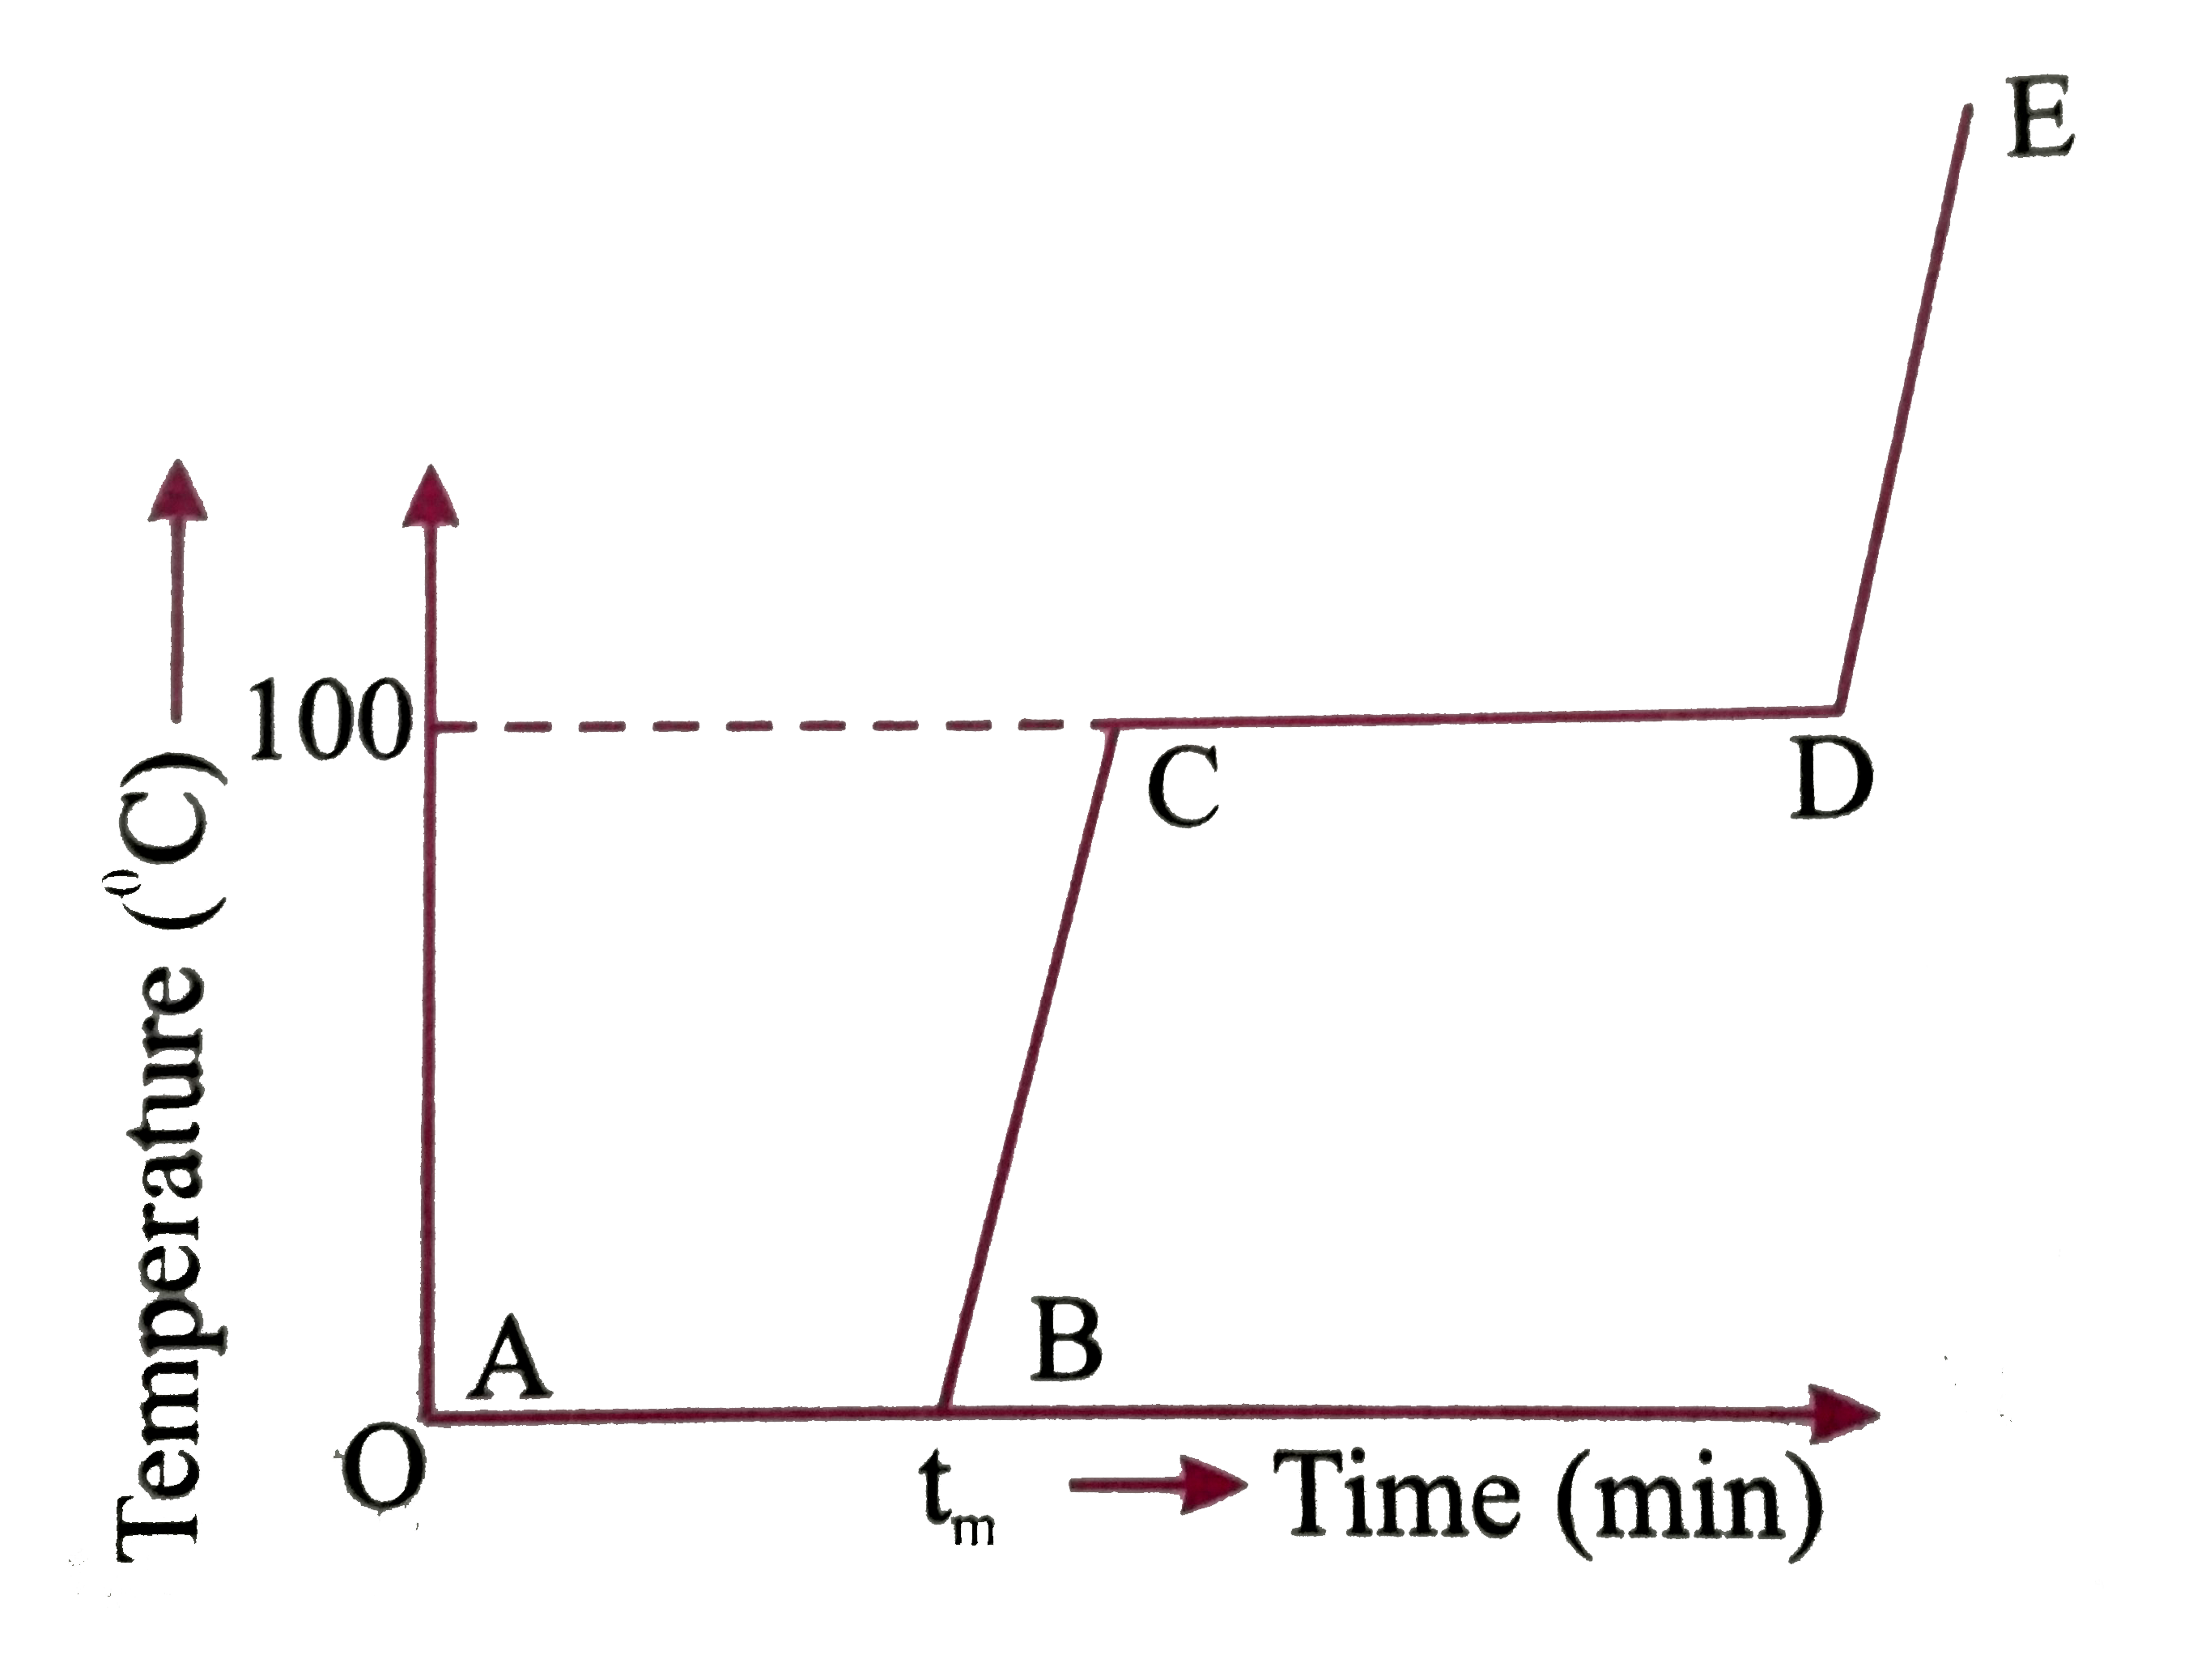
Refer to the plot of temperature versus time (figure) showing the changes in the state if ice on heating (not to scale). Which of the following is correct ?
 .
.
View SolutionA block of ice at temperature −20∘C is slowly heated and converted to steam at 100∘C. Which of the following diagram is most appropriate?
View Solutiona block of ice at temperature −20∘C is slowly heated and converted to steam at 100∘C which of the following diagram is most appropriate
View Solutiona block of ice at temperature −20∘C is slowly heated and converted to steam at 100∘C which of the following diagram is most appropriate
View SolutionA block of ice at −12∘C is slowly heated and converted into steam at 100∘C. Which of the following curves best represents the event ?
View Solution

