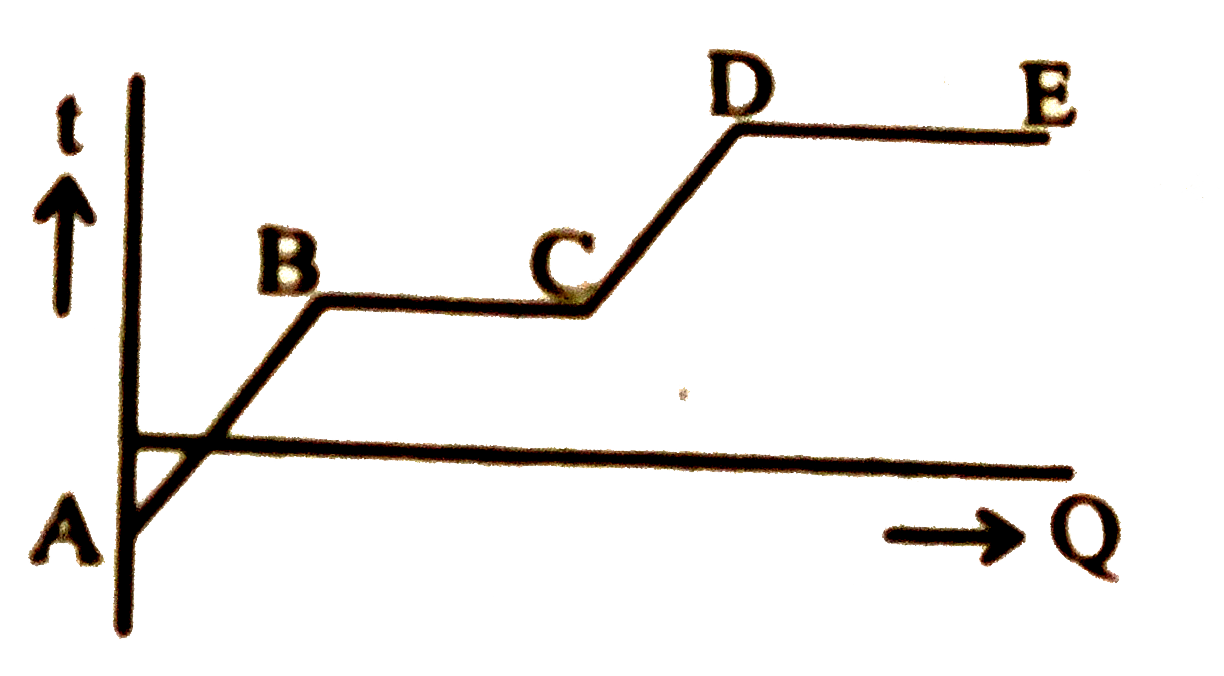
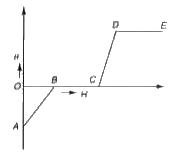
Heat given (H) to a substance was plotted against rise in temperature (θ). Which of the following parts of the graph (Fig. 6.3), most correctly depicts the latent heat of the substance?
A
AB
B
BC only
C
CD
D
BC and DE
Text Solution
The correct Answer is:D
BC and DE correspond to change of state of the substance without any change of temperature i.e., depict the latent heat of the substance.
|
Topper's Solved these Questions
- HEATBOOK - MCGROW HILL PUBLICATIONCHAPTER - HEATEXERCISE - HIGHER ORDER THINKING QUESTIONS
15 Videos
- GRAVITATION BOOK - MCGROW HILL PUBLICATIONCHAPTER - GRAVITATION EXERCISE - HIGHER ORDER THINKING QUESTIONS
25 Videos
- HEATING AND MAGNETIC EFFECTS OF CURRENT BOOK - MCGROW HILL PUBLICATIONCHAPTER - HEATING AND MAGNETIC EFFECTS OF CURRENT EXERCISE - HIGHER ORDER THINKING QUESTIONS
34 Videos
Similar Questions
Knowledge Check
100 g of ice at −15∘C was heated. The rise in temperature of ice was plotted against the heat given to ice. Which of the following graphs (Fig. 6.2) correctly depicts this behaviour?
A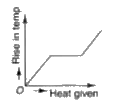 B
B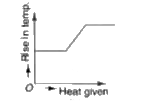 C
C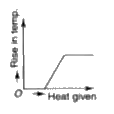 D
D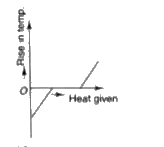
100 g of ice at −15∘––C was heated ,the rise in termperature of ice was plotted against the heat given to ice .Which of the following graphs correctly depicts this behaviour ?
A B
B C
C D
D
Which substance is produced by heating sucrose at 486 K temperature ?
ASucraloseBElitemCCaramelDArneto
Heat is added to a substance, but its temperature does not rise. Which one of the following statements provides the best explanation for this observation ?
View SolutionWhich of the following substances is bad conductor of heat and electricity?
View SolutionA substance which radiates light when heated to a high temperature is said to be
View SolutionA substance which radiates light when heated to a light temperature is said to be
View SolutionWhich of the following substances undergoes chemical change an heating?
View Solution

