A body is thrown vertically upwards. Which one of the following graphs correctly represent the velocity vs time?
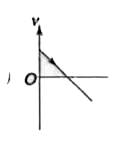
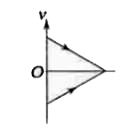
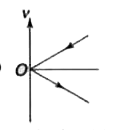
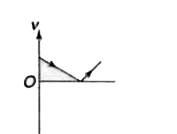
The correct Answer is:A
Step by step video, text & image solution for A body is thrown vertically upwards. Which one of the following graphs correctly represent the velocity vs time? by Physics experts to help you in doubts & scoring excellent marks in Class 10 exams.
Topper's Solved these Questions
- BOOK - MCGROW HILL PUBLICATIONCHAPTER - MISCELLANEOUS QUESTIONSEXERCISE - PART-B99videos
MISCELLANEOUS QUESTIONS
- BOOK - MCGROW HILL PUBLICATIONCHAPTER - MEASUREMENTEXERCISE - ELEMENTARY QUESTIONS (HIGHER ORDER THINKING QUESTIONS)13videos
MEASUREMENT
- BOOK - MCGROW HILL PUBLICATIONCHAPTER - MOTIONEXERCISE - HIGHER ORDER THINKING QUESTIONS48videos
MOTION
Similar Questions
A ball thrown vertically upward with initial velocity u. Which of the following graphs represent the velocity of ball correctly as function of time?
(Take upward direction as positive)View SolutionA ball is thrown vertically upwards. Which of the following plots represents the speed-time graph of the ball during its height if the air resistance is not ingnored ?
View Solution
Knowledge Check
- Question 1 - Select One
Which of the following graph is correctly represented?
A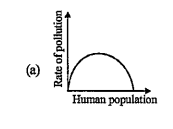 B
B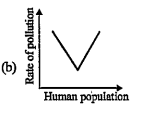 C
C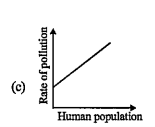 D
D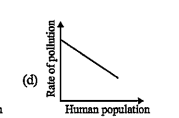
- Question 2 - Select One
A body nis thrown vertically upward. Which of the following graphs correctly/represents the velocity of the body with time?
A B
B C
C D
D
- Question 3 - Select One
A ball is thrown vertically upwards. Which of the following graph/graphs represent velocity time graph of the ball during its flight ( air resistance is neglected).
A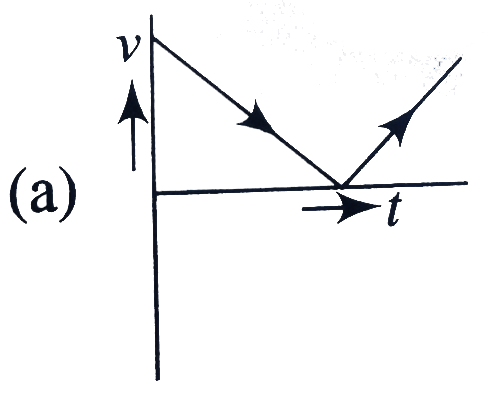 B
B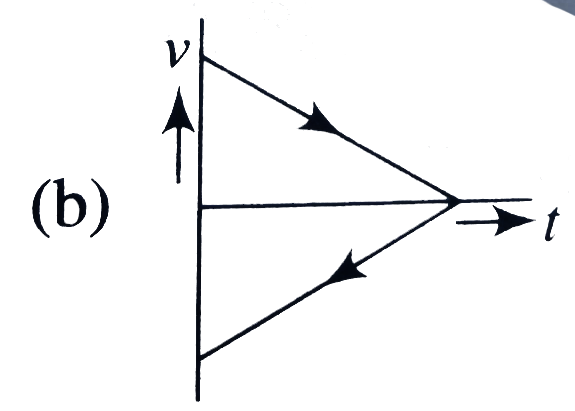 C
C D
D
A ball is thrown vertically upwards. Which of the following plots represent the speed graph of the ball during its flight if the air resistence is not ignored?
View Solutionwhich of the following graphs represents Charles' law correctly ?
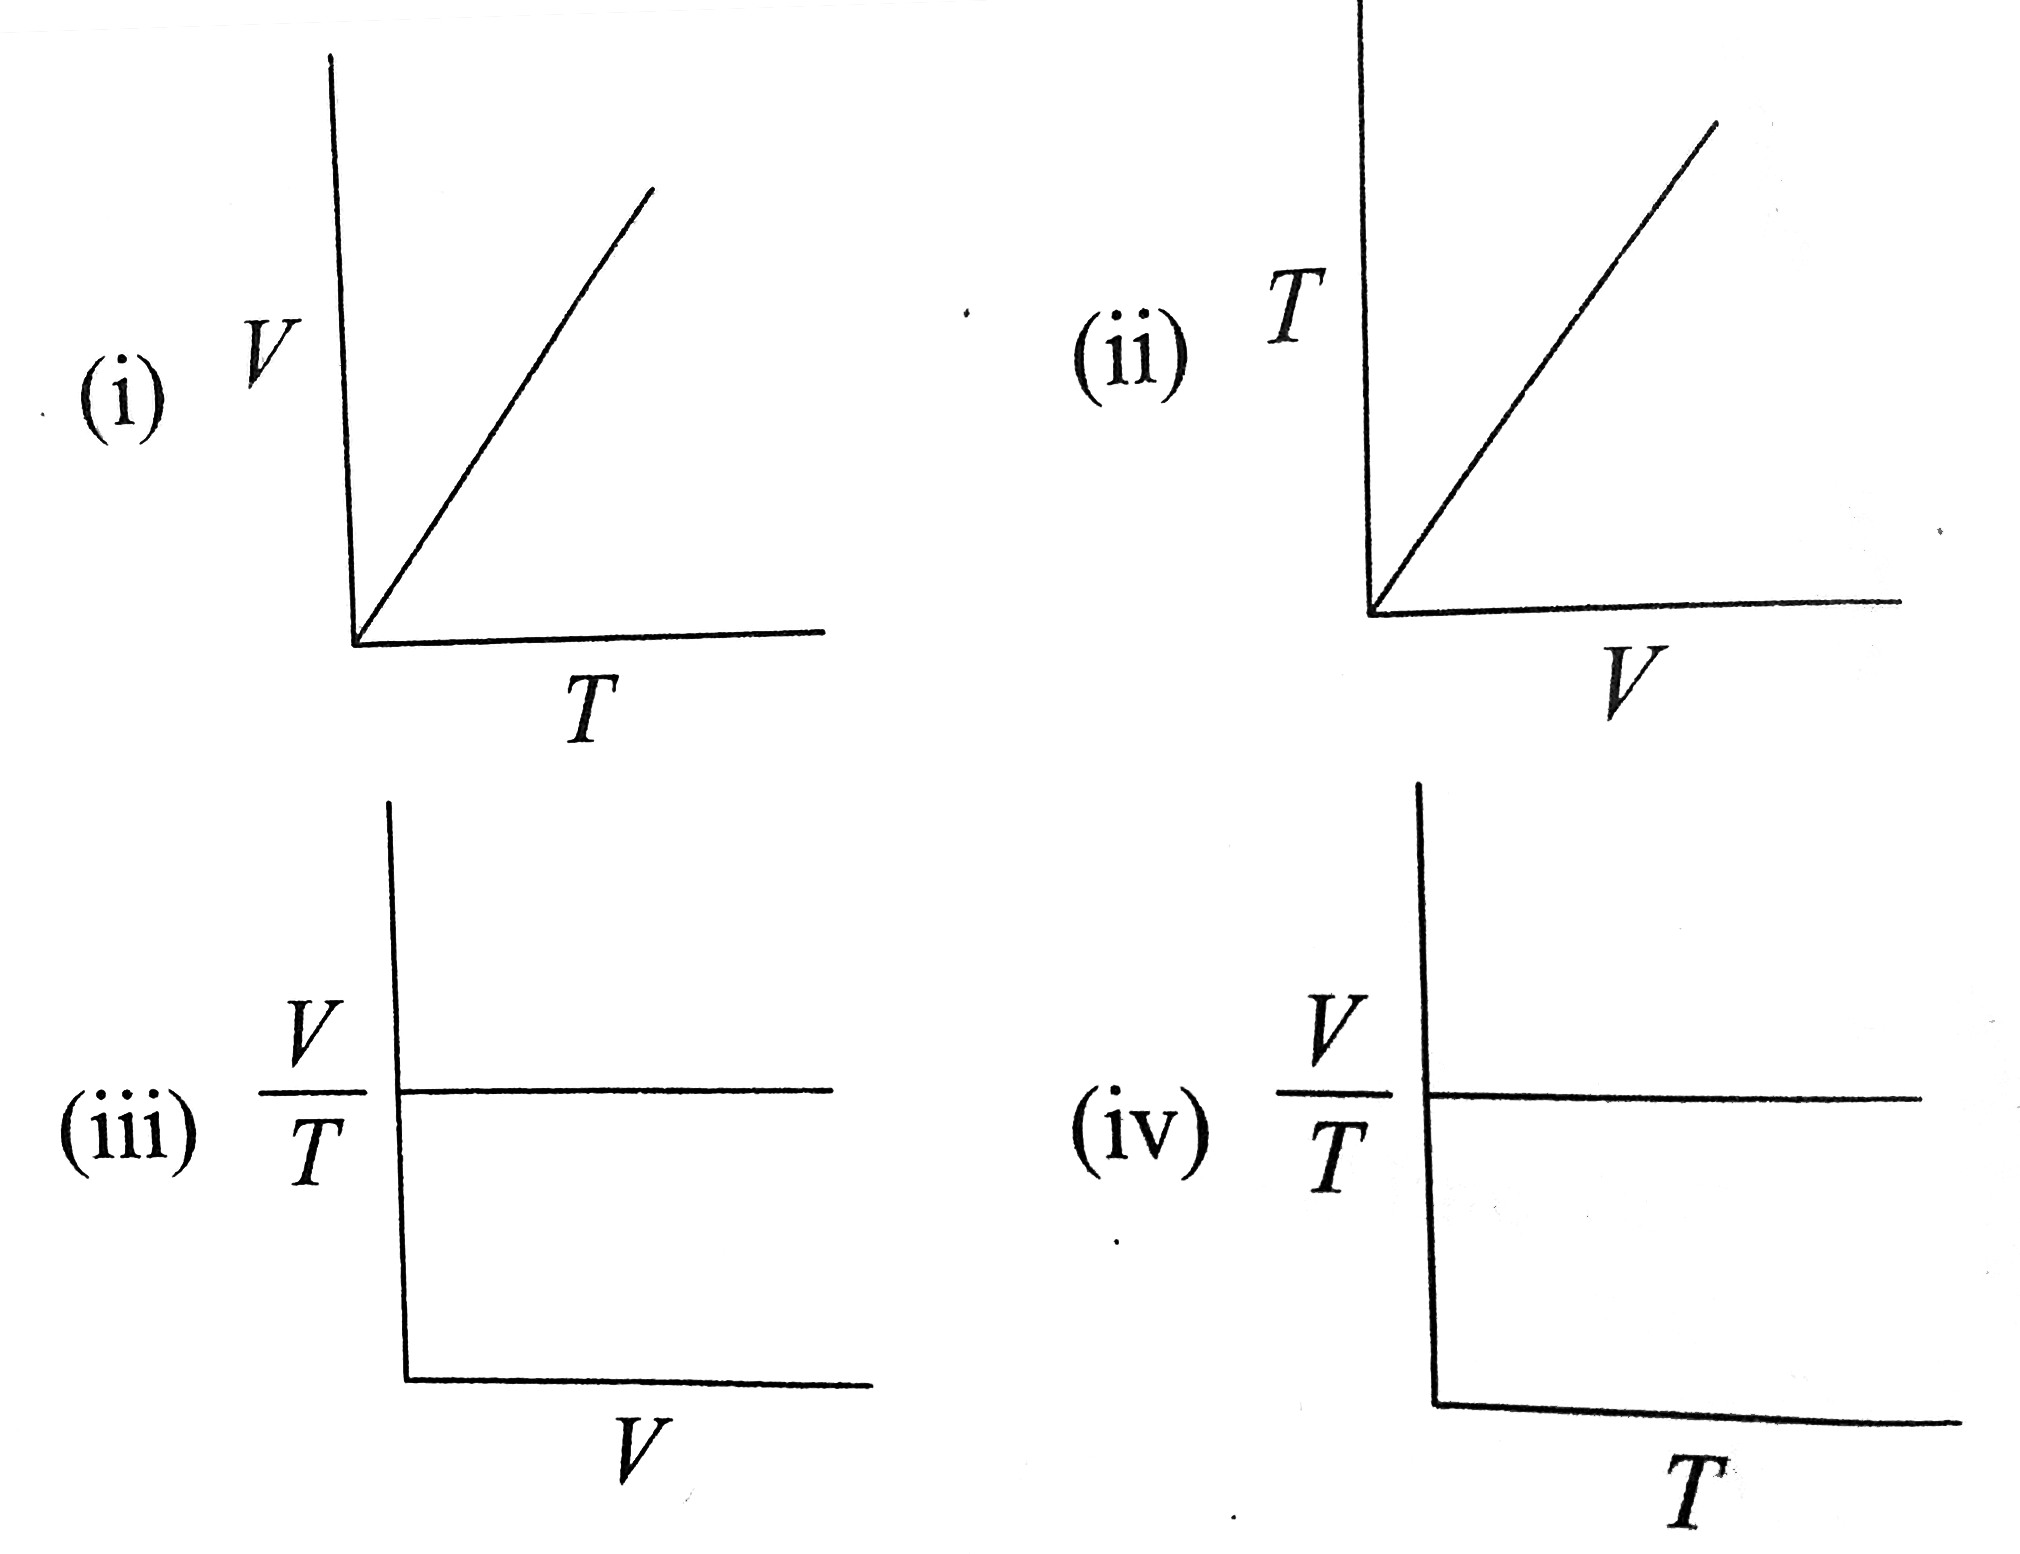 View Solution
The velocity -displacement graph of a particle is as shown in the figure. Which of the following graphs correctly represents the variation of acceleration with displacement?
 View Solution
The following graph represents the titration of pH vs volume
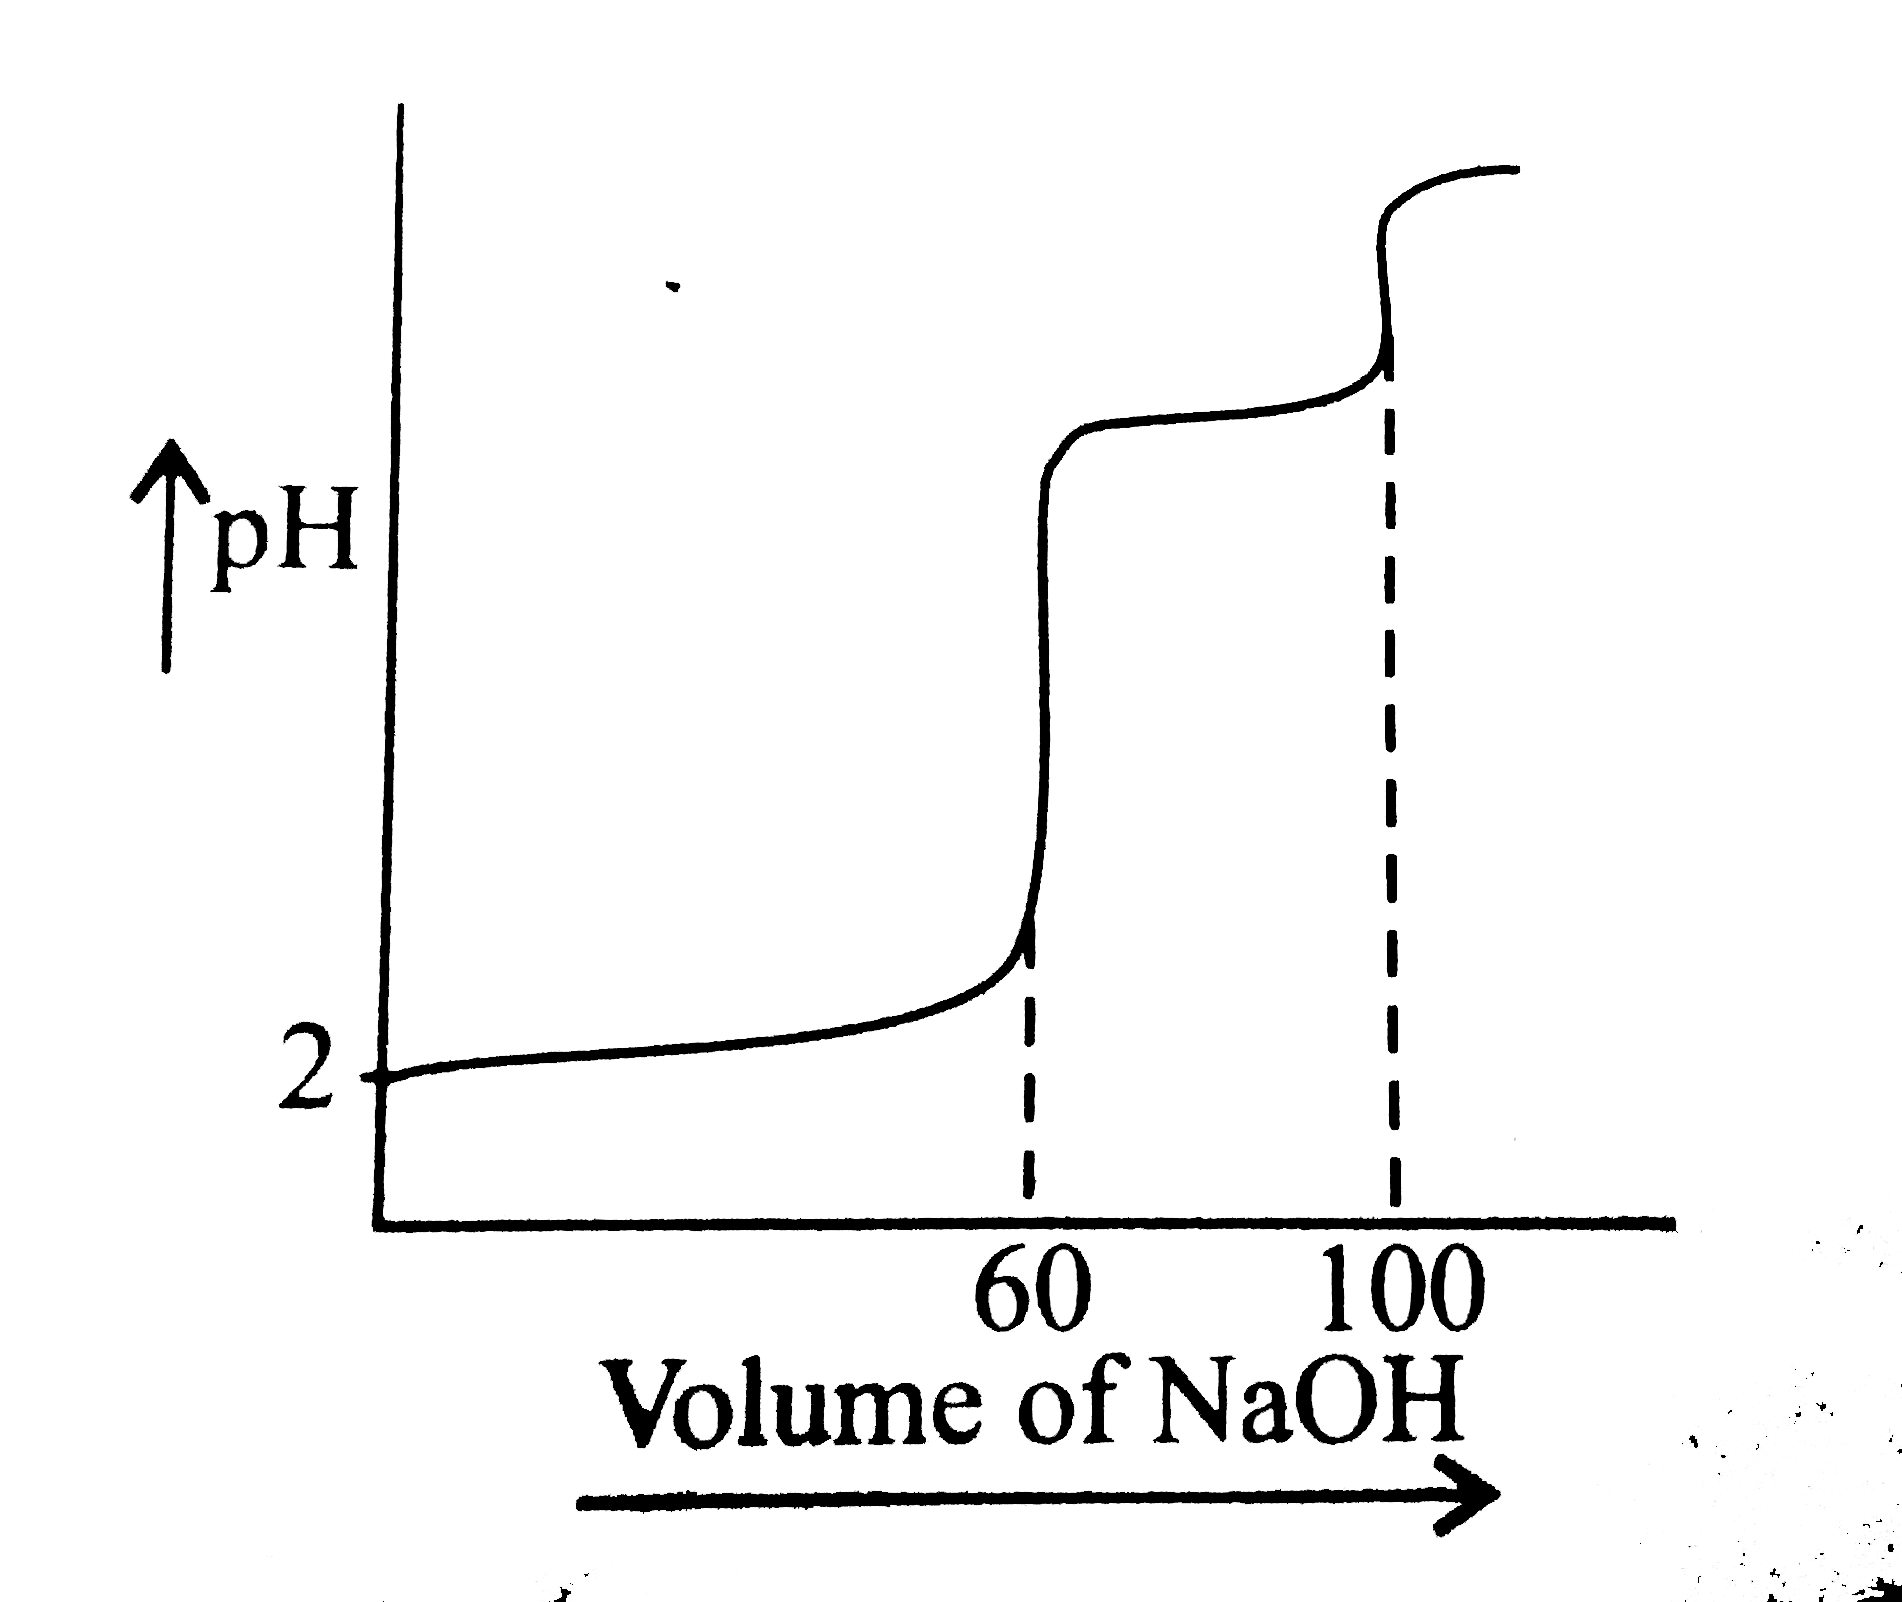 View Solution
A particle is thrown vertically upwards with a velocity v. It returns to the ground in time T. which of the following graphs correctly represents the motion ?
View Solution

