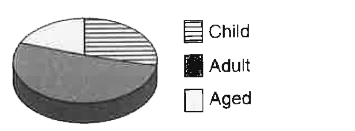
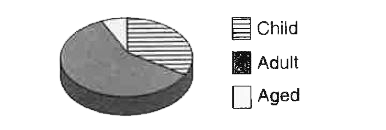
Which pie diagram represents India's age com position in 2001?
A

B

C

D

Text Solution
The correct Answer is:D
|
Topper's Solved these Questions
- POPULATION BOOK - MCGROW HILL PUBLICATIONCHAPTER - POPULATION EXERCISE - HIGHER ORDER THINKING QUESTIONS
19 Videos
- NATURAL VEGETATION AND WILDLIFE RESOURCES BOOK - MCGROW HILL PUBLICATIONCHAPTER - NATURAL VEGETATION AND WILDLIFE RESOURCES EXERCISE - HIGHER ORDER THINKING QUESTIONS
20 Videos
- RESOURCES FOR HUMAN NEEDS BOOK - MCGROW HILL PUBLICATIONCHAPTER - RESOURCES FOR HUMAN NEEDS EXERCISE - HIGHER ORDER THINKING QUESTIONS
20 Videos
Similar Questions
Knowledge Check
The given pie diagram represents the proportionate number of species of major taxa of vertebrates. Identify the group A and B.
 AA = Reptiles, B = BirdsBA - Fish, B-BirdsCA-Birds, B - FishDA-Birds, B-Reptiles
The given pie diagram represents the proportionate number of species of major taxa of vertebrates. Identify the group A and B.
 AA = Reptiles, B = BirdsBA - Fish, B-BirdsCA-Birds, B - FishDA-Birds, B-Reptiles
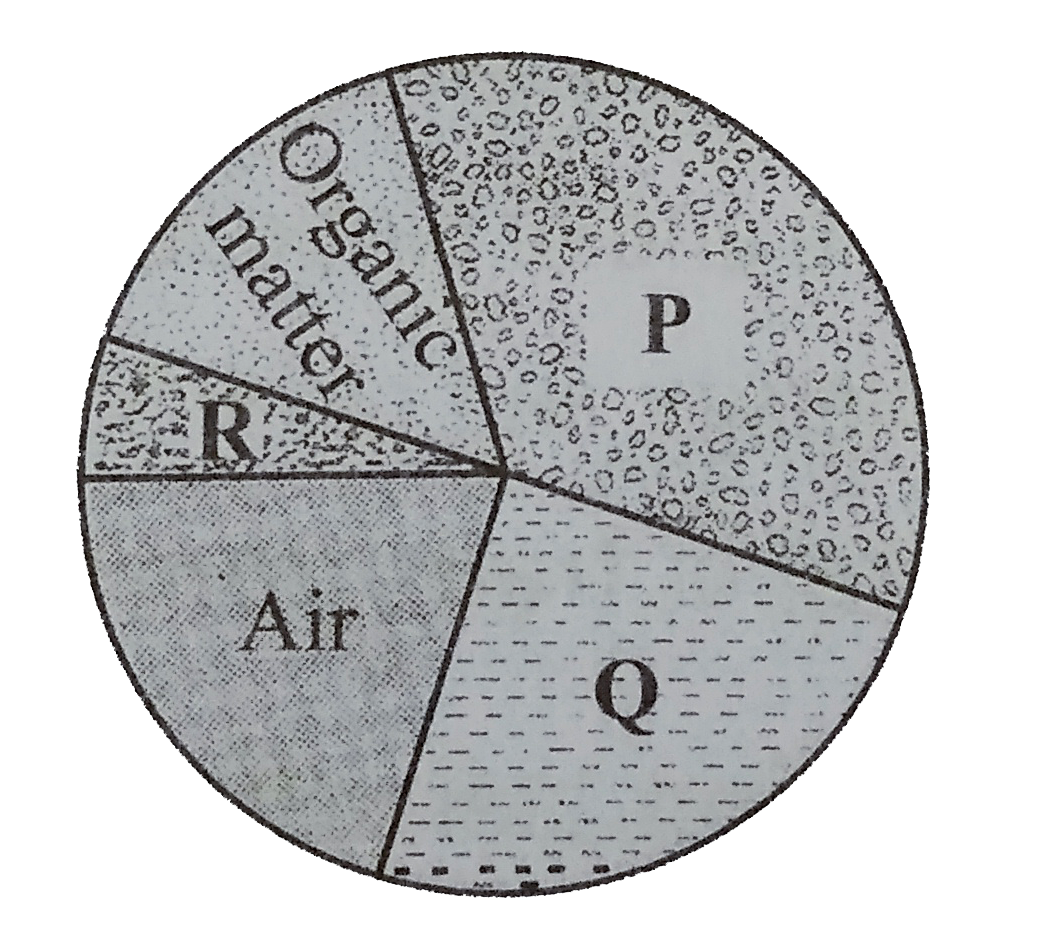
The given pie diagram represents different components of the soil. Identify P,Q and R and select the correct option
 APQRWaterBiotaMineral saltsBPQRMineral saltsBiotaWaterCPQRMineral saltsWaterBiotaDPQRBiotaWaterMineral water
What is pie diagram useful for?
View Solution
View SolutionGiven pie diagram represents the proportionate number of species of major groups of invertebrates. Identify the groups A and B.

View SolutionIdentify the groups of organism marked A and B in the given pie diagram representing the proportionate number of species of major taxa of plants.

View SolutionA pie-diagram representing the following data is_____

View Solution
