Two liquids A and B with vapour pressures 400mm Hg and 600mm Hg respectively formed a binary ideal liquid mixure shown in the following diagram . (Temepature =constant)
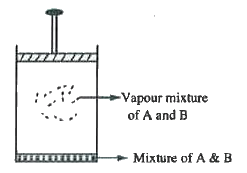
Which of the following curves correctly represents the above said mixture with varied composition .
(v.P=vapour pressure Tb =boiling point)Solution in Telugu
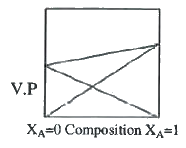
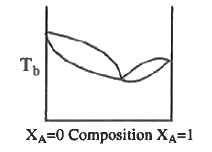
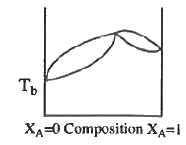
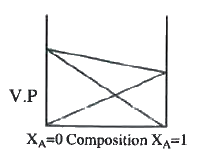
The correct Answer is:D
Step by step video & image solution for Two liquids A and B with vapour pressures 400mm Hg and 600mm Hg respectively formed a binary ideal liquid mixure shown in the following diagram . (Temepature =constant) Which of the following curves correctly represents the above said mixture with varied composition . (v.P=vapour pressure T_(b) =boiling point) by Chemistry experts to help you in doubts & scoring excellent marks in Class 12 exams.
Updated on:21/07/2023Similar Questions
Two liquids A and B with vapour pressures 400mm Hg and 600mm Hg respectively formed a binary ideal liquid mixure shown in the following diagram . (Temepature =constant)
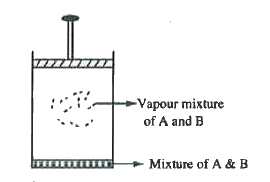
If the mole fraction of 'A' in the vapour phase is 0.5 , What is the optimum pressure , above which the vapour phase can start condensig back into liquid.
View SolutionTwo liquids A and B with vapour pressures 400mm Hg and 600mm Hg respectively formed a binary ideal liquid mixure shown in the following diagram . (Temepature =constant) What is true in case of the guven mixture
View SolutionThe vapour pressure of pure liquids A and B are 450 and 700 mm Hg at 350 K respectively. Find out the composition of the liquid mixture if total vapour pressure is 600 mm Hg. Also find the composition of the vapour phase.
View SolutionThe vapour pressures fo pure liquids A and B are 450 mm Hg and 700 mm Hg respectively at 350K. If the total vapour pressure of the mixture of the two liquids at 350K is 600mm Hg, Calculate the more fractions of the two components in the solution. Also, calcuate the partial pressures of the two components in the vapour phase.
View SolutionThe vapour pressure of pure liquid A and B are 450mm and 700mm of Hg respectively at 350 K. Calculate the composition of liquid mixture if total vapour pressure is 600mm of Hg also find the composition of the mixture in vapour phase.
View SolutionThe vapour pressure of pure liquids A and B are 450 and 700mm Hg respectively at 350K. Find out the composition of the liquid mixture if total vapour pressure observed is 600mm Hg.
View SolutionTwo liquids A and B form an ideal soluton. The vapour pressure of pure A and pure B are 66mmHg and 88mmHg, respectively. Calculate the composition of vapour A in the solution which is equilbrium and whose molar volume is 36%.
View Solution
