Which of the diagrams in figure, correctly shows the change in kinetic energy of an iron sphere falling freely in a lake having sufficient depth to impart if a terminal velocity ?
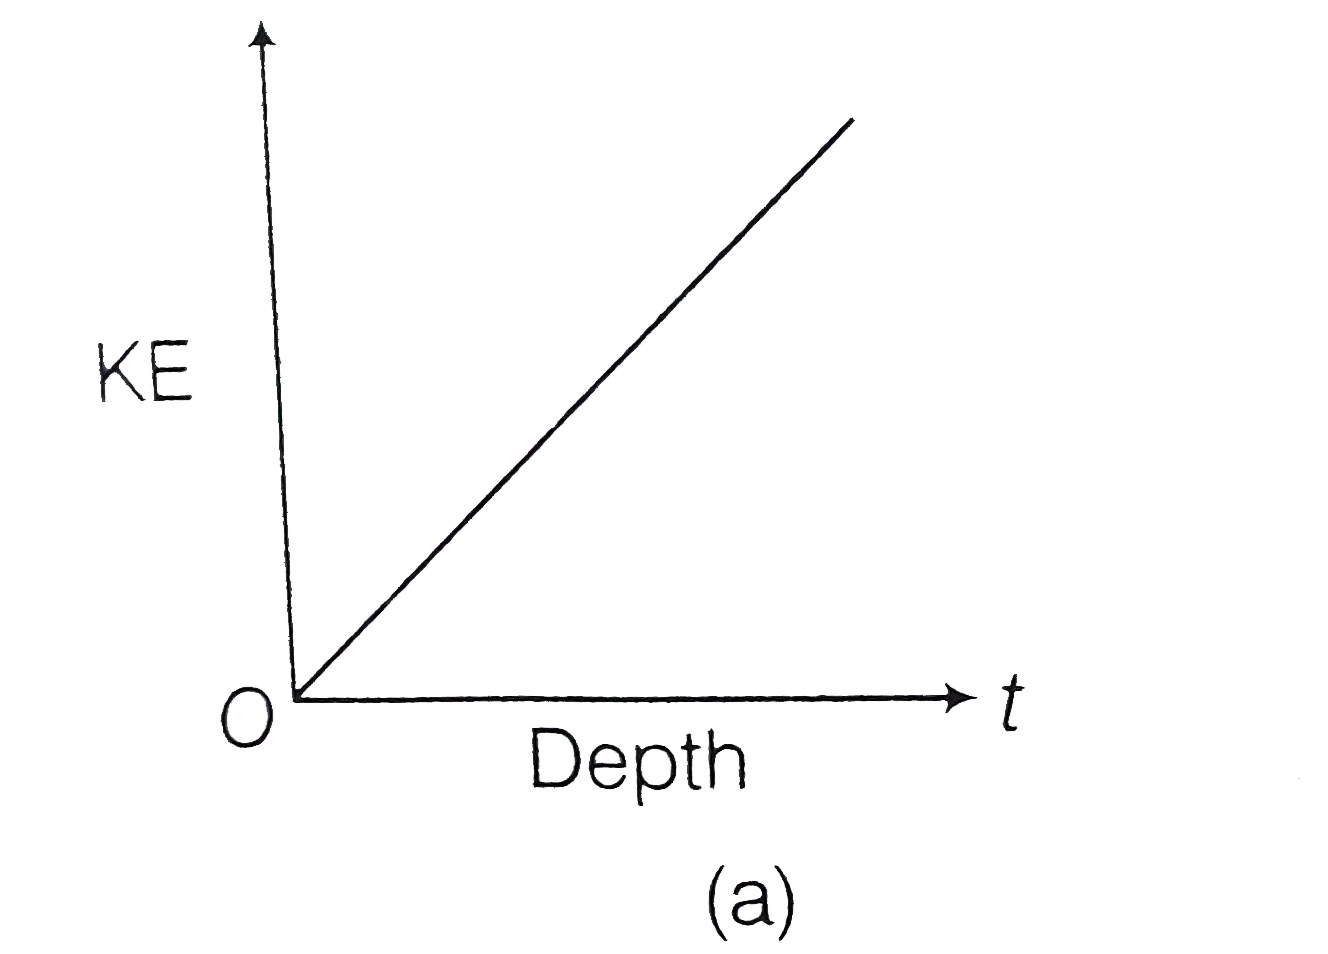
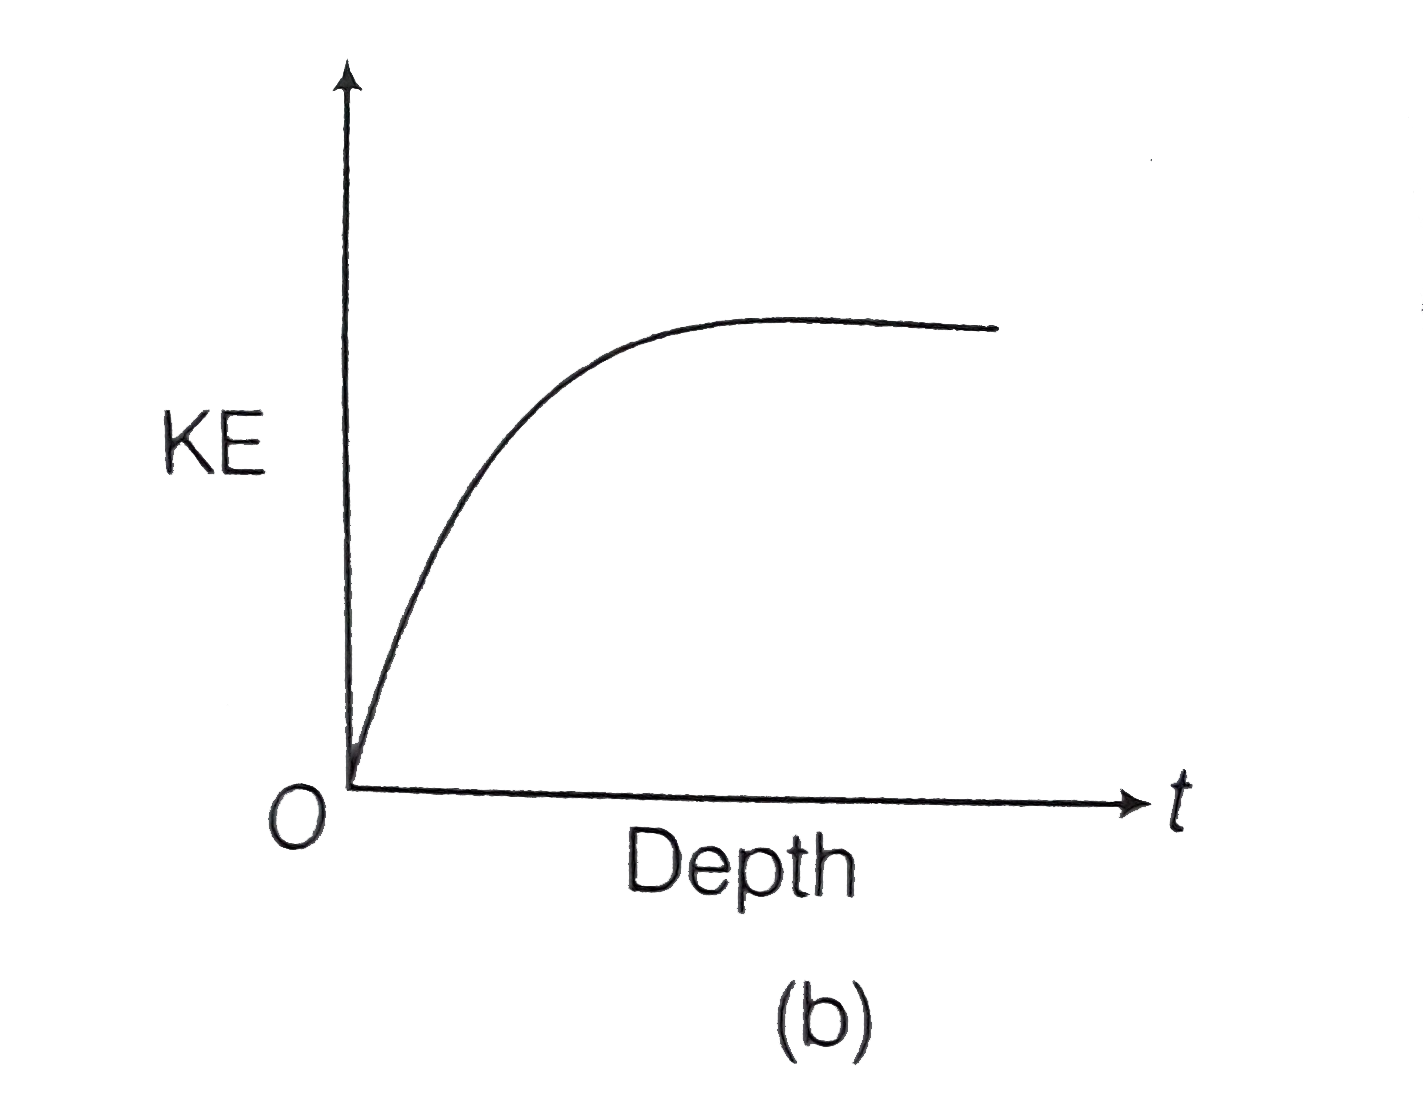
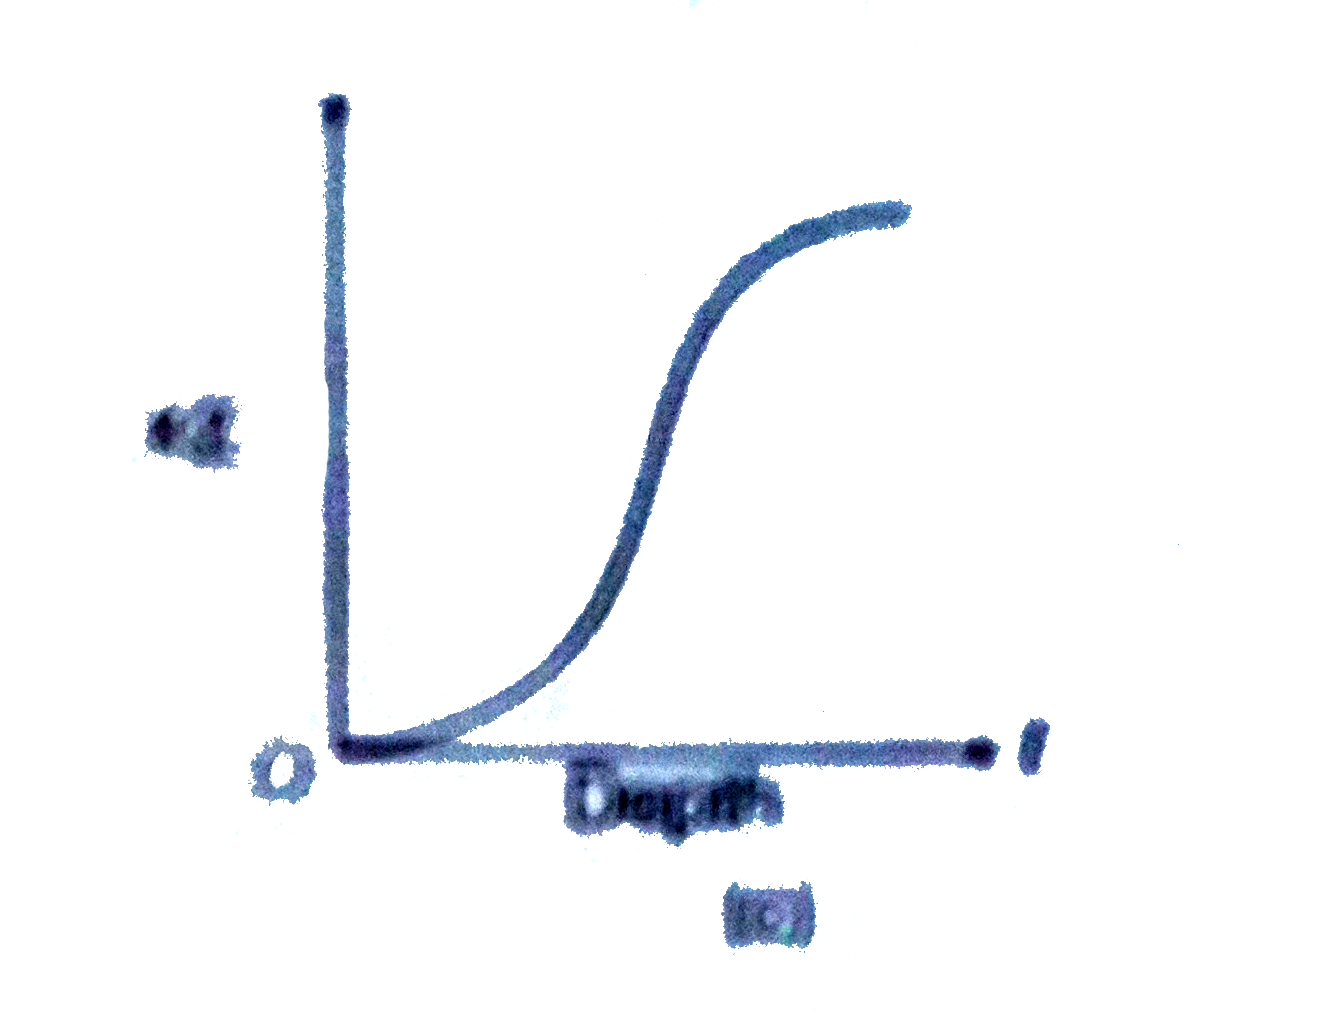
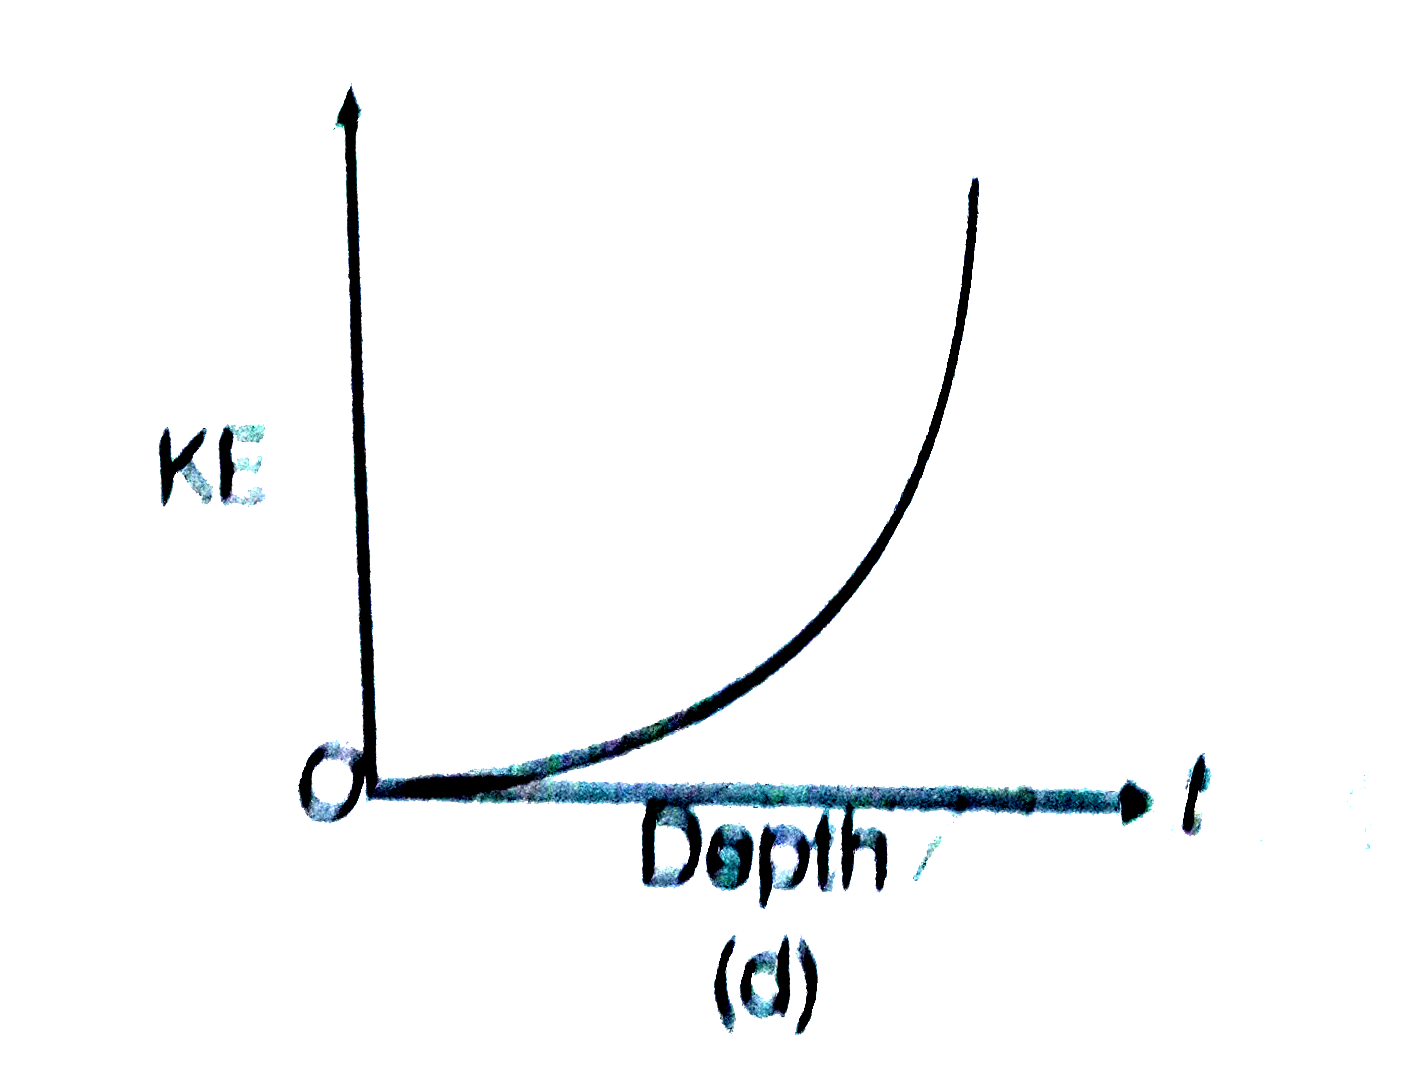
(b) First velocity of the iron sphere increases and after sometime becomes constant called terminal velocity. Hence accordingly first KE increases and then becomes constant which is best represented by(b).
Similar Questions
Knowledge Check
Which of the diagrams corectly shows the change in kinetic energy of an iron sphere falling freely in a lake having sufficient depth to impart it a terminal velocity ?
A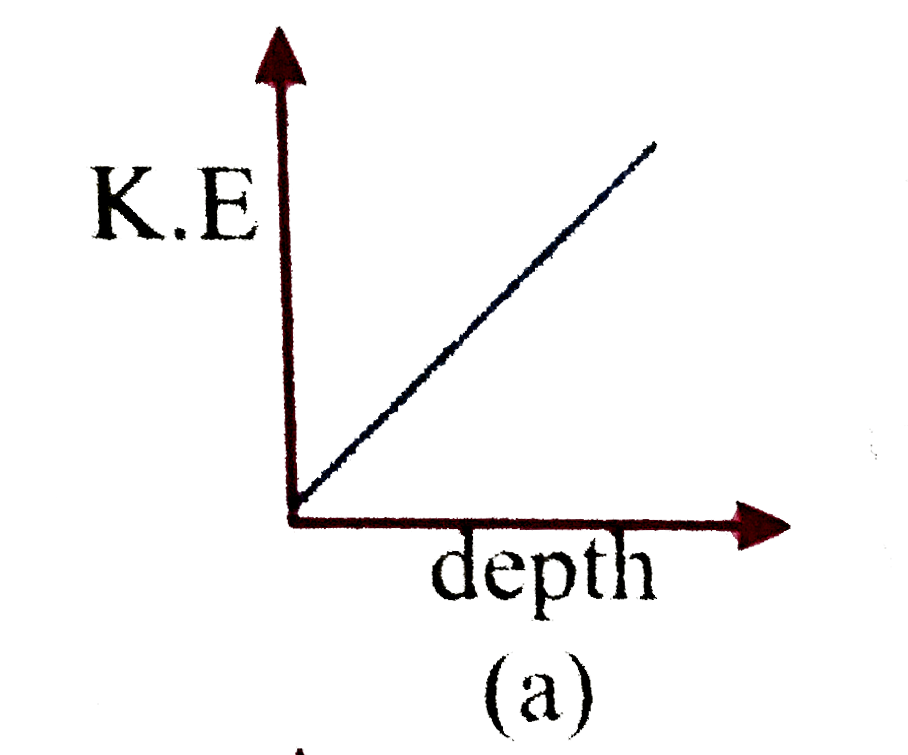 .B
.B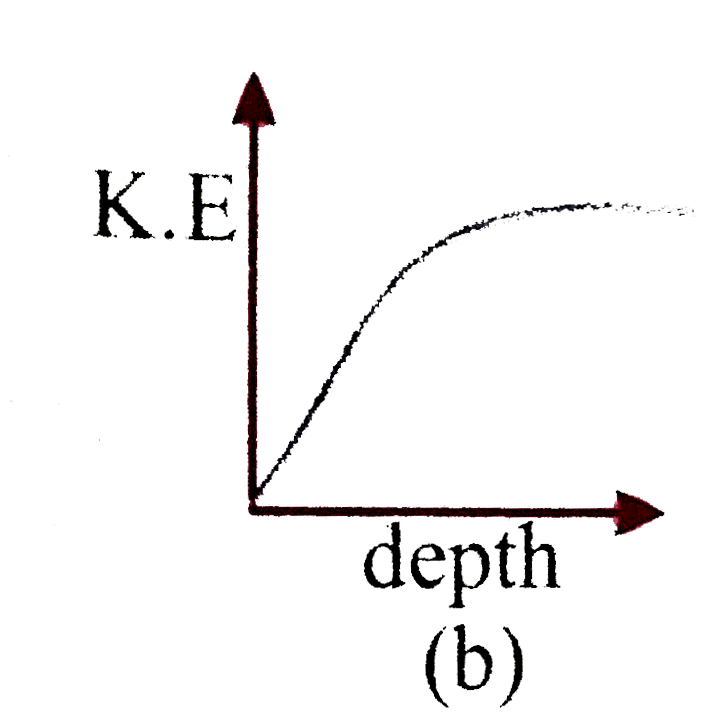 .C
.C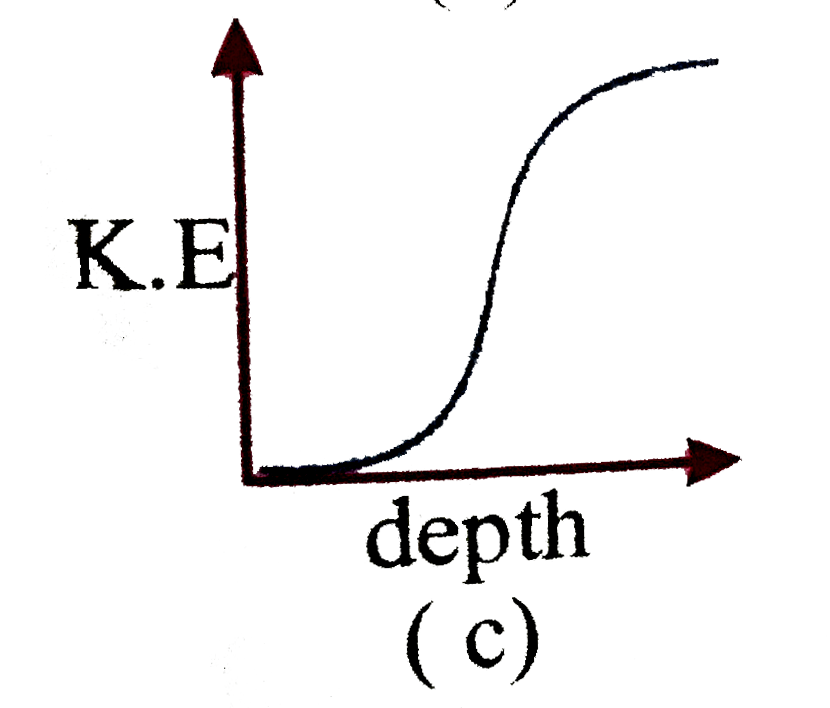 .D
.D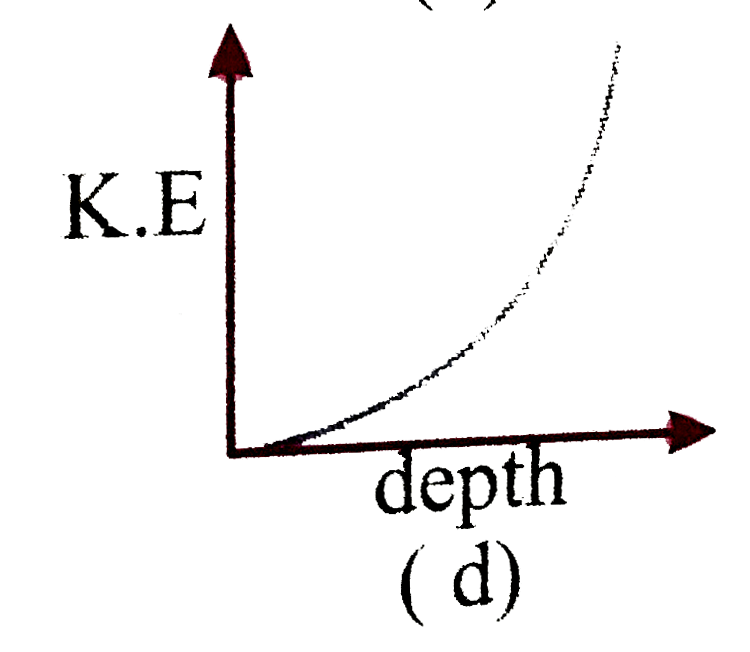 .
.Which figure correctly shows two iron nails hanging from a bar magnet?
A B
B C
C D
D
A raindrop falling from a height h above ground, attains a near terminal velocity when it has fallen through a height (3/4)h. Which of the diagrams shown in figure correctly shows the change in kinetic and potential energy of the drop during its fall up to the ground ?
A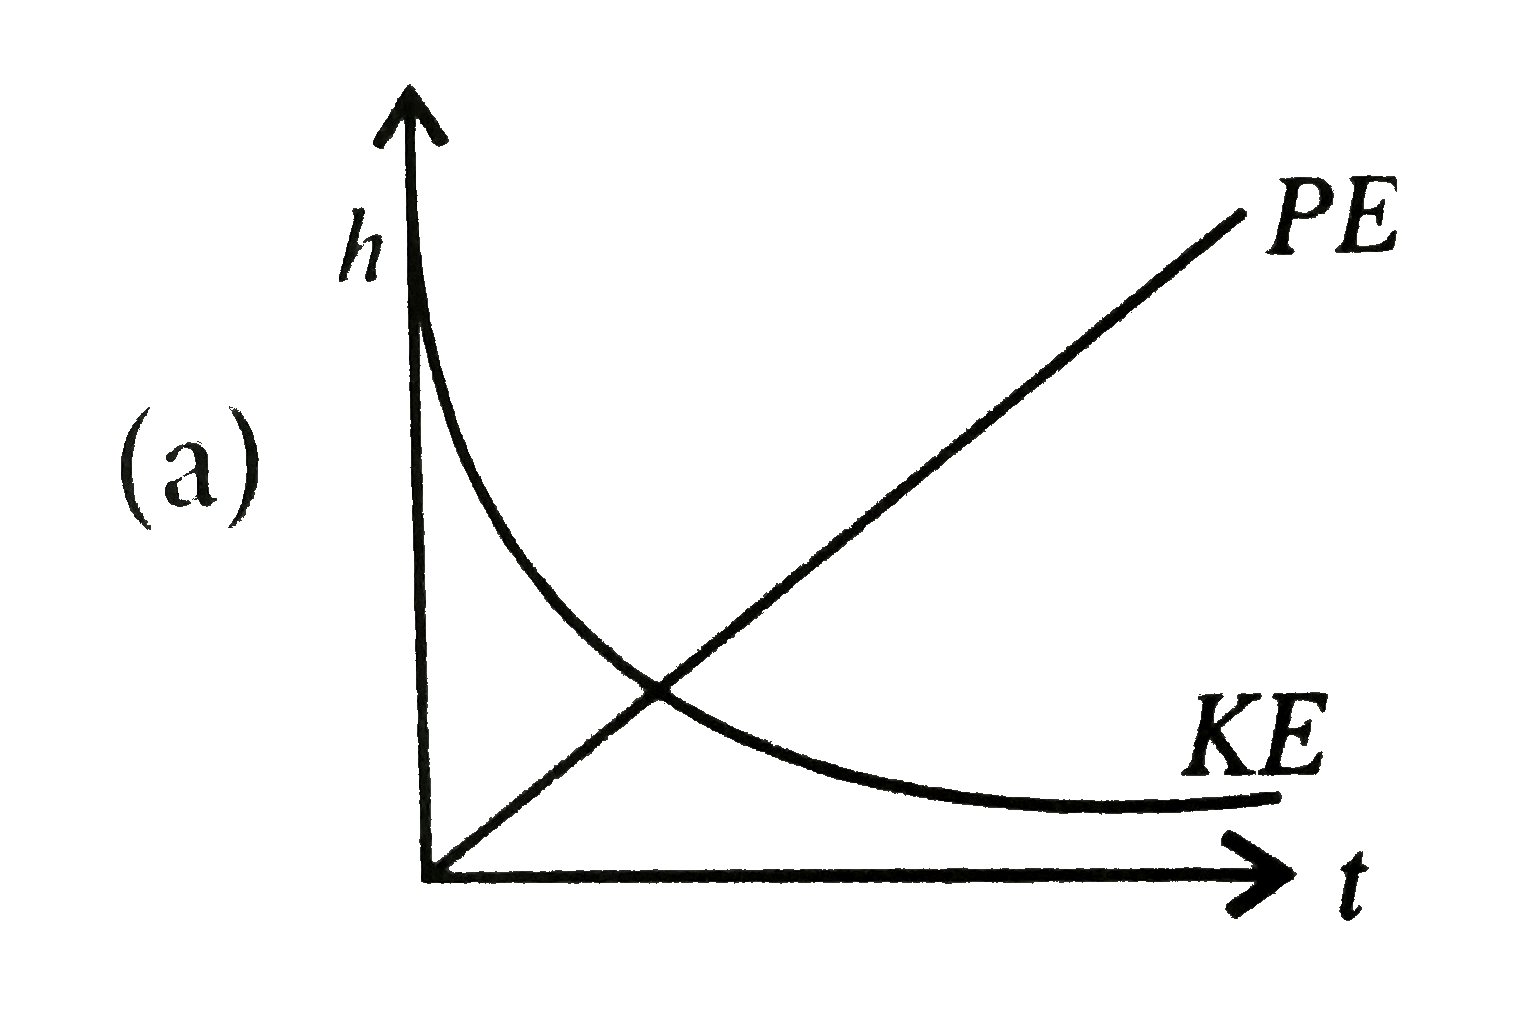 B
B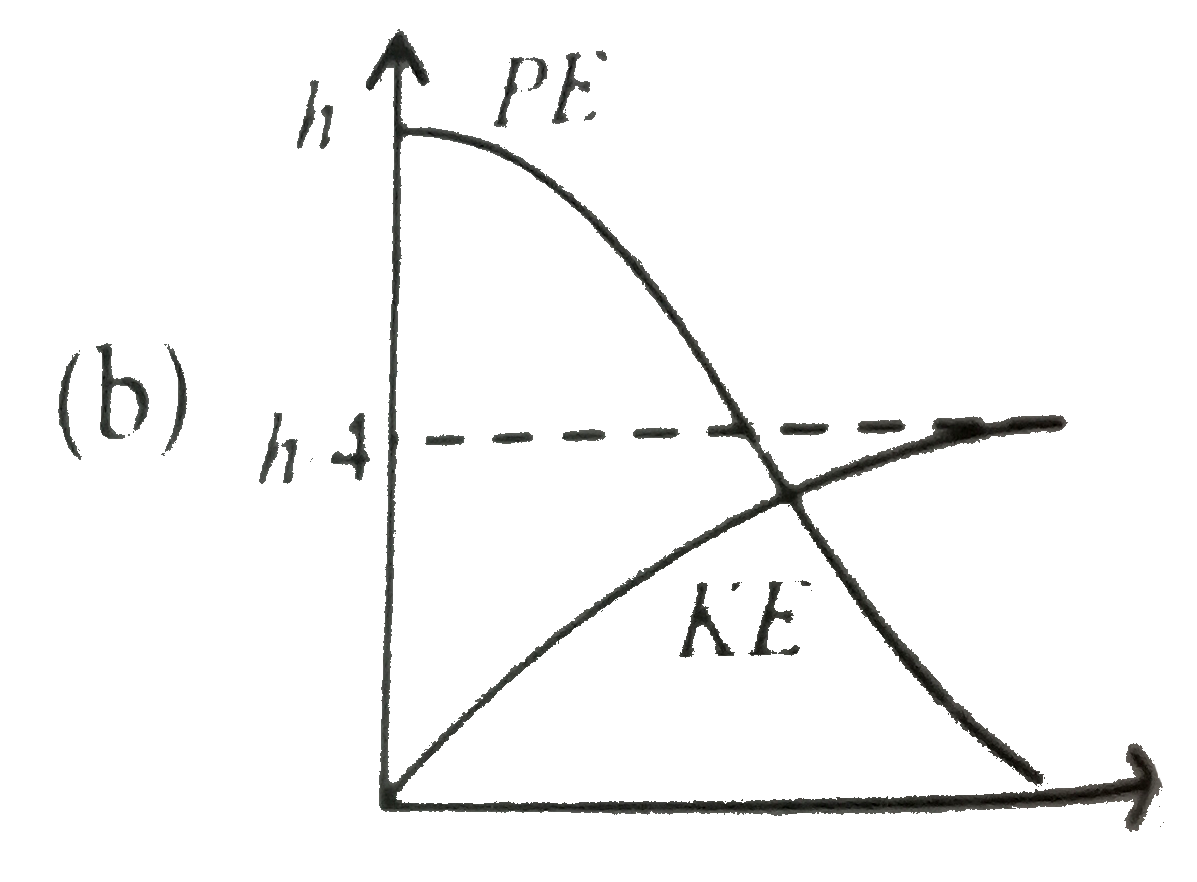 C
C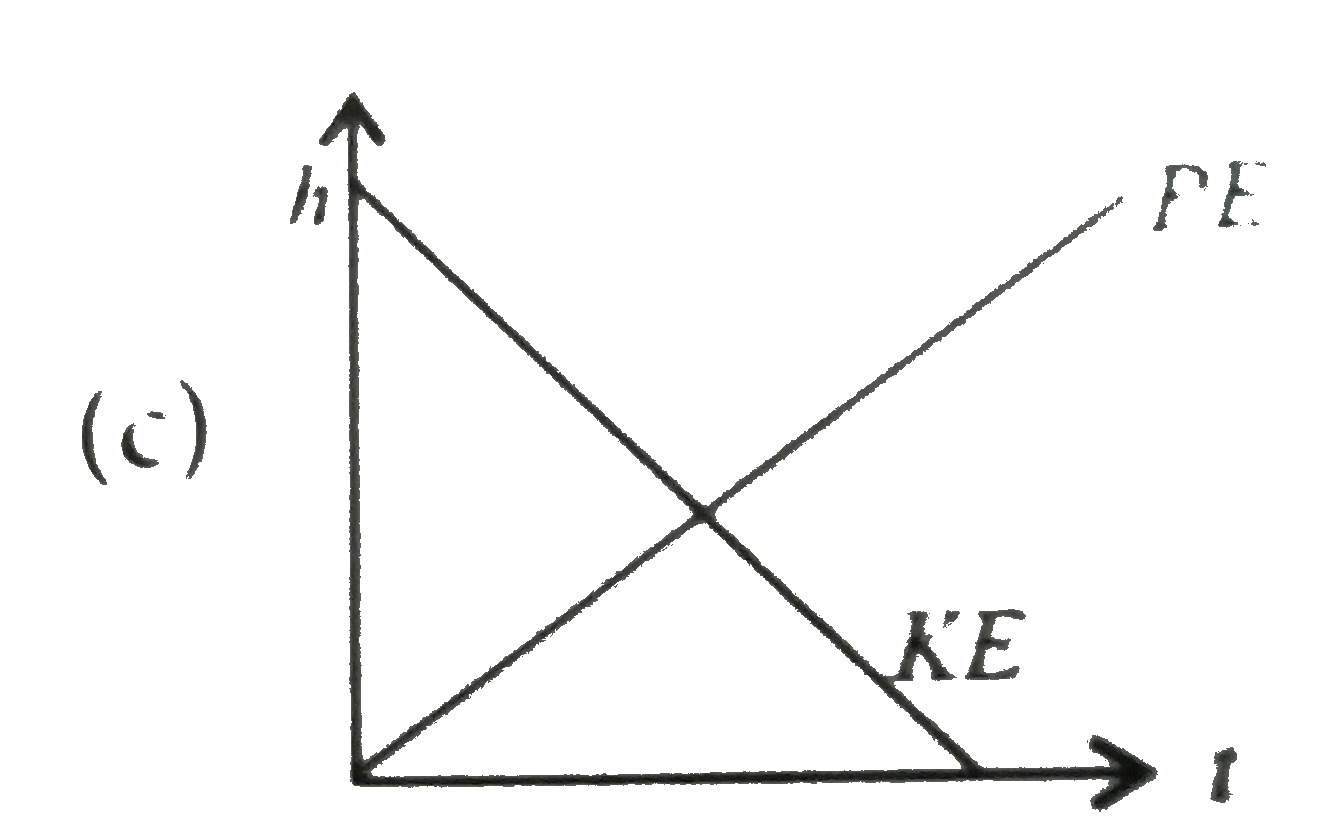 D
D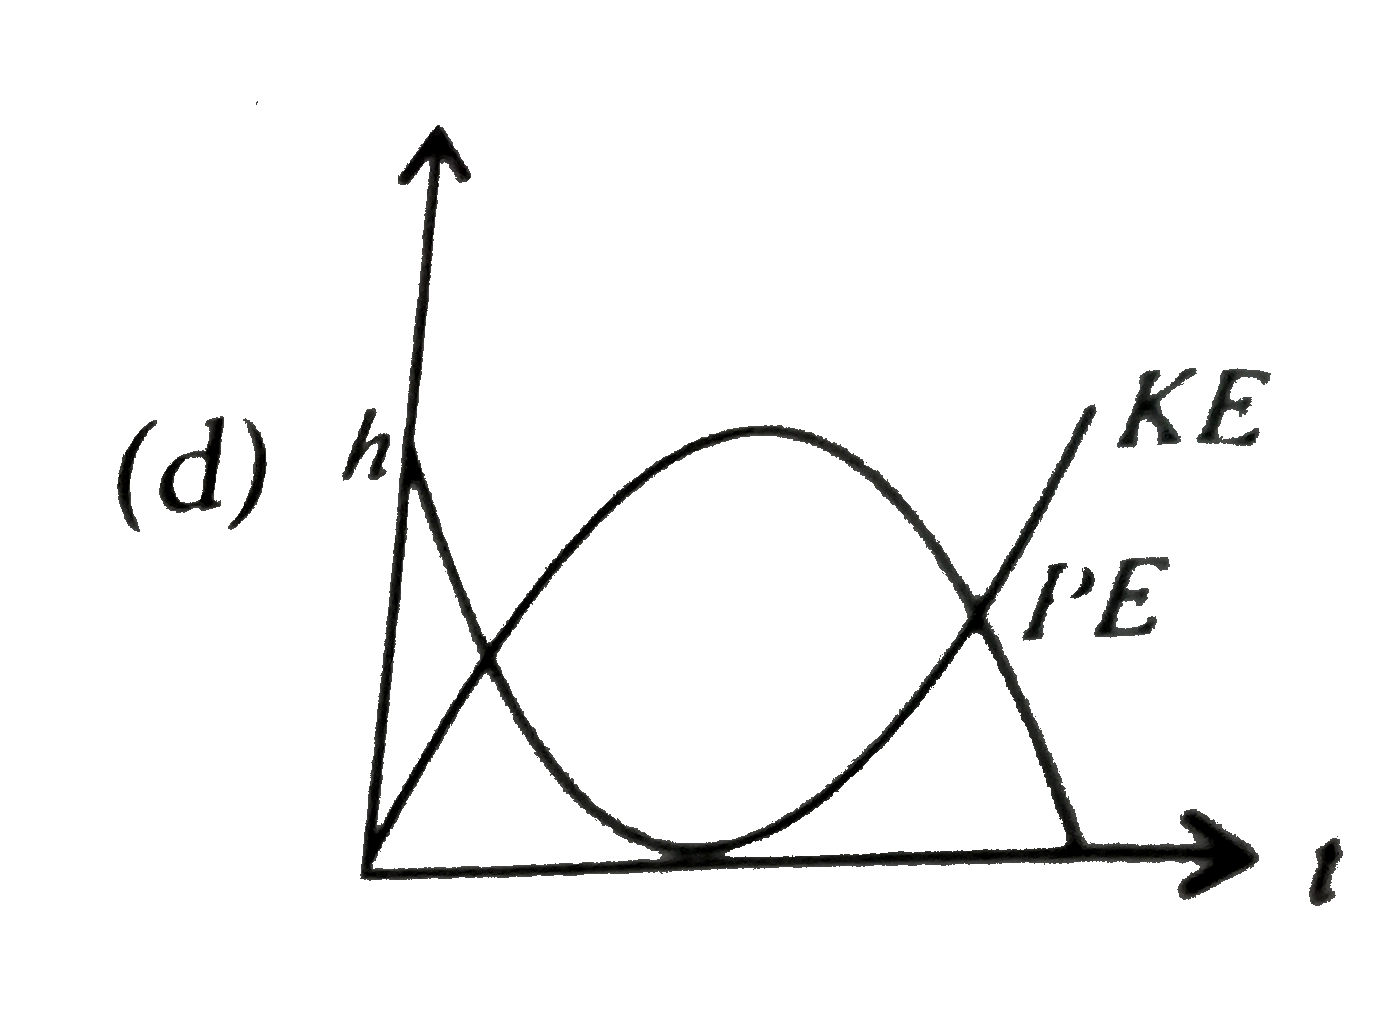
Which of the following graph correctly represents velocity-time relationship for a particle released from rest to fall freely under gravity ?
View Solution
In a photoelectric effect experiment , the maximum kinetic energy of the ejected photoelectrons is measured for various wavelength of the incident light. Figure shows a graph of this maximum kinetic energy Kmax as a function of the wavelength λ of the light falling on the surface of the metal. Which of the following statement/i is/ are correct?
View SolutionA raindrop falling from a height h above ground, attains a near terminal velocity when it has fallen through a height (3/4)h. Which of the diagrams shown in figure correctly shows the change in kinetic and potential energy of the drop during its fall up to the ground ?
View SolutionWhich of the following graph correctly represents velocity-time relationship for a particle released from rest to fall freely under gravity ?
View Solution
In a photoelectric effect experiment , the maximum kinetic energy of the ejected photoelectrons is measured for various wavelength of the incident light. Figure shows a graph of this maximum kinetic energy Kmax as a function of the wavelength λ of the light falling on the surface of the metal. Which of the following statement/i is/ are correct?
View Solution
