Draw areal velocity time graph for Mars.
To draw the areal velocity time graph for Mars, we need to understand the concept of areal velocity and how it relates to a planet's motion around the Sun.
1. Understanding Areal Velocity: Areal velocity is defined as the area swept out by the radius vector of a planet in a given time interval. For a planet like Mars, which revolves around the Sun in an elliptical orbit, the areal velocity remains constant according to Kepler's second law of planetary motion.
2. Identifying the Axes: In the graph, we will have:
- The x-axis representing time (t).
- The y-axis representing areal velocity (A).
3. Constant Areal Velocity: Since the areal velocity for Mars is constant as it orbits the Sun, we can denote this constant value as A0. This means that regardless of the time, the areal velocity does not change.
4. Plotting the Graph:
- On the y-axis, mark the constant value A0.
- Draw a horizontal line parallel to the x-axis at the height of A0. This line indicates that the areal velocity remains constant over time.
5. Labeling the Graph: Clearly label the axes:
- The x-axis as "Time (t)".
- The y-axis as "Areal Velocity (A)".
- Indicate the constant value A0 on the y-axis.
Final Graph:
The final graph will show a horizontal line at the level of A0 across the time axis, indicating that the areal velocity of Mars remains constant as it revolves around the Sun.
- The x-axis representing time (t).
- The y-axis representing areal velocity (A).
- On the y-axis, mark the constant value A0.
- Draw a horizontal line parallel to the x-axis at the height of A0. This line indicates that the areal velocity remains constant over time.
- The x-axis as "Time (t)".
- The y-axis as "Areal Velocity (A)".
- Indicate the constant value A0 on the y-axis.
The final graph will show a horizontal line at the level of A0 across the time axis, indicating that the areal velocity of Mars remains constant as it revolves around the Sun.
Topper's Solved these Questions
- GRAVITATIONBOOK - NCERT EXEMPLAR ENGLISHCHAPTER - GRAVITATIONEXERCISE - Short Answer type question
6 Videos
- GRAVITATIONBOOK - NCERT EXEMPLAR ENGLISHCHAPTER - GRAVITATIONEXERCISE - Long Answer type question
5 Videos
- GRAVITATIONBOOK - NCERT EXEMPLAR ENGLISHCHAPTER - GRAVITATIONEXERCISE - Long Answer type question
5 Videos
- KINETIC THEORYBOOK - NCERT EXEMPLAR ENGLISHCHAPTER - KINETIC THEORYEXERCISE - Multiple Choice Questions (MCQs)
31 Videos
Similar Questions
Draw a velocity-time graph for a body moving with an initial velocity u and uniform acceleration a. Use this graph to find the distance travelled by the body in time t.
View SolutionDraw a velocity-time graph for the free fall of a body under gravity, starting from rest. Take g= 10 m s−2
View Solution
Knowledge Check
The area under velocity-time graph for a particle in a given interval of time represnets
AvelocityBaccelerationCwork doneDDisplacement does not tell the nature of the actual motion of a particle between the points.
A ball is thrown upward with an ini tial velocity of 100ms−1. After how much time will it return ? Draw velocity - time graph for the ball and find from the graph (i) the maximum height attained by the ball and (ii) height of the ball after 15 s. Take g=10ms−2 .
View SolutionDraw the velocity-time graph of an object moving with uniform negative acceleration.
View SolutionDraw velocity – time graph of uniformly accelerated motion in one dimension. From the velocity – time graph of uniform accelerated motion, deduce the equations of motion in distance and time.
View SolutionDraw the velocity-time graph of an object whose speed is increasing at uniform rate but moving with negative acceleration.
View Solution

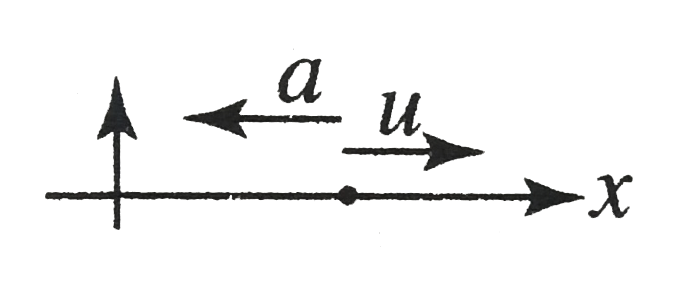
For a particle moving along straight line with constant acceleration (a), we define velocity of the particle with time as
v=u+at, (u=initial velocity)
Draw the velocity-time graph of the particle in following situations.
(i) Velocity is decresing with time (i.e., acceleration in negative)
(ii) Initial velocity is negative but acceleration is positive
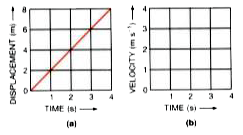
View SolutionFig. 2.37 (a) shows the displacement-time graph for the motion of a body. Use it to calculate the velocity of body at t = 1 s, 2 s and 3 s, then draw the velocitytime graph for it in Fig. (b).

View Solutiona. A ball is thrown vertically upwards. Aftre some time it trturns to the throuer. Draw the velocity-time graph and speed-time graph.
b. A ball is dropped from some height. After rebounding from the floor, it ascends to the same height. Draw the velocity-time graph and speed-time graph.
View Solution
