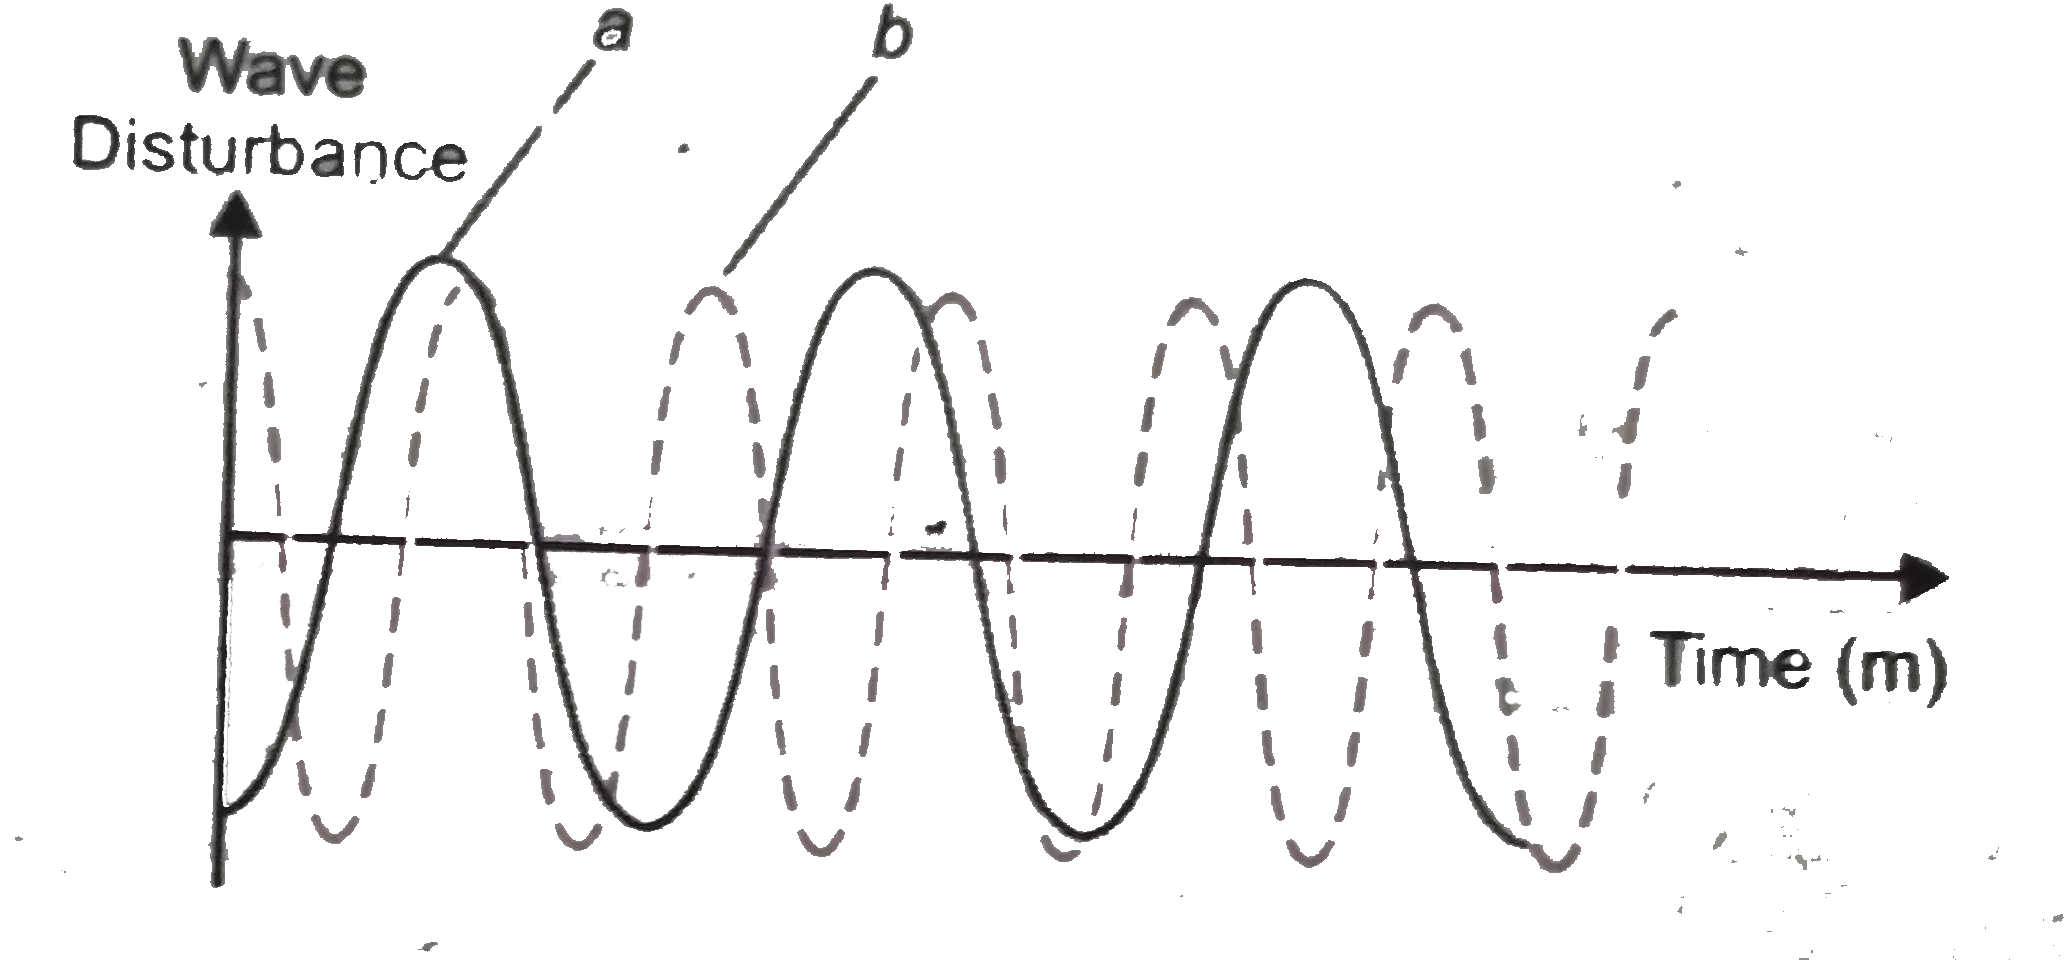
Which of the above two graphs : (a) and (b)the human voice is likely to be the male voice ? Give reason for your answer.
 .
.
Graph (i) represents the male voice. Since the pitch and frequency of male voice is lower than the pitch of female voice and vibration of graph (ii) represents higher frequency and higher pitch.
Topper's Solved these Questions
- SOUNDBOOK - NCERT EXEMPLAR ENGLISHCHAPTER - SOUNDEXERCISE - Long Answer Type Questions
3 Videos
- SOUNDBOOK - NCERT EXEMPLAR ENGLISHCHAPTER - SOUNDEXERCISE - Long Answer Type Questions
3 Videos
- MOTIONBOOK - NCERT EXEMPLAR ENGLISHCHAPTER - MOTIONEXERCISE - Long Answer Type Questions
6 Videos
- WORK AND ENERGYBOOK - NCERT EXEMPLAR ENGLISHCHAPTER - WORK AND ENERGYEXERCISE - LONG ANSWER TYPE QUESTIONS
8 Videos
Similar Questions
Can a triangle have two obtuse angles ? Give reason for your answer.
View SolutionCan all the angles of a quadrilateral be acute angles ? Give reason for your answer.
View SolutionName the wave used in sonar. Give reason to your answer.
View SolutionCan all the angles of a quadrilateral be right angles ? Give reason for your answer.
View SolutionWhich cools faster, Land or Water? Give a reason for your answer.
View SolutionWhich of the cables, one rated 5 A and the other 15 A will be of thicker wire ? Give a reason for your answer.
View SolutionIn the following figures, which wave has a higher pitch? Give reason for your answer.

View SolutionWhy do you find limited cultivation in the map extract ? Give two reasons for your answer.
View SolutionState whether the Roman number CXVVI is valid or not? Give reasons for your answer.
View SolutionWhy is inland waterways declining in its importance ? Give two reasons for your answer.
View Solution
