A TV reporter was given a task to prepare a report on the rainfall of the city Dispur of India in a particular year. After collecting the data, he analyzed the data and prepared a report on the rainfall of the city. Using this report, he drew the following graph for a particular time period of 66 days
ltimg src="https://d10lpgp6xz60nq.cloudfront.net/physics_images/MATH_041_X_SQP_E03_011_Q01.png" width="80%"gt
Based on the above graph, answer the following questions
(i) Identify less than type ogive and more than type ogive from the given graph.
(ii) Find the median rainfall of Dispur
(iii) Obtain the Mode of the data if mean rainfall is 23.4cm
Video Solution
Text Solution
(i) Curve 1 – Less than ogive, Curve2 – More than ogive
(ii) (ii) Median Rainfall = 21 cm
(iii) 3 Median = Mode + 2 mean
∴ Mode = 16.2 cm
|
Similar Questions
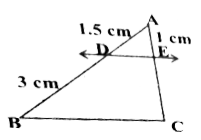
In the given fig. If DE||BC Find EC.

View SolutionAt point P, the value of dydx is :

View SolutionIdentify A,B,C and D,E
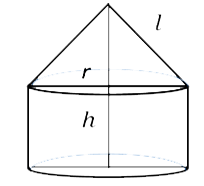
View SolutionThe total surface area of the given solid figure is _______________.

View SolutionIf y−x=80∘ then find the values of x and y.

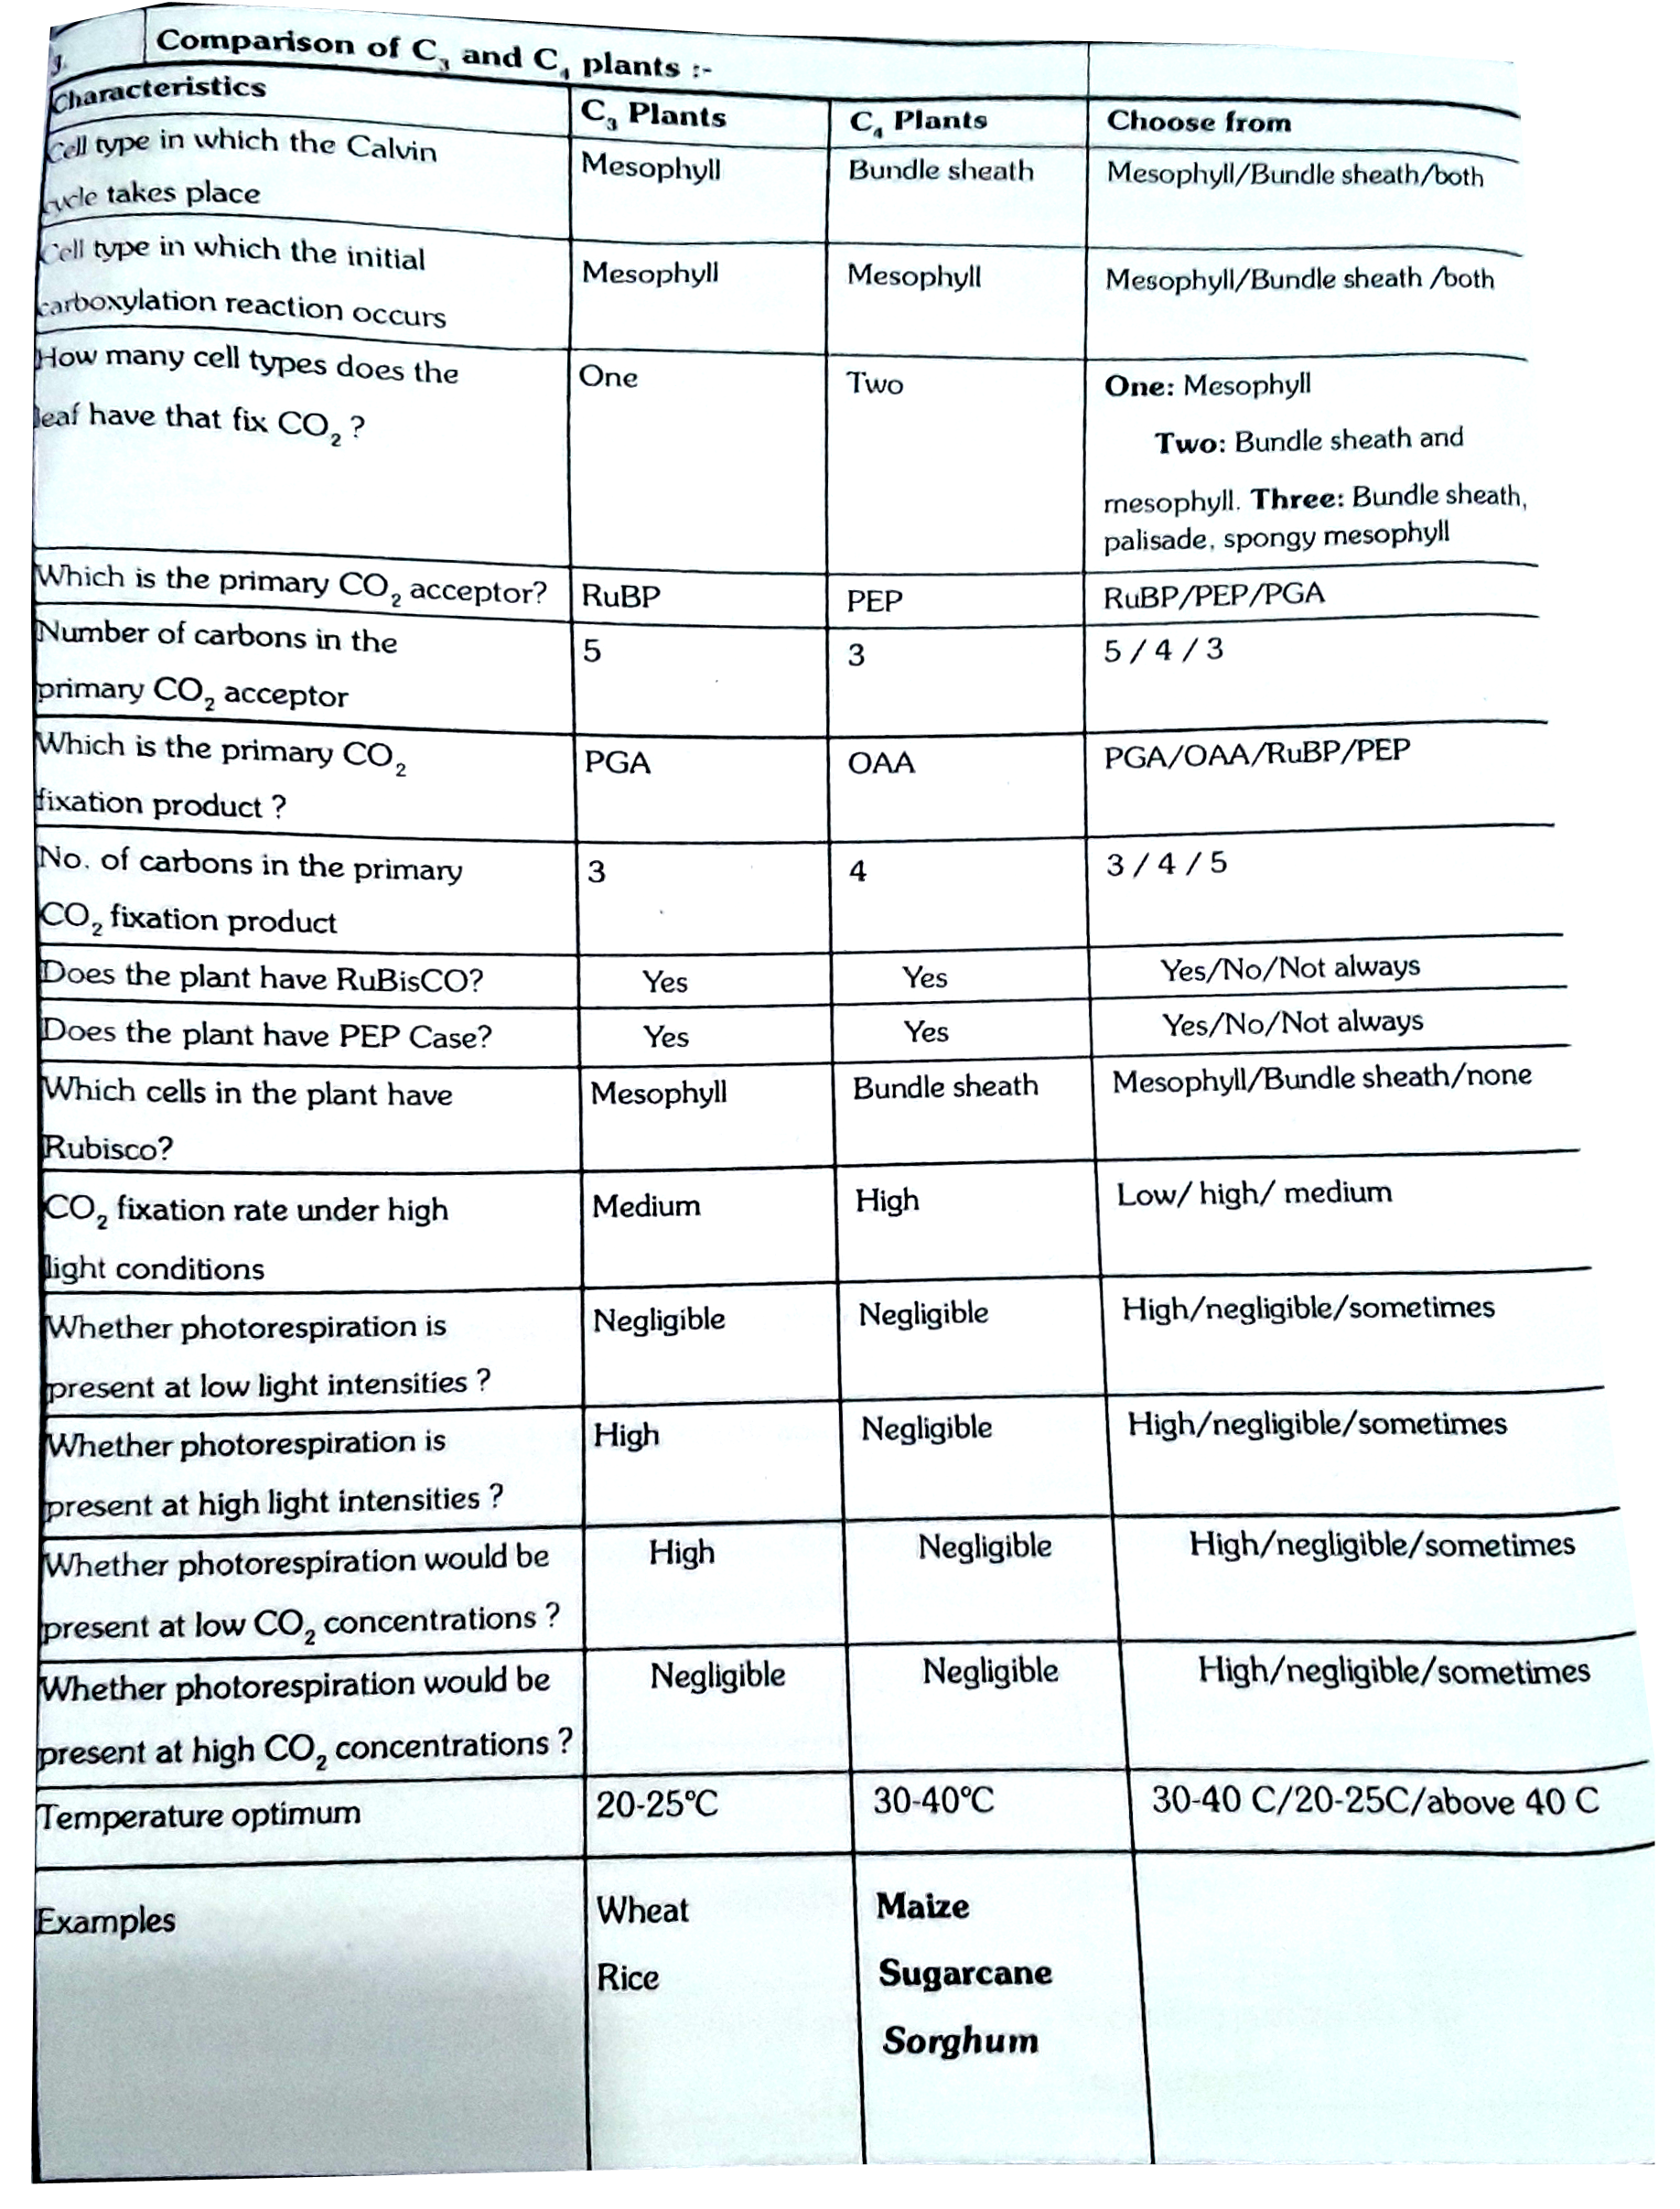
View SolutionComparison of C3andC4 plants:-

View SolutionThe equation of straight line shown in figure is :

View SolutionFind contact force between 2 kg and 3 kg blocks :-

View SolutionShifting of the curve to right takes place in the case of ltimg src="https://d10lpgp6xz60nq.cloudfront.net/physics_images/ALN_BIO_NTUG_E01_065_Q01.png" width="80%"gt
View SolutionRefer the given figure and identify correct statement(s)

View Solution
