All the students of a class performed poorly in Mathematics. The teacher decided to give grace marks of 10 to each of the students. Which of the following statistical measures will not change even after the grace marks were given ? (1) median (2) mode (3) variance (4) mean
median
mode
variance
mean
The correct Answer is:c
To solve the problem, we need to analyze how each of the statistical measures (mean, median, mode, and variance) is affected when a constant value (grace marks of 10) is added to each student's score.
Step 1: Understanding the Mean
- The mean is calculated by summing all the observations and dividing by the number of observations. If we add a constant value (10) to each observation, the new mean will be the old mean plus that constant value.
- Therefore, the mean will change.
Step 2: Understanding the Median
- The median is the middle value when the data is arranged in order. If we add a constant value to each observation, the order of the data remains the same, and the middle value will also increase by that constant.
- Therefore, the median will change.
Step 3: Understanding the Mode
- The mode is the value that appears most frequently in the data set. If we add a constant value to each observation, the mode will also increase by that constant value.
- Therefore, the mode will change.
Step 4: Understanding the Variance
- Variance measures the spread of the data around the mean. It is calculated as the average of the squared differences from the mean. When we add a constant value to each observation, the differences from the mean do not change; they remain the same because the mean itself has also increased by that constant.
- Therefore, the variance will remain the same.
Conclusion:
The statistical measure that will not change after adding grace marks of 10 to each student is the variance.
Final Answer: (3) Variance
---
- The mean is calculated by summing all the observations and dividing by the number of observations. If we add a constant value (10) to each observation, the new mean will be the old mean plus that constant value.
- Therefore, the mean will change.
- The median is the middle value when the data is arranged in order. If we add a constant value to each observation, the order of the data remains the same, and the middle value will also increase by that constant.
- Therefore, the median will change.
- The mode is the value that appears most frequently in the data set. If we add a constant value to each observation, the mode will also increase by that constant value.
- Therefore, the mode will change.
- Variance measures the spread of the data around the mean. It is calculated as the average of the squared differences from the mean. When we add a constant value to each observation, the differences from the mean do not change; they remain the same because the mean itself has also increased by that constant.
- Therefore, the variance will remain the same.
The statistical measure that will not change after adding grace marks of 10 to each student is the variance.
Topper's Solved these Questions
- STATISTICSBOOK - CENGAGE ENGLISHCHAPTER - STATISTICSEXERCISE - Exercises
39 Videos
- SOLUTIONS AND PROPERTIES OF TRIANGLE BOOK - CENGAGE ENGLISHCHAPTER - SOLUTIONS AND PROPERTIES OF TRIANGLE EXERCISE - Comprehension Type
6 Videos
- STRAIGHT LINEBOOK - CENGAGE ENGLISHCHAPTER - STRAIGHT LINEEXERCISE - Multiple Correct Answers Type
8 Videos
Similar Questions
All the students of a class performed poorly in Mathematics. The teacher decided to give grace marks of 12 to the entire class. Which of the following statistical measures will not change even after the grace marks were given?
View SolutionAll the students of a class performed poorly in physics. The teacher decided to give grace marks of 15 to the entire class. Which of the following statistical measures will not change even after the grace marks were given?
View SolutionThe following table gives the marks of 5 students in Science and Maths.

Find the mean, median, and mode of the marks scored in Science
View SolutionIn a class of 40 students, marks obatined by the students in a class test (out of 10) are given below :

Calculate the following for the given distribution :
(i) Median
(ii) Mode
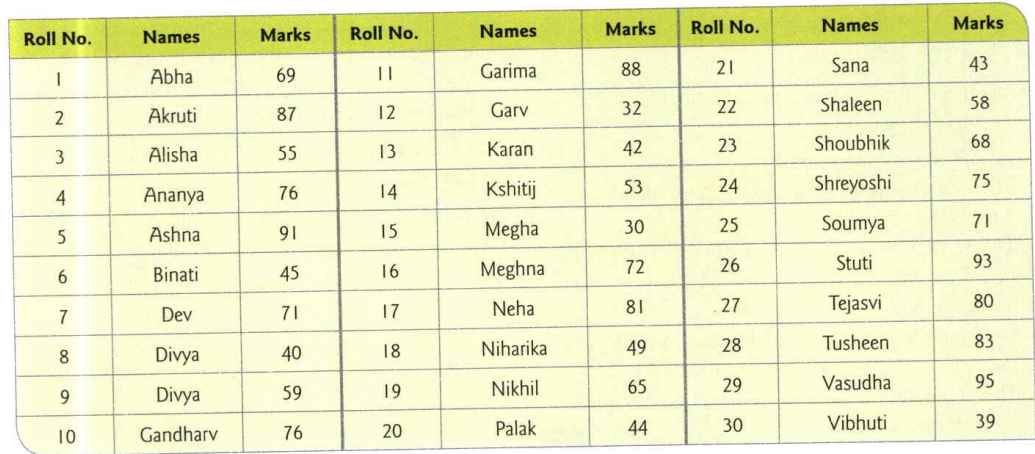
View SolutionThirty students of Class 7 have appeared for a mathematics examinations.
The mathematics teacher Ms Rinku has to keep a record of the marks obtained by each student and prepare the result of each student ? From the given figure, State what are the data collected for each students and how it is useful if you have this figure.

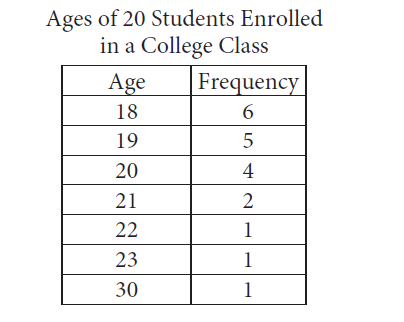
View SolutionAges of 20 Students Enrolled in a College Class

The table above shows the distribution of ages of the 20 students enrolled in a college class. Which of the following gives the correct order of the mean, median, and mode of the ages?
View SolutionA student got the following marks in 9 questions of a question paper.
3,5,7,3,8,0,1,4 and 6. Find the median of these marks.
View SolutionThe adjoining pie chart gives the marks scored in an examination by a student in Hindi, English, Mathematics, Social Science and Science. If the total marks obtained by the students were 540, answer the following questions.(i) In which subject did the student score 105 marks?(Hint: for 540 marks, the central angle = 360°. So, for 105 marks, what is the central angle?)(ii) How many more marks were obtained by the student in Mathematics than in Hindi?(iii) Examine whether the sum of the marks obtained in Social Science and Mathematics is more than that in Science and Hindi (Hint: Just study the central angles).
View SolutionGiven below (figure) is the bar graph indicating the marks obtained out of 50 in mathematics paper by 100 students. Read the bar graph and answer the following questions: It is decided to distribute work books on mathematics to the students obtaining less then 20 marks, giving one workbook to each of such students. If a work book costs Rs.5, what sum is required to buy the work books? Every student belonging to the highest mark group is entitled to get a prize of Rs. 10. How much amount of money is required for distributing the prize money? Every student belonging to the lowest mark-group has to solve 5 problems per day. How many problems, in all, will be solved by the students of this group per day? State whether true or false. 17% students have obtained marks ranging from 40 to 49. 59 students have obtained marks ranging from 10 to 29. What is the number of students getting less than 20 marks? What is the number of students getting more than 29 marks? What is the number of students getting marks between 9 to 40? What is the number of students belonging to the highest mark group? What is the number of students obtaining more than 19 marks?
View SolutionThe marks obtained by 100 students in a Mathematics test are given below :

Draw an ogive for the given distribution on a graph sheet.
(Use a scale of 2 cm = 10 units on both axis).
Use the ogive to estimate the :
(i) median.
View Solution
