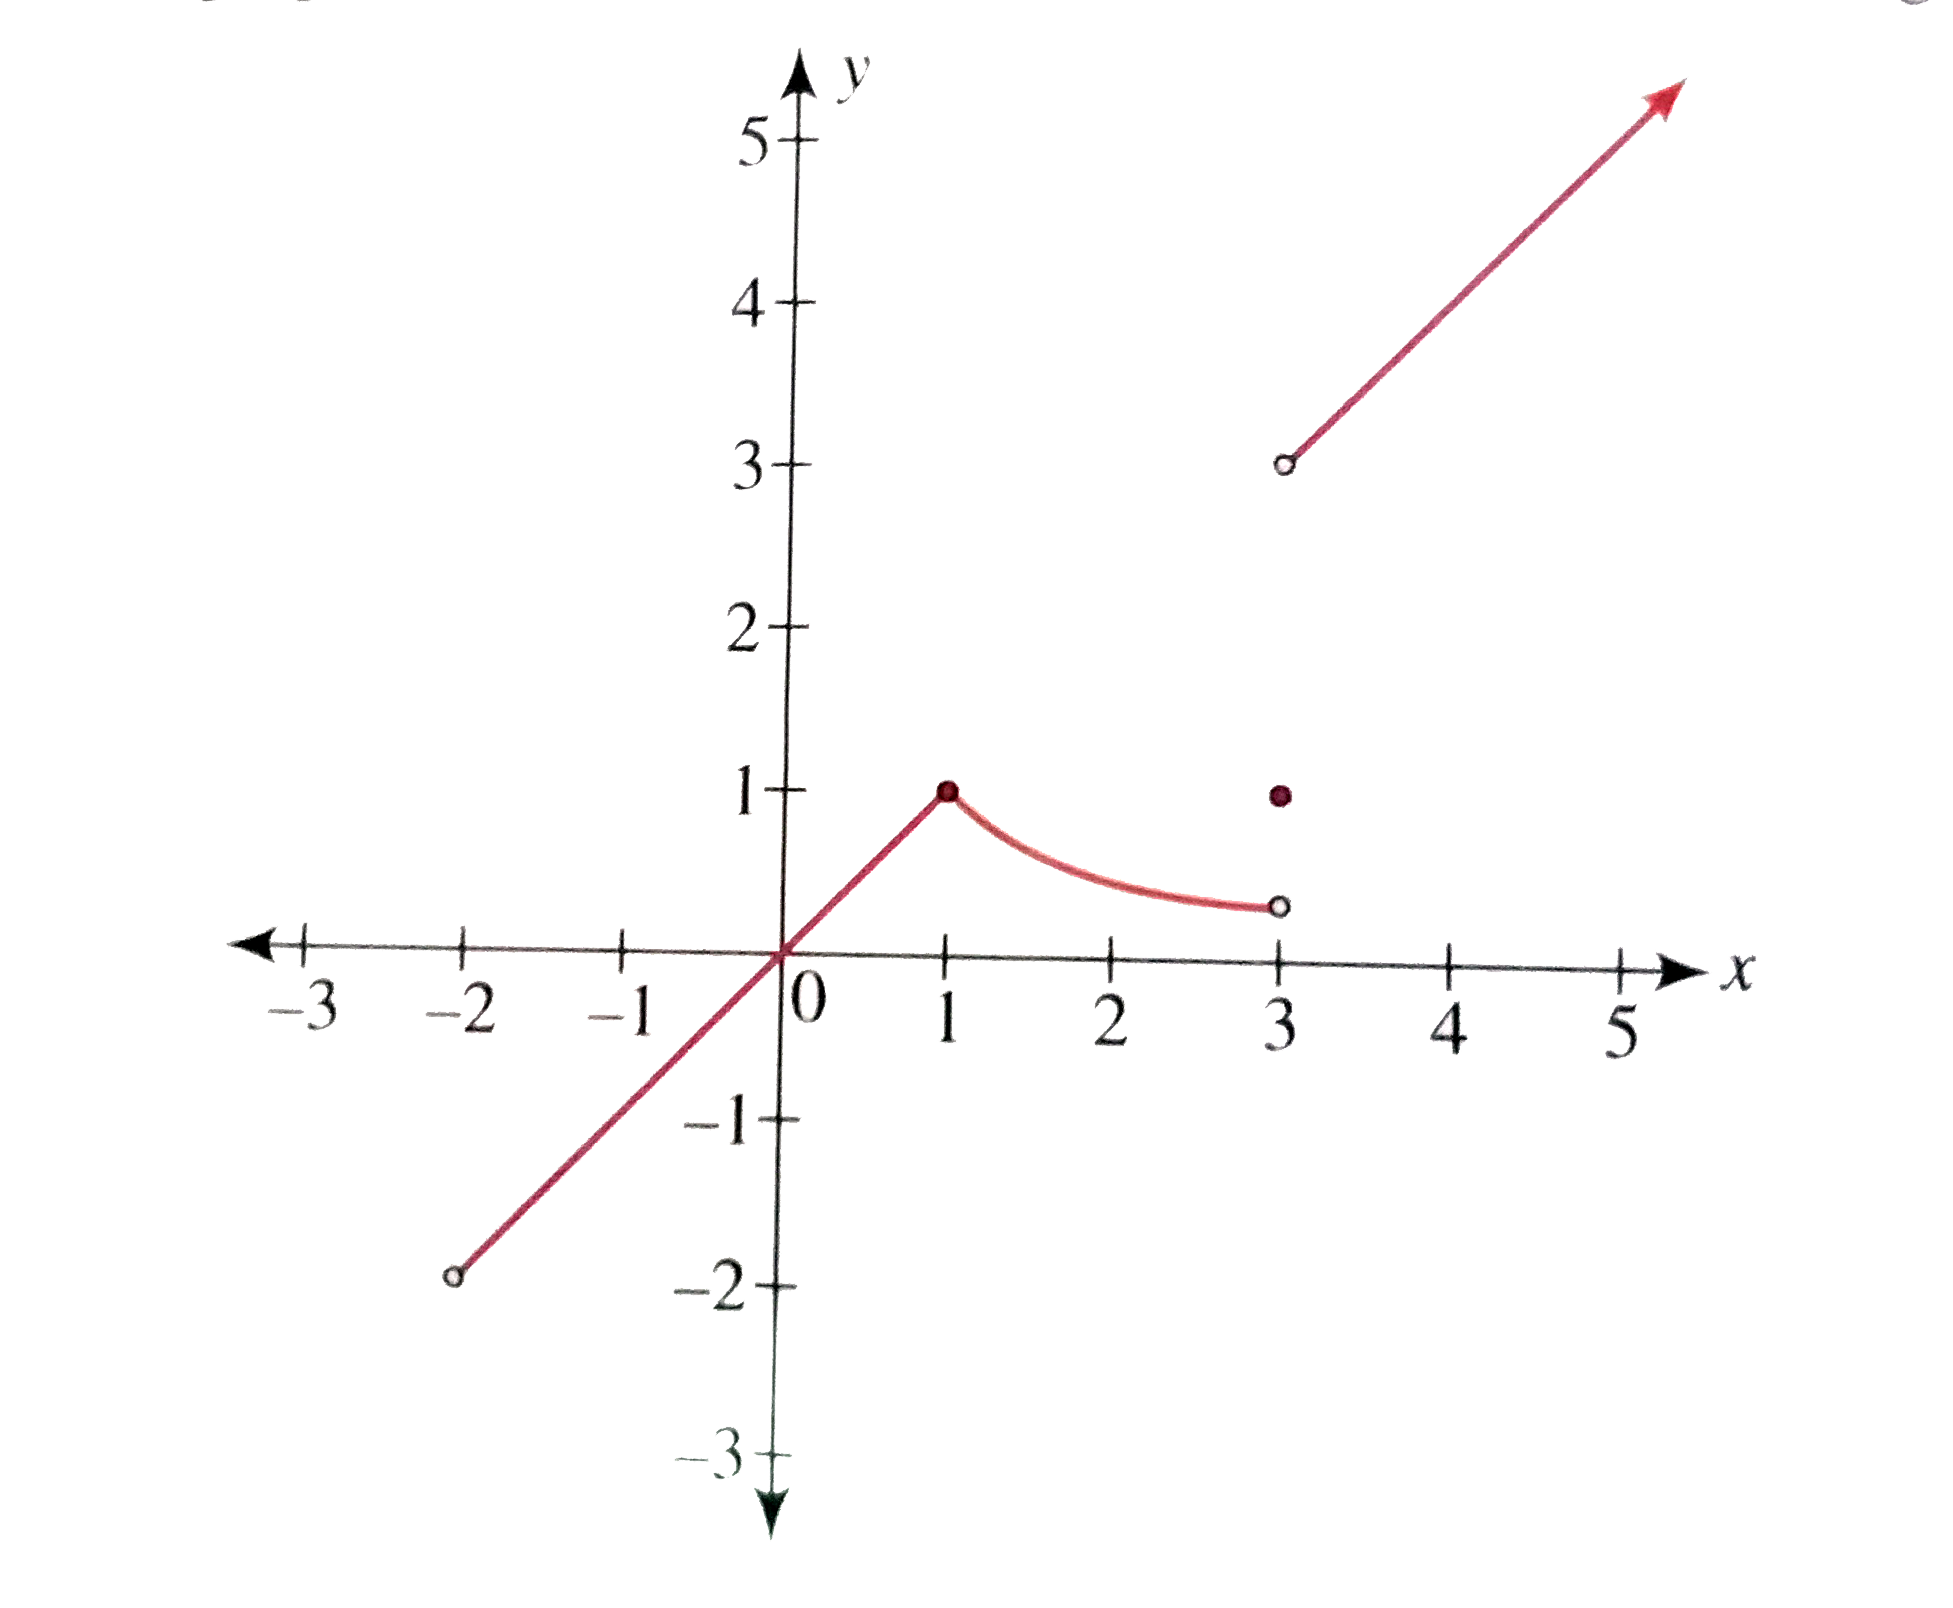
The graph of the function y=f(x) is as shown in the figure.
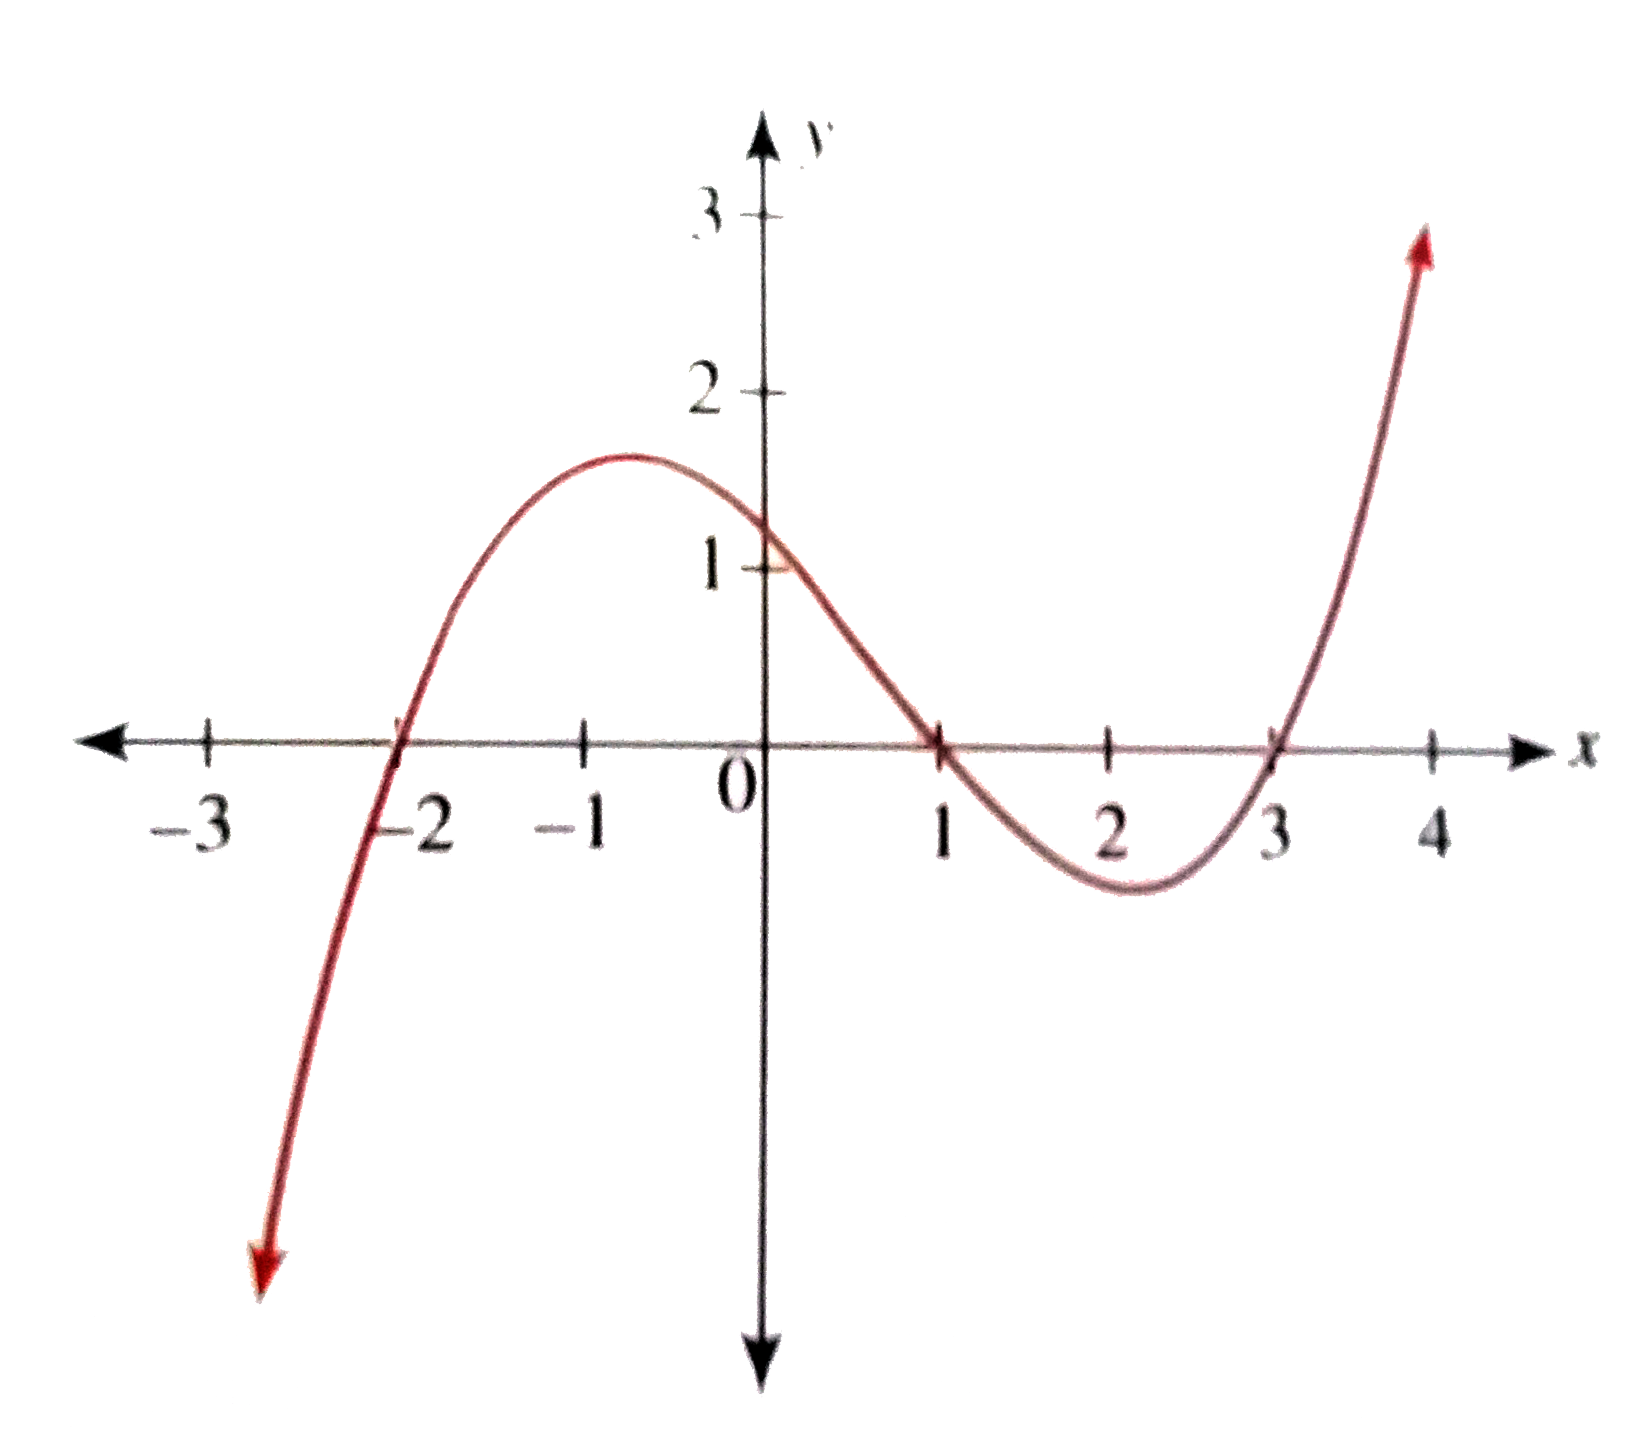
Then draw the graphs of
(i) |y|=sgn(f(x)) (ii) |y|=|f(x∣)|
(iii) y=xsgn(f(x))
Video Solution
Text Solution
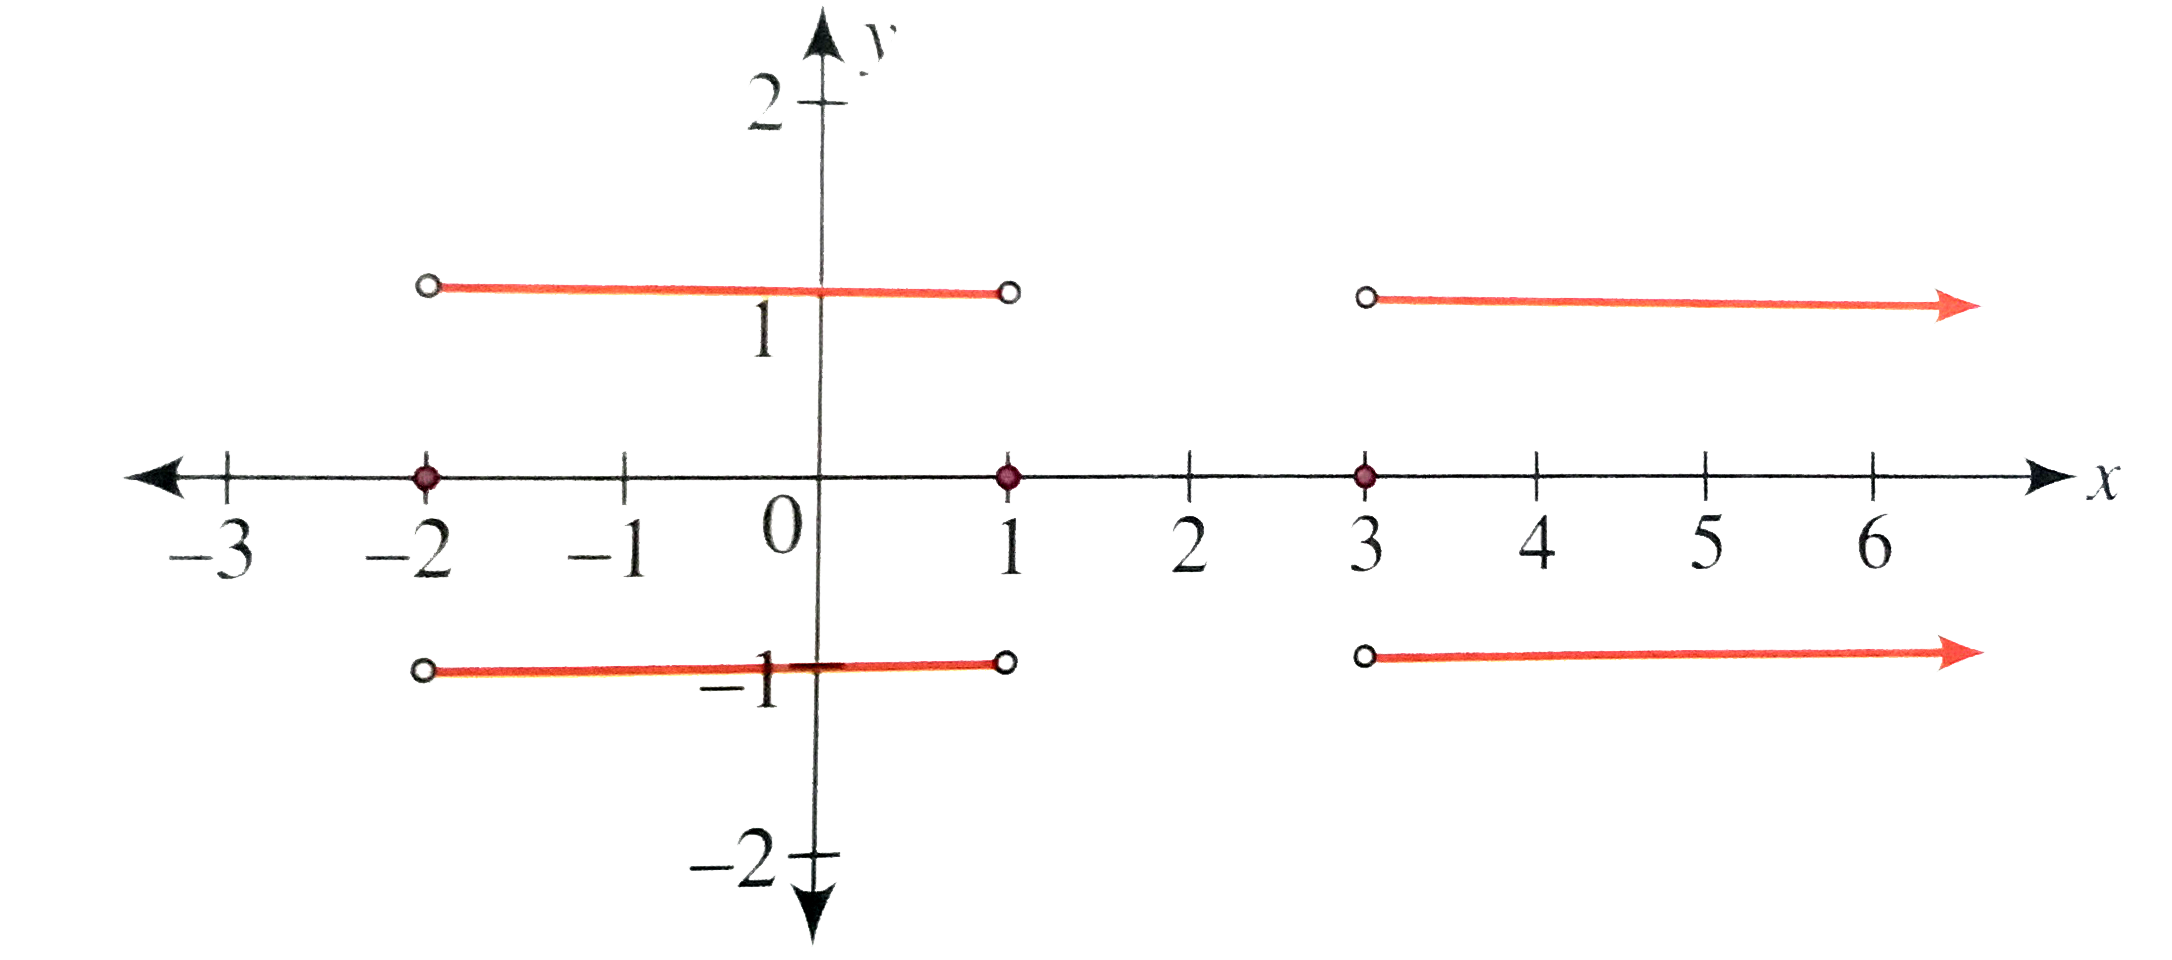
(i) |y|=sgn(f(x))
f(x)>0if−2<x<1andx>3⇒|y|=1
f(x)<0if1<x<3⇒|y|=−1(not possible)
At x=−2,1,3,f(x)=0⇒|y|=0
Hence the graph is as follows.
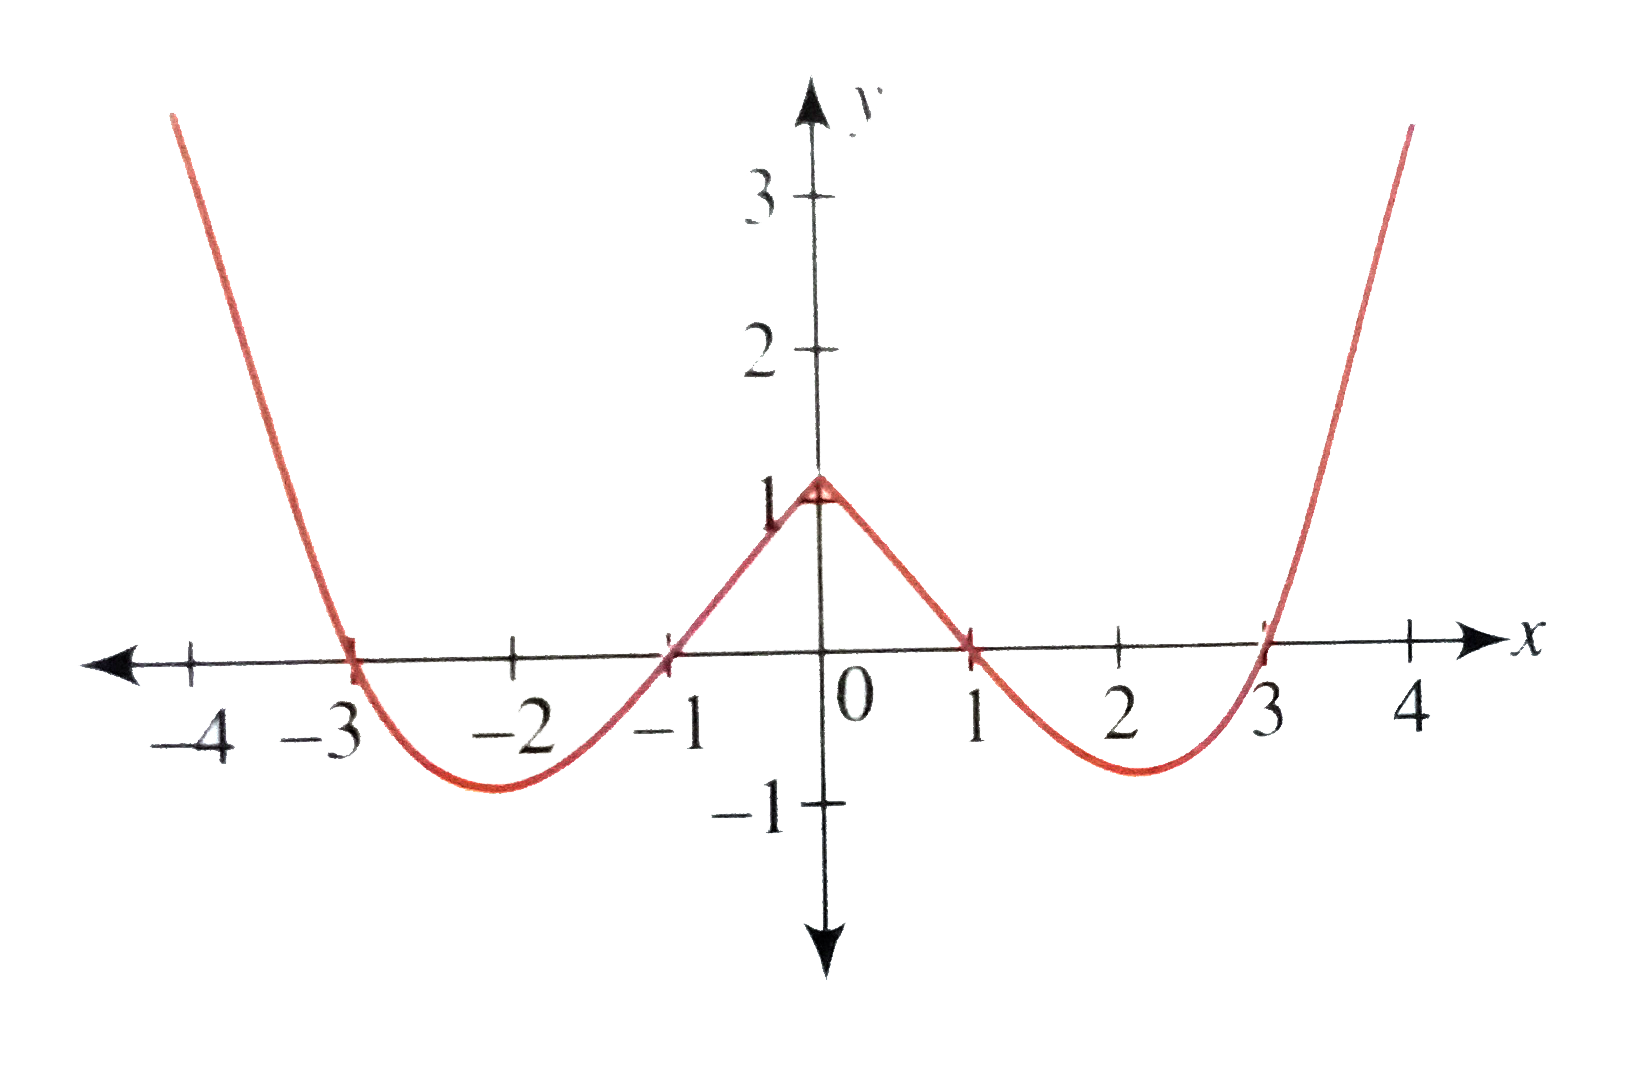
(ii) |y|=|f(|x|)|
Graph of y=f(|x|)
Graph of y=|f(|x|)|
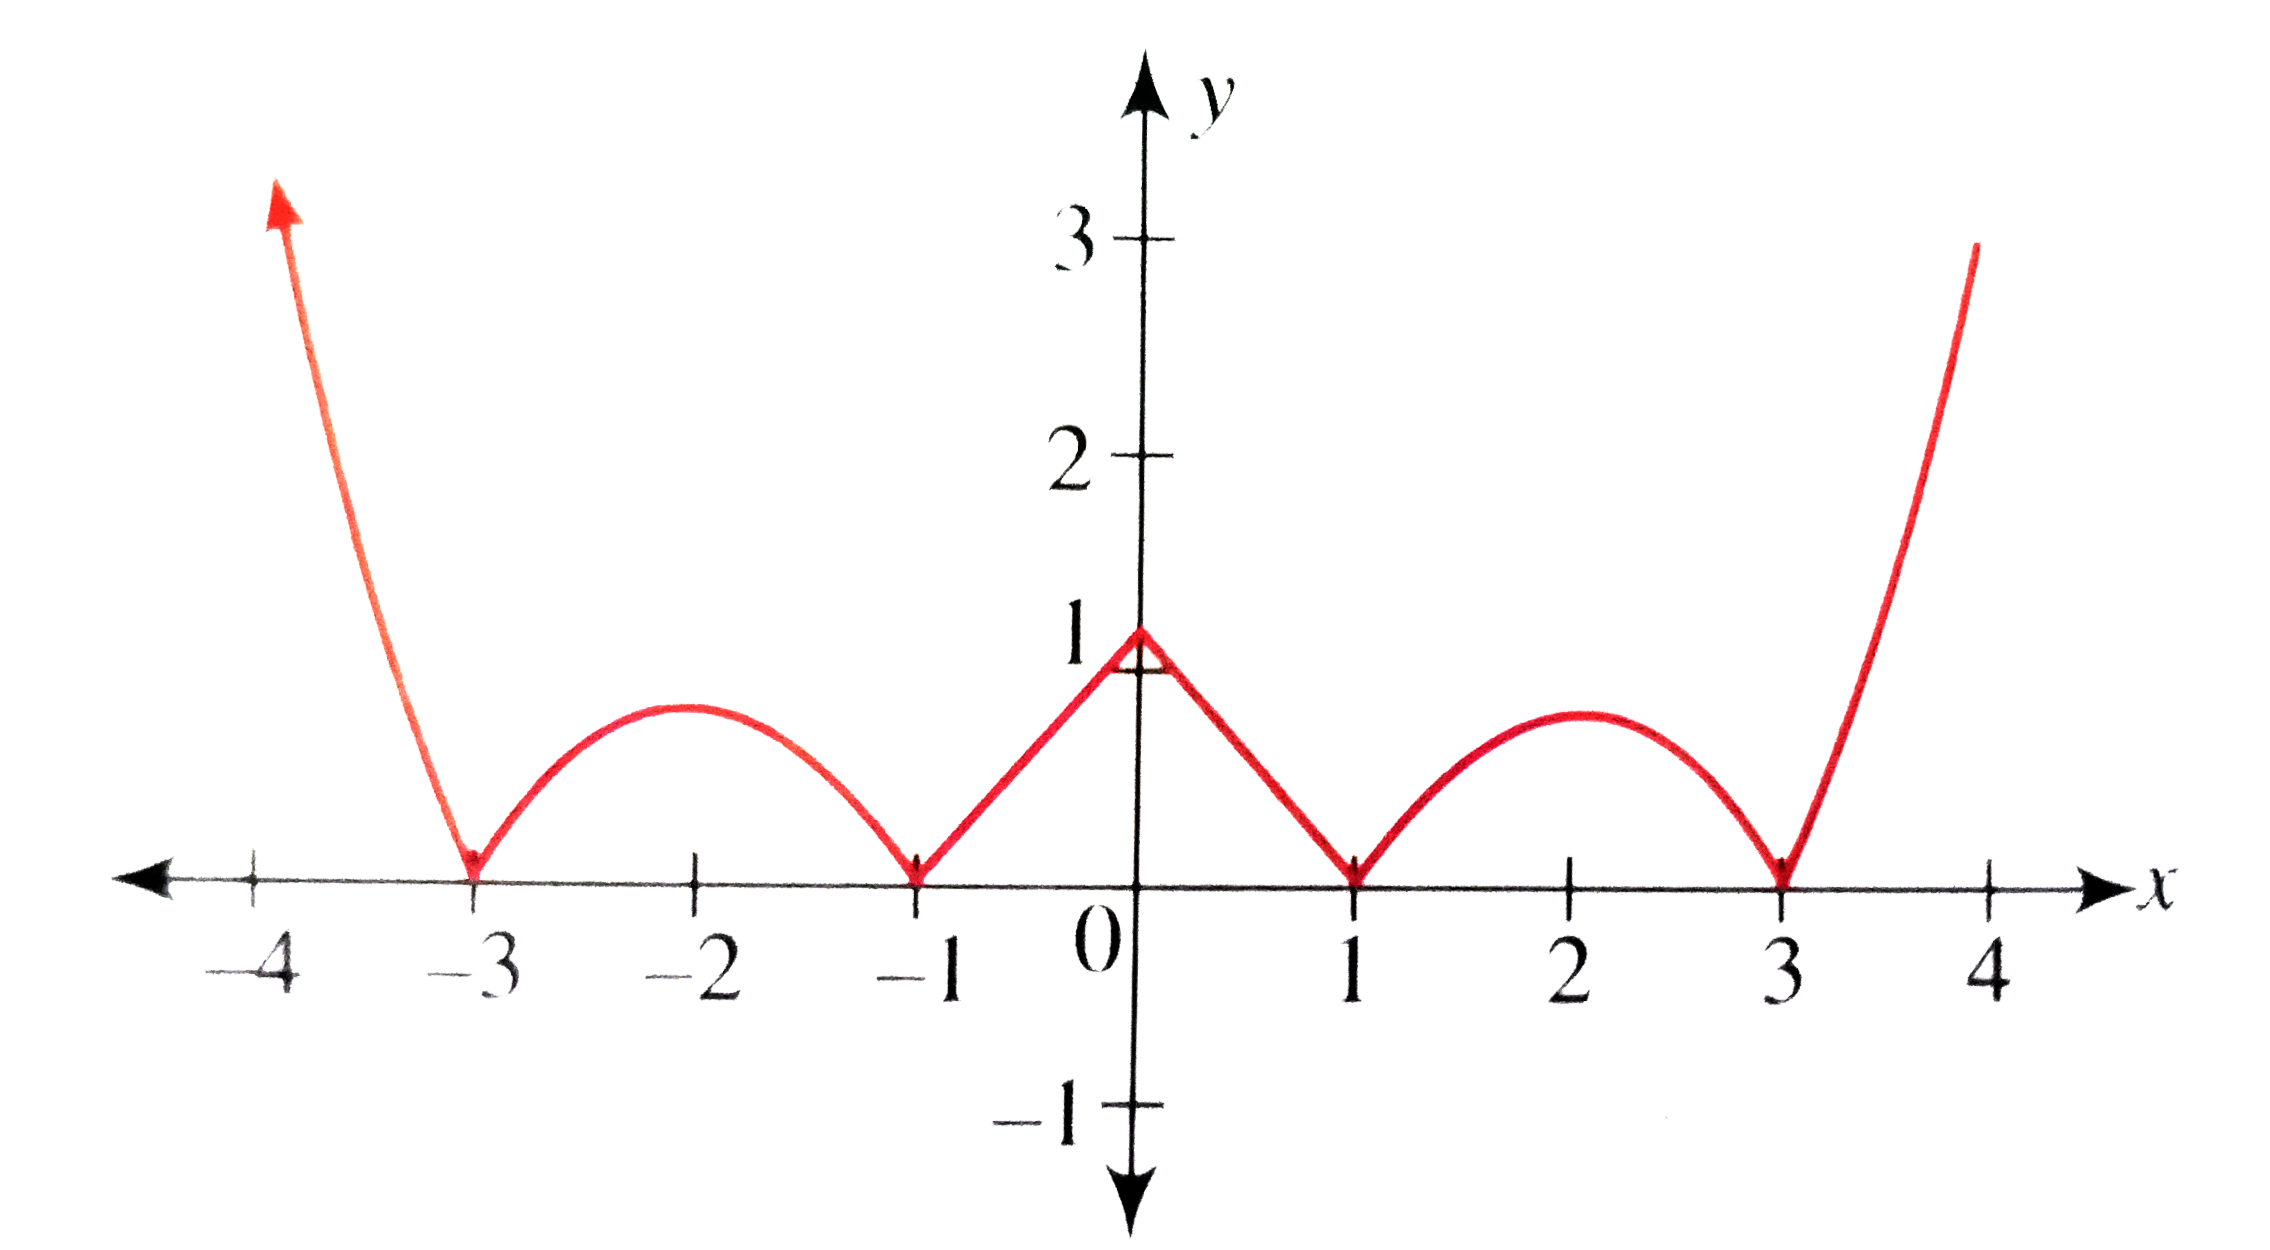
Graph of |y|=|f(|x|)|
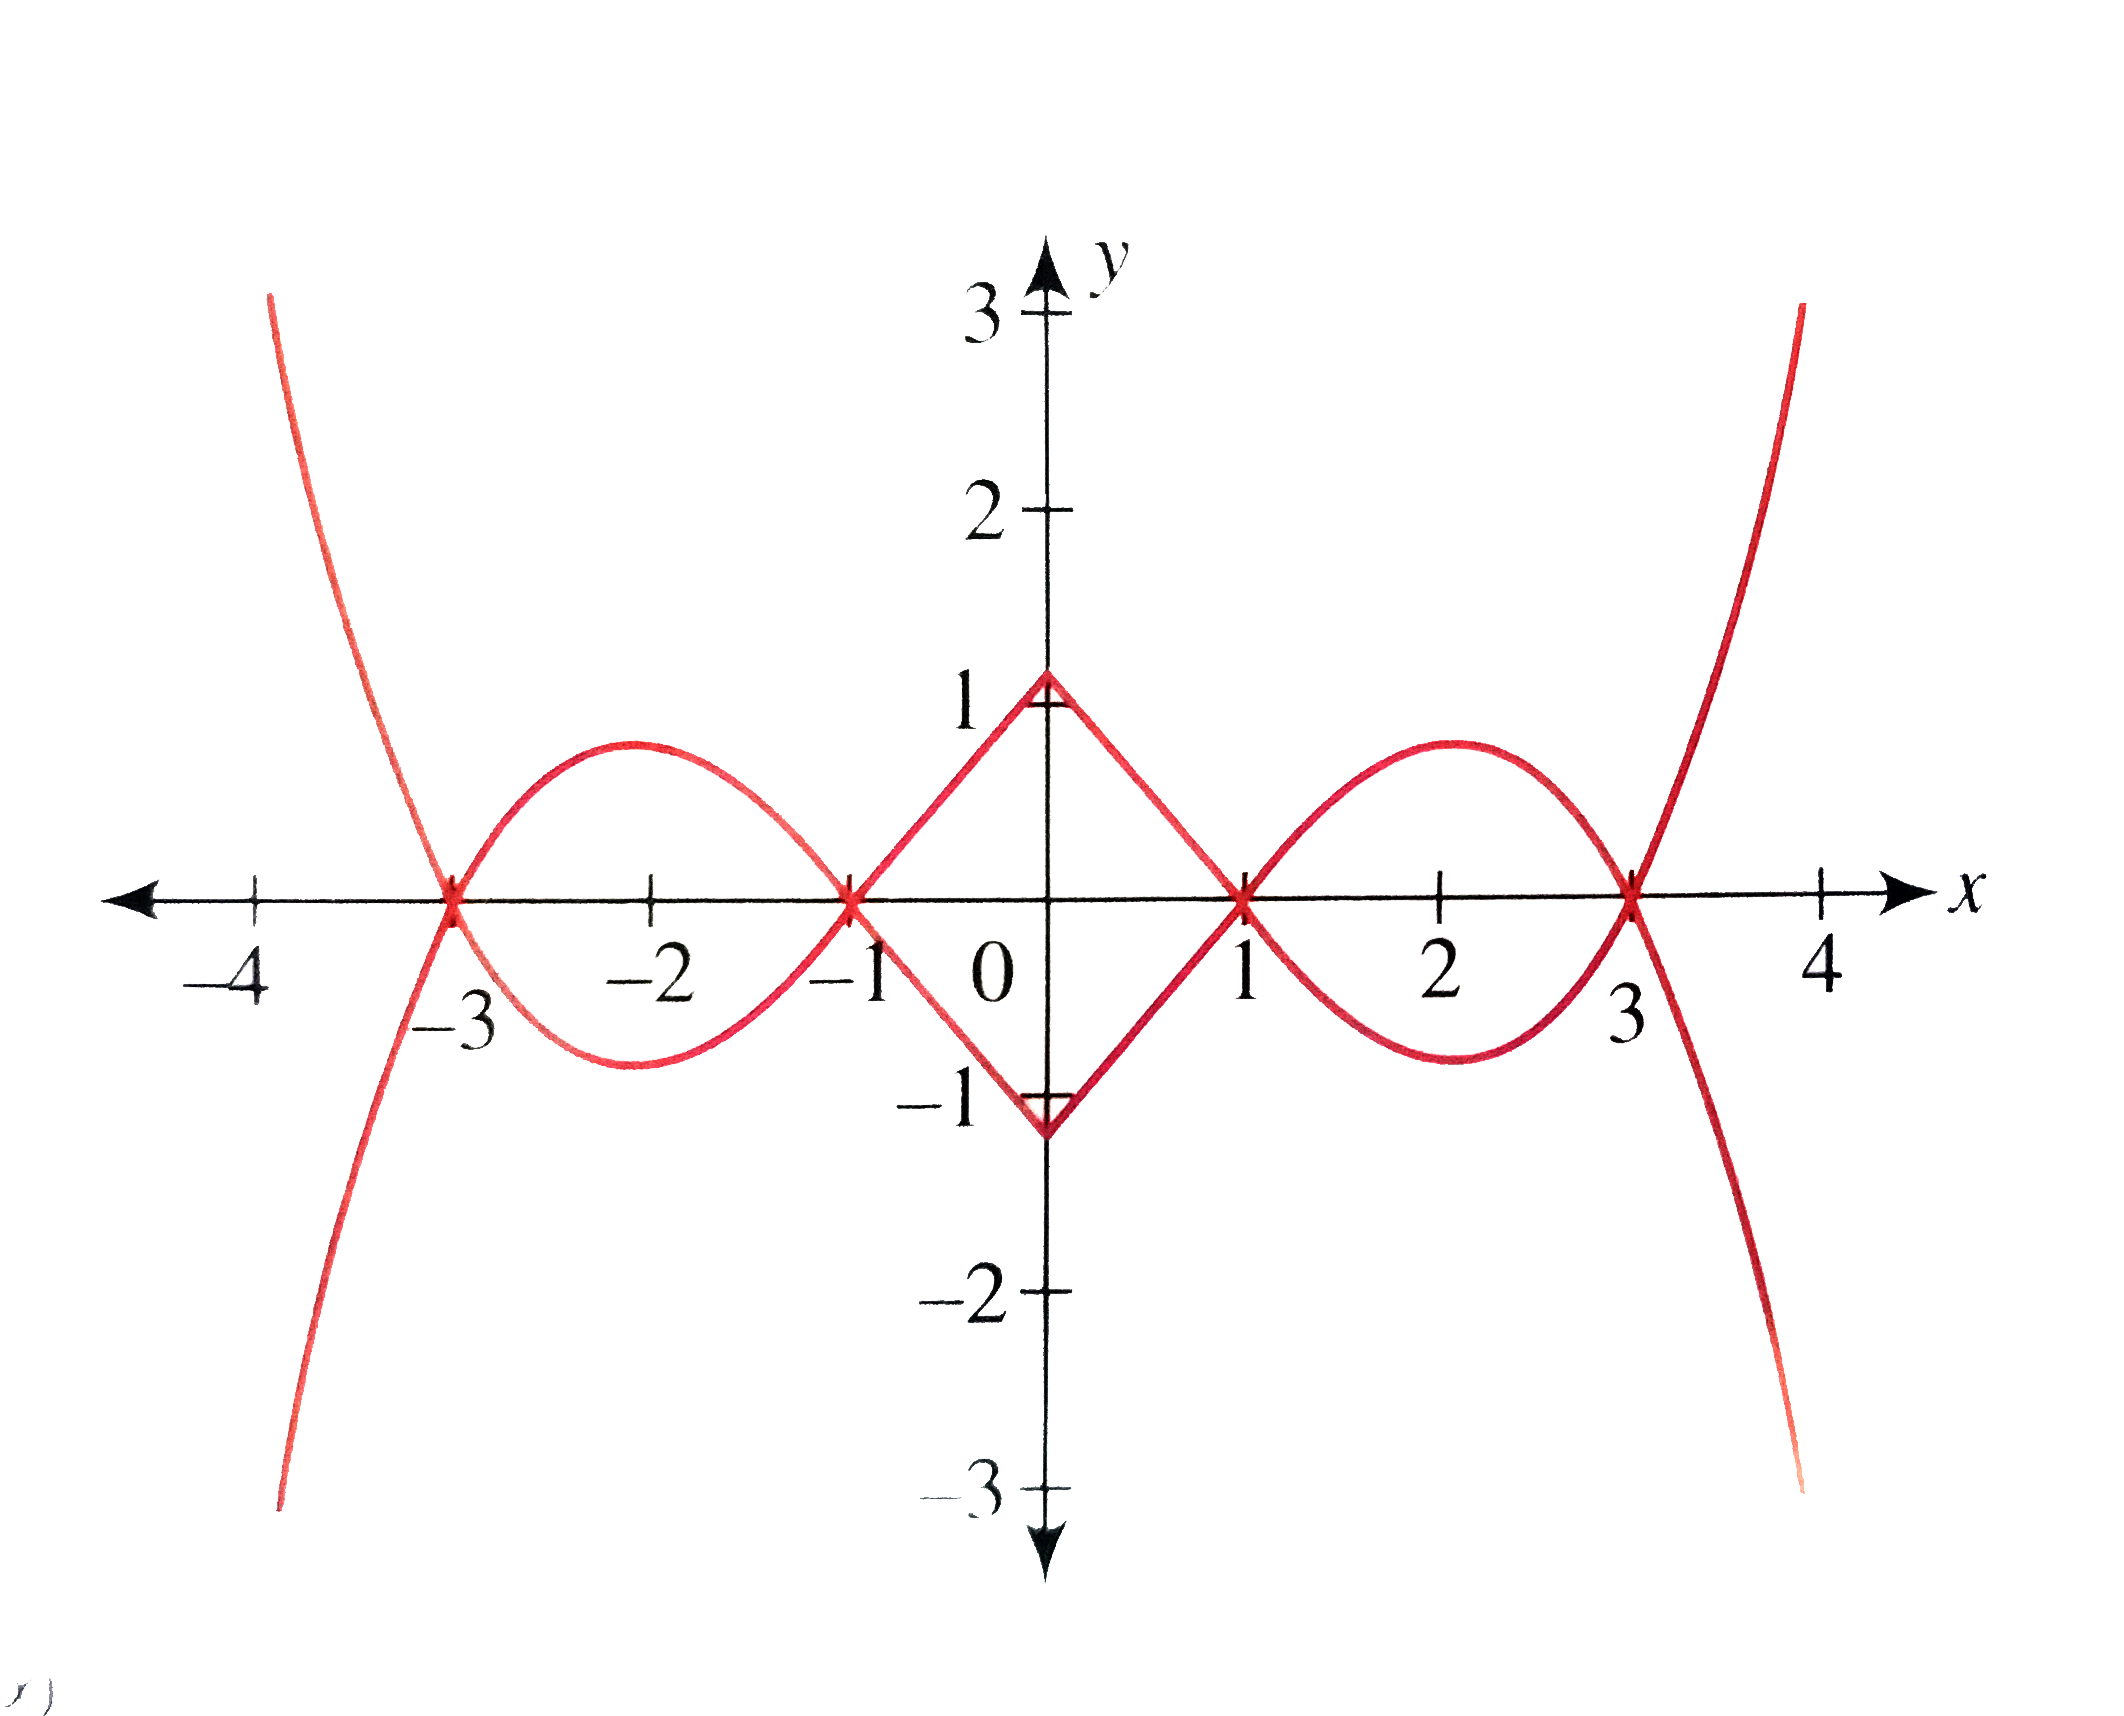
(iii) y=xsgnf(x) For f(x)>0,−2<x<1orx>3⇒y=x
For f(x)<0,1<x<3⇒y=1x
For x=1,3,sgn(x)⇒y=1
Hence the graph of the function is as shown in the following figure.
|
Topper's Solved these Questions
Similar Questions
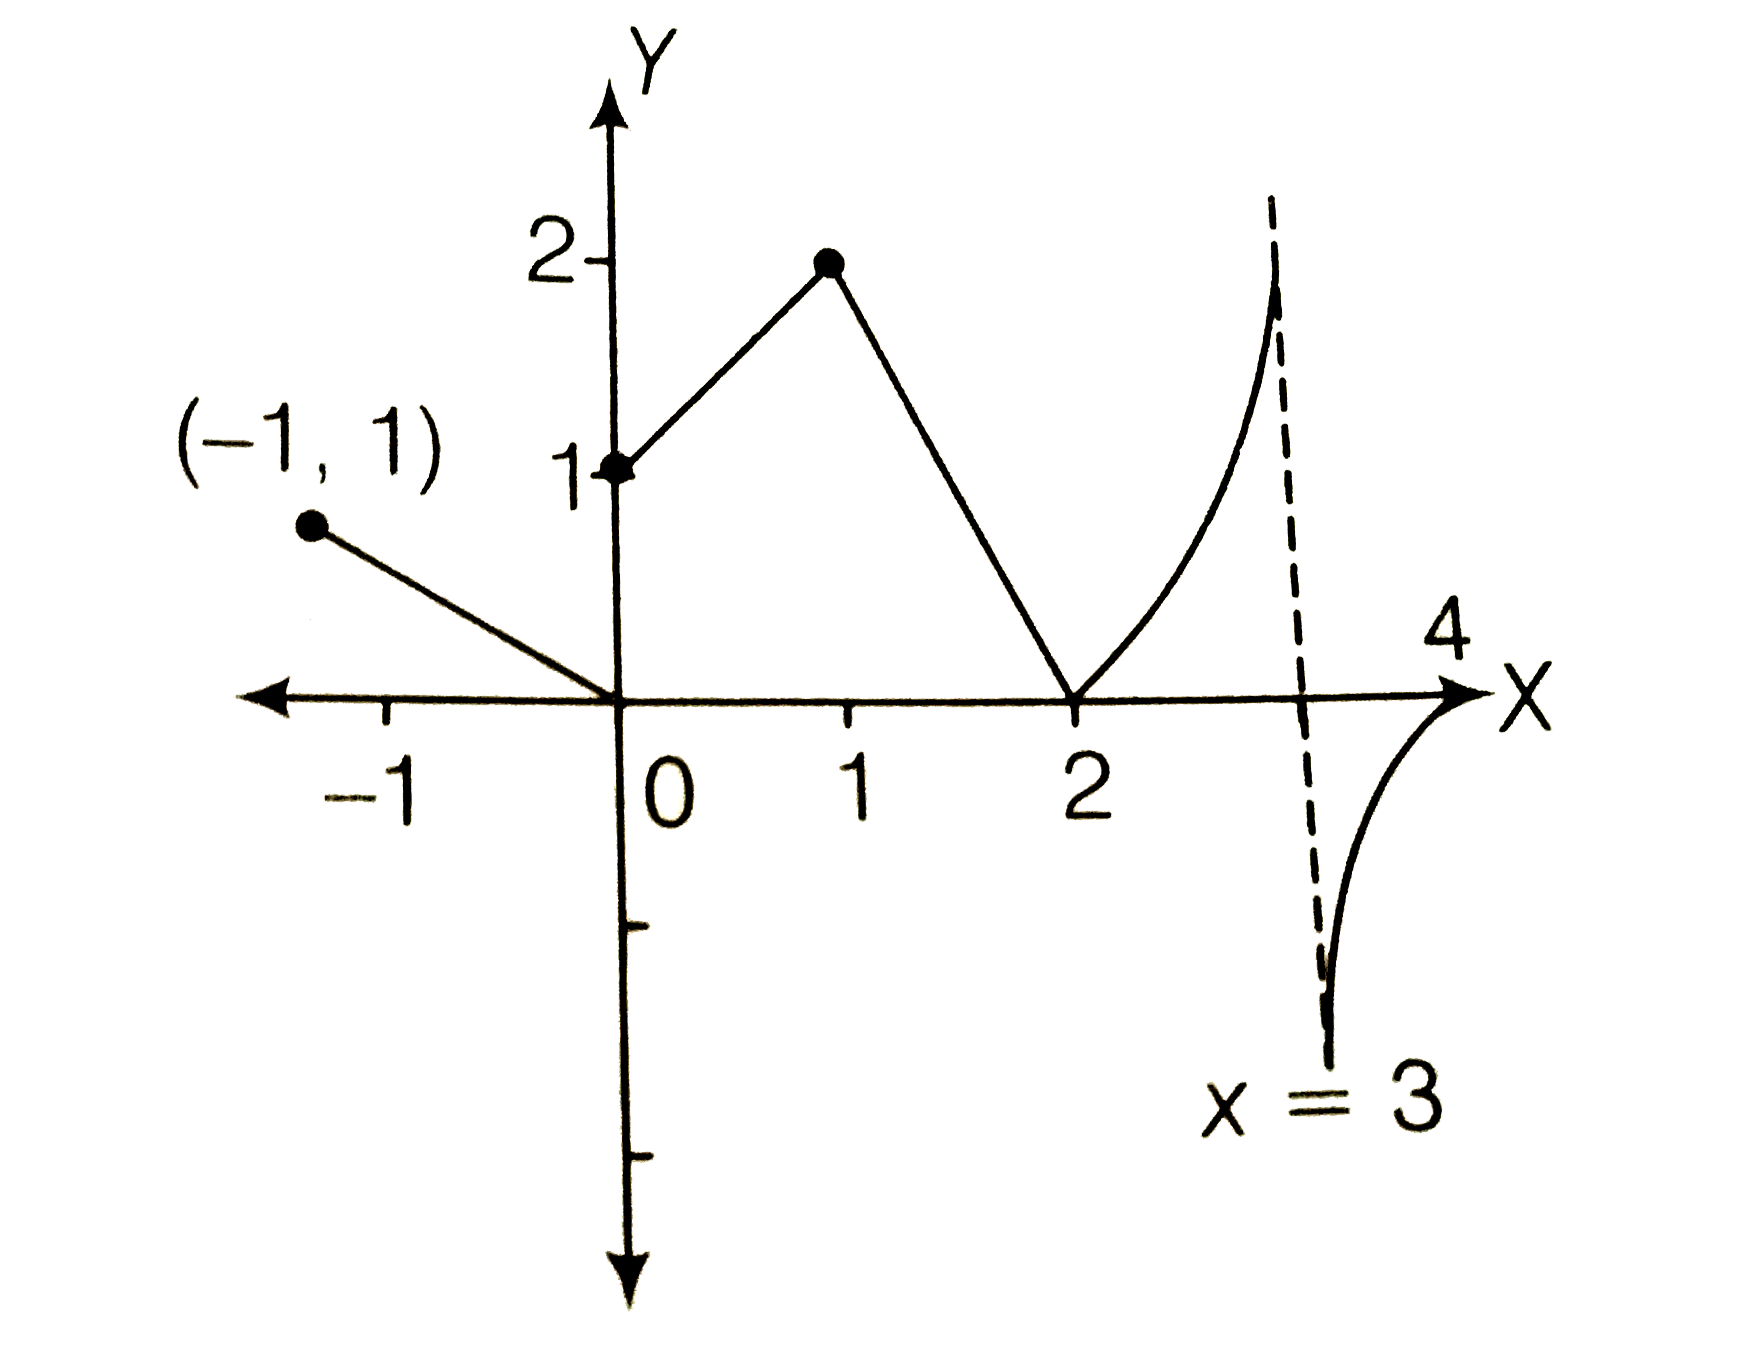
The graph of the function y=f(x) is shown in the adjacent figure then correct statement is
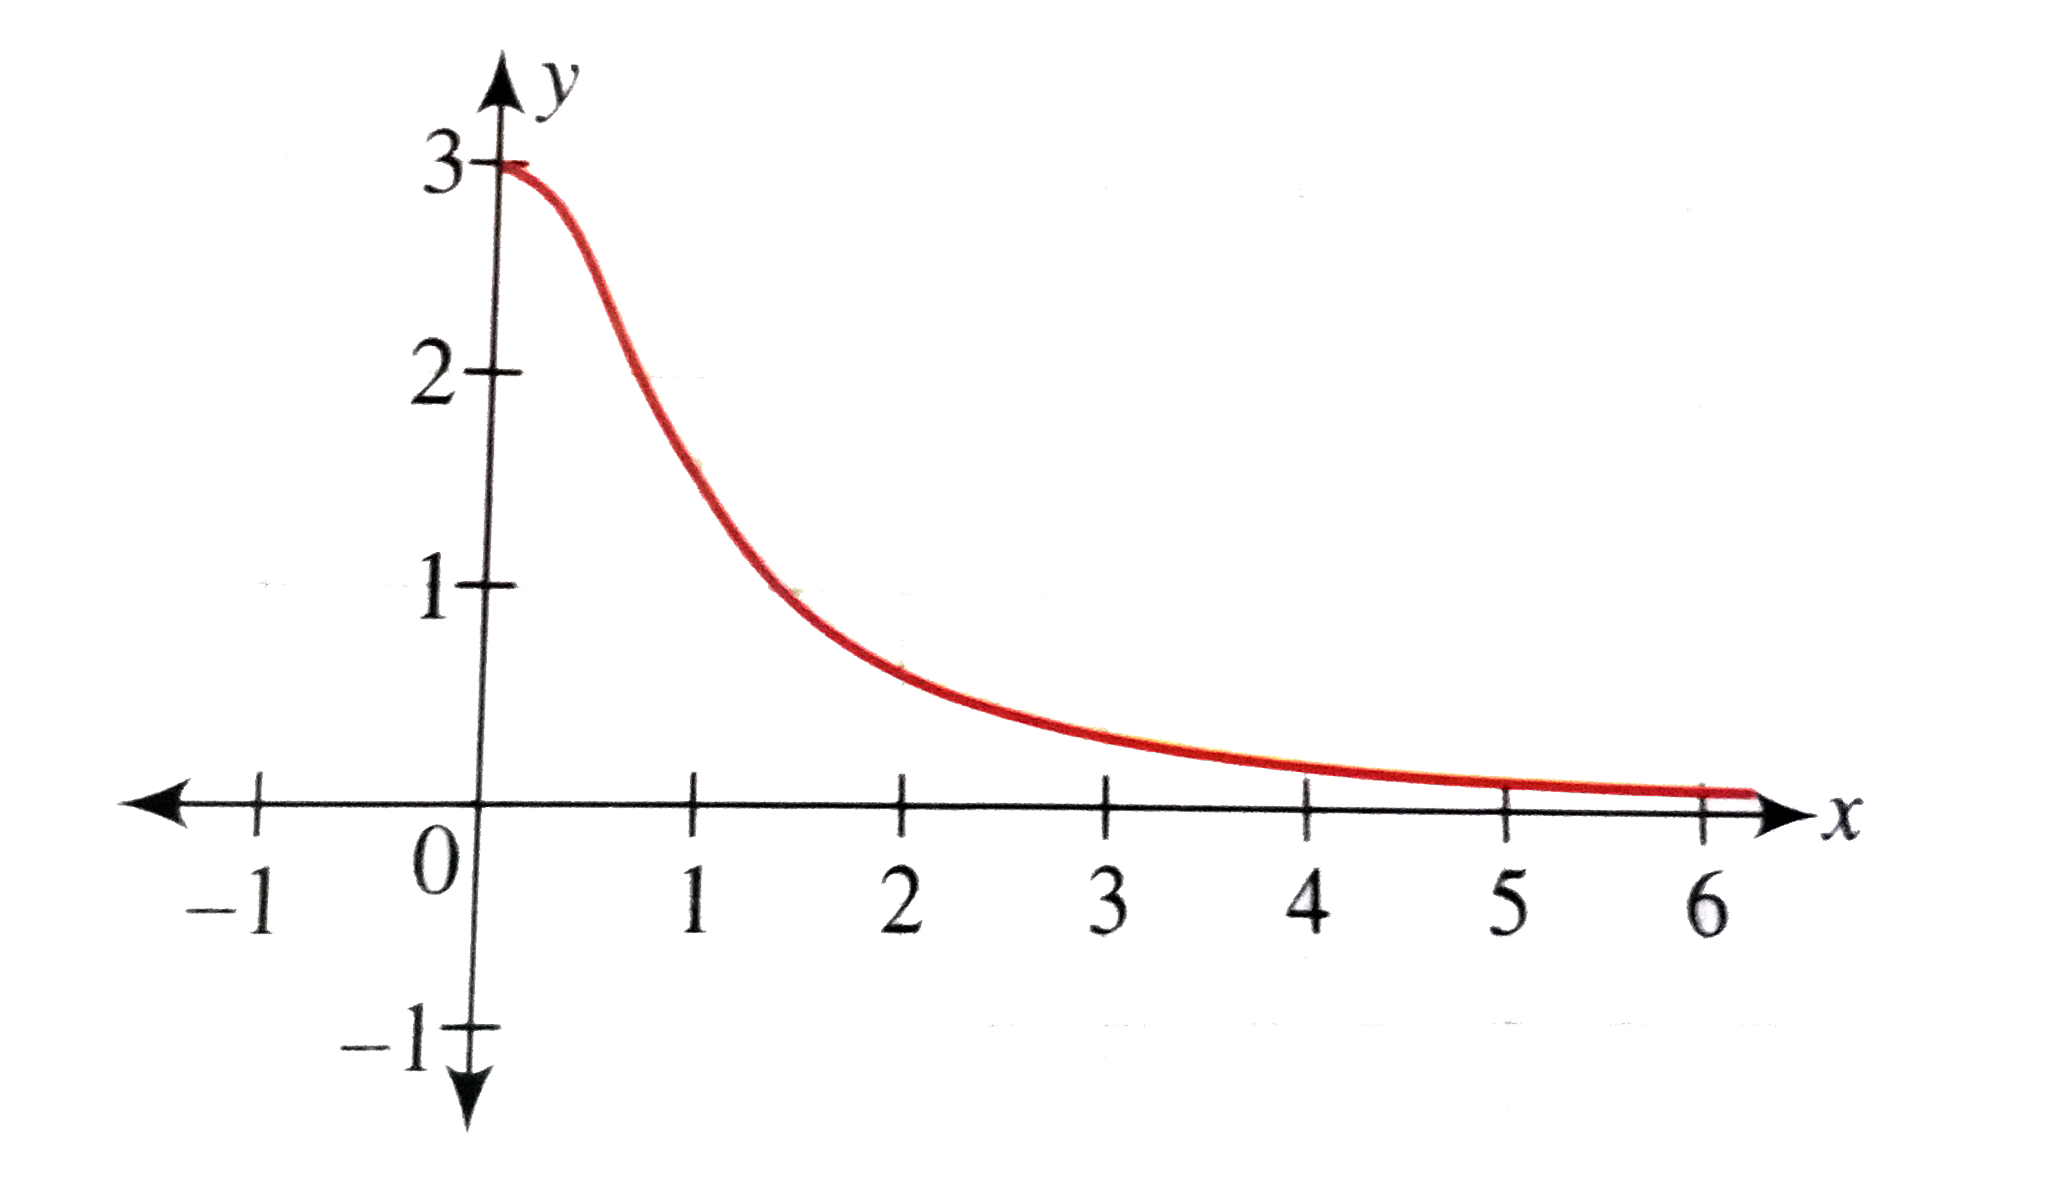
View SolutionThe graph of y=f(x) is as shown in the following figure. Draw the graph of y=[f(x)].
View SolutionDraw the graph of the function f(x)=−x|x|.
View SolutionDraw the graph of f(x)=sgn(x3−x).
View SolutionIf the graph of y=|f(x)| is as shown in figure
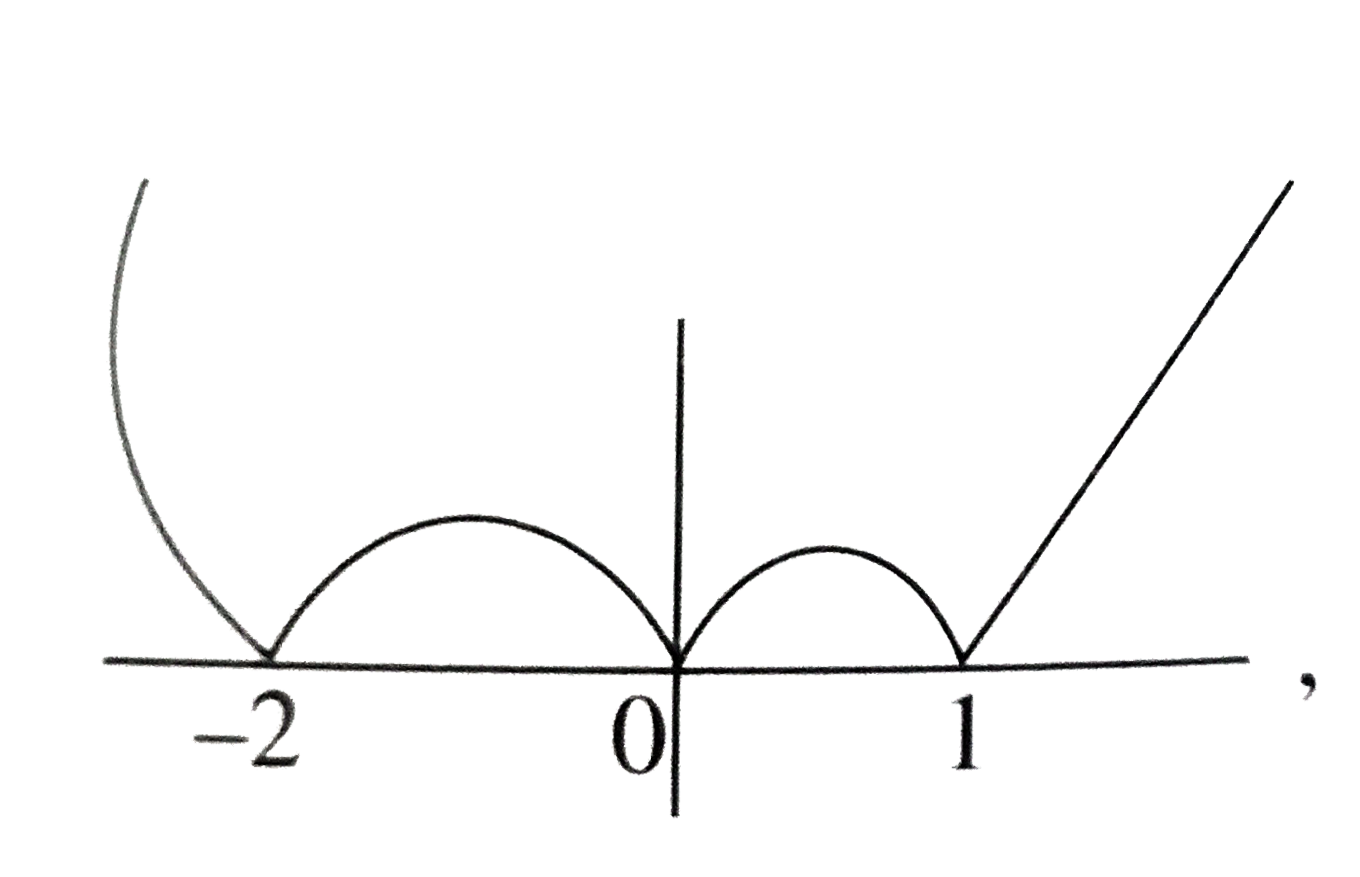 then the graph of y=f(x) may be
View SolutionDraw the graph of f(x)=sgn(logex).
View SolutionDraw the graph of f(x)=sgn(log0.5x).
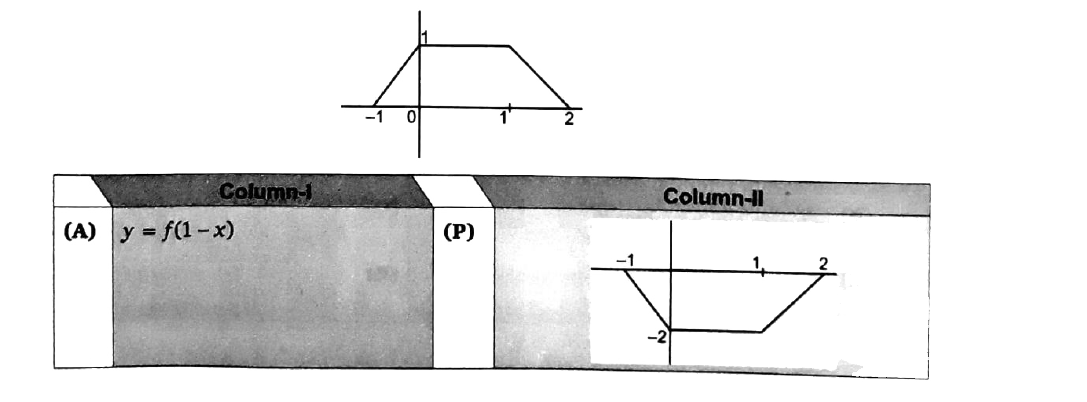
View SolutionGiven the graph of y=f(x)
View SolutionIf the graph of the function y=f(x) is as shown :
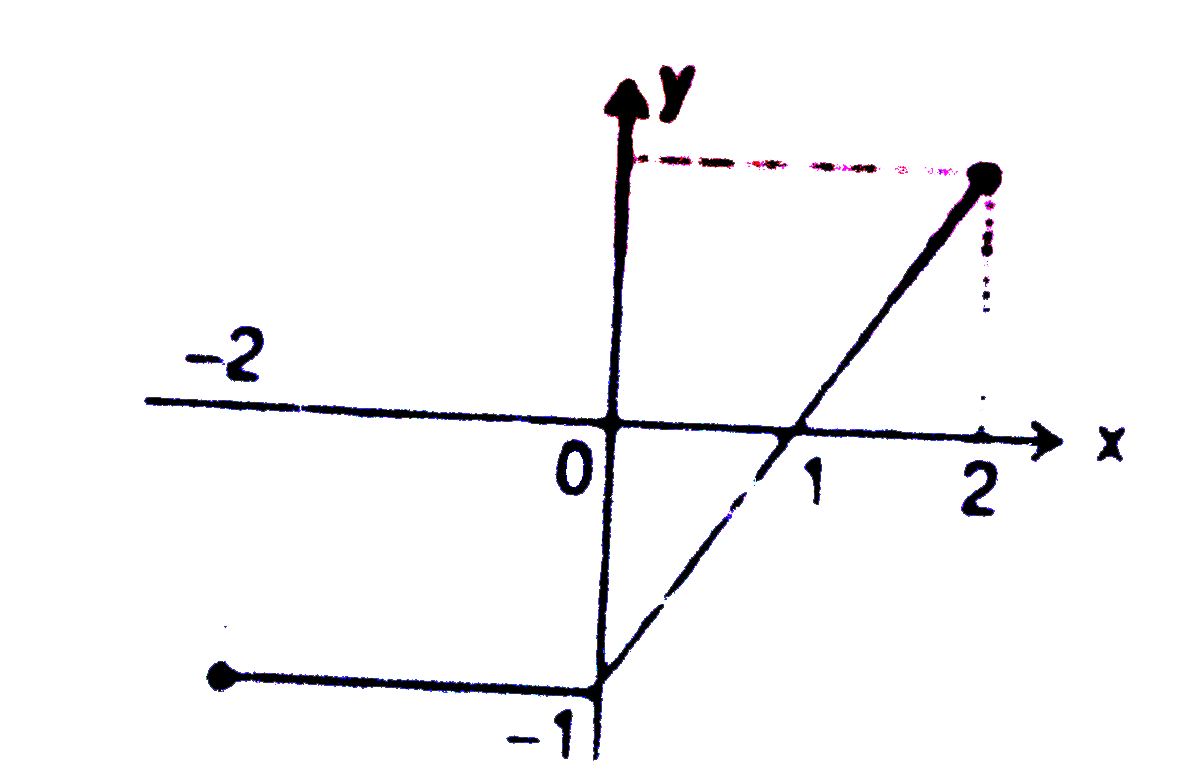
the graph of y=12(|f(x)|−f(x)) is
View SolutionThe graph of the function y=f(x) is shown.
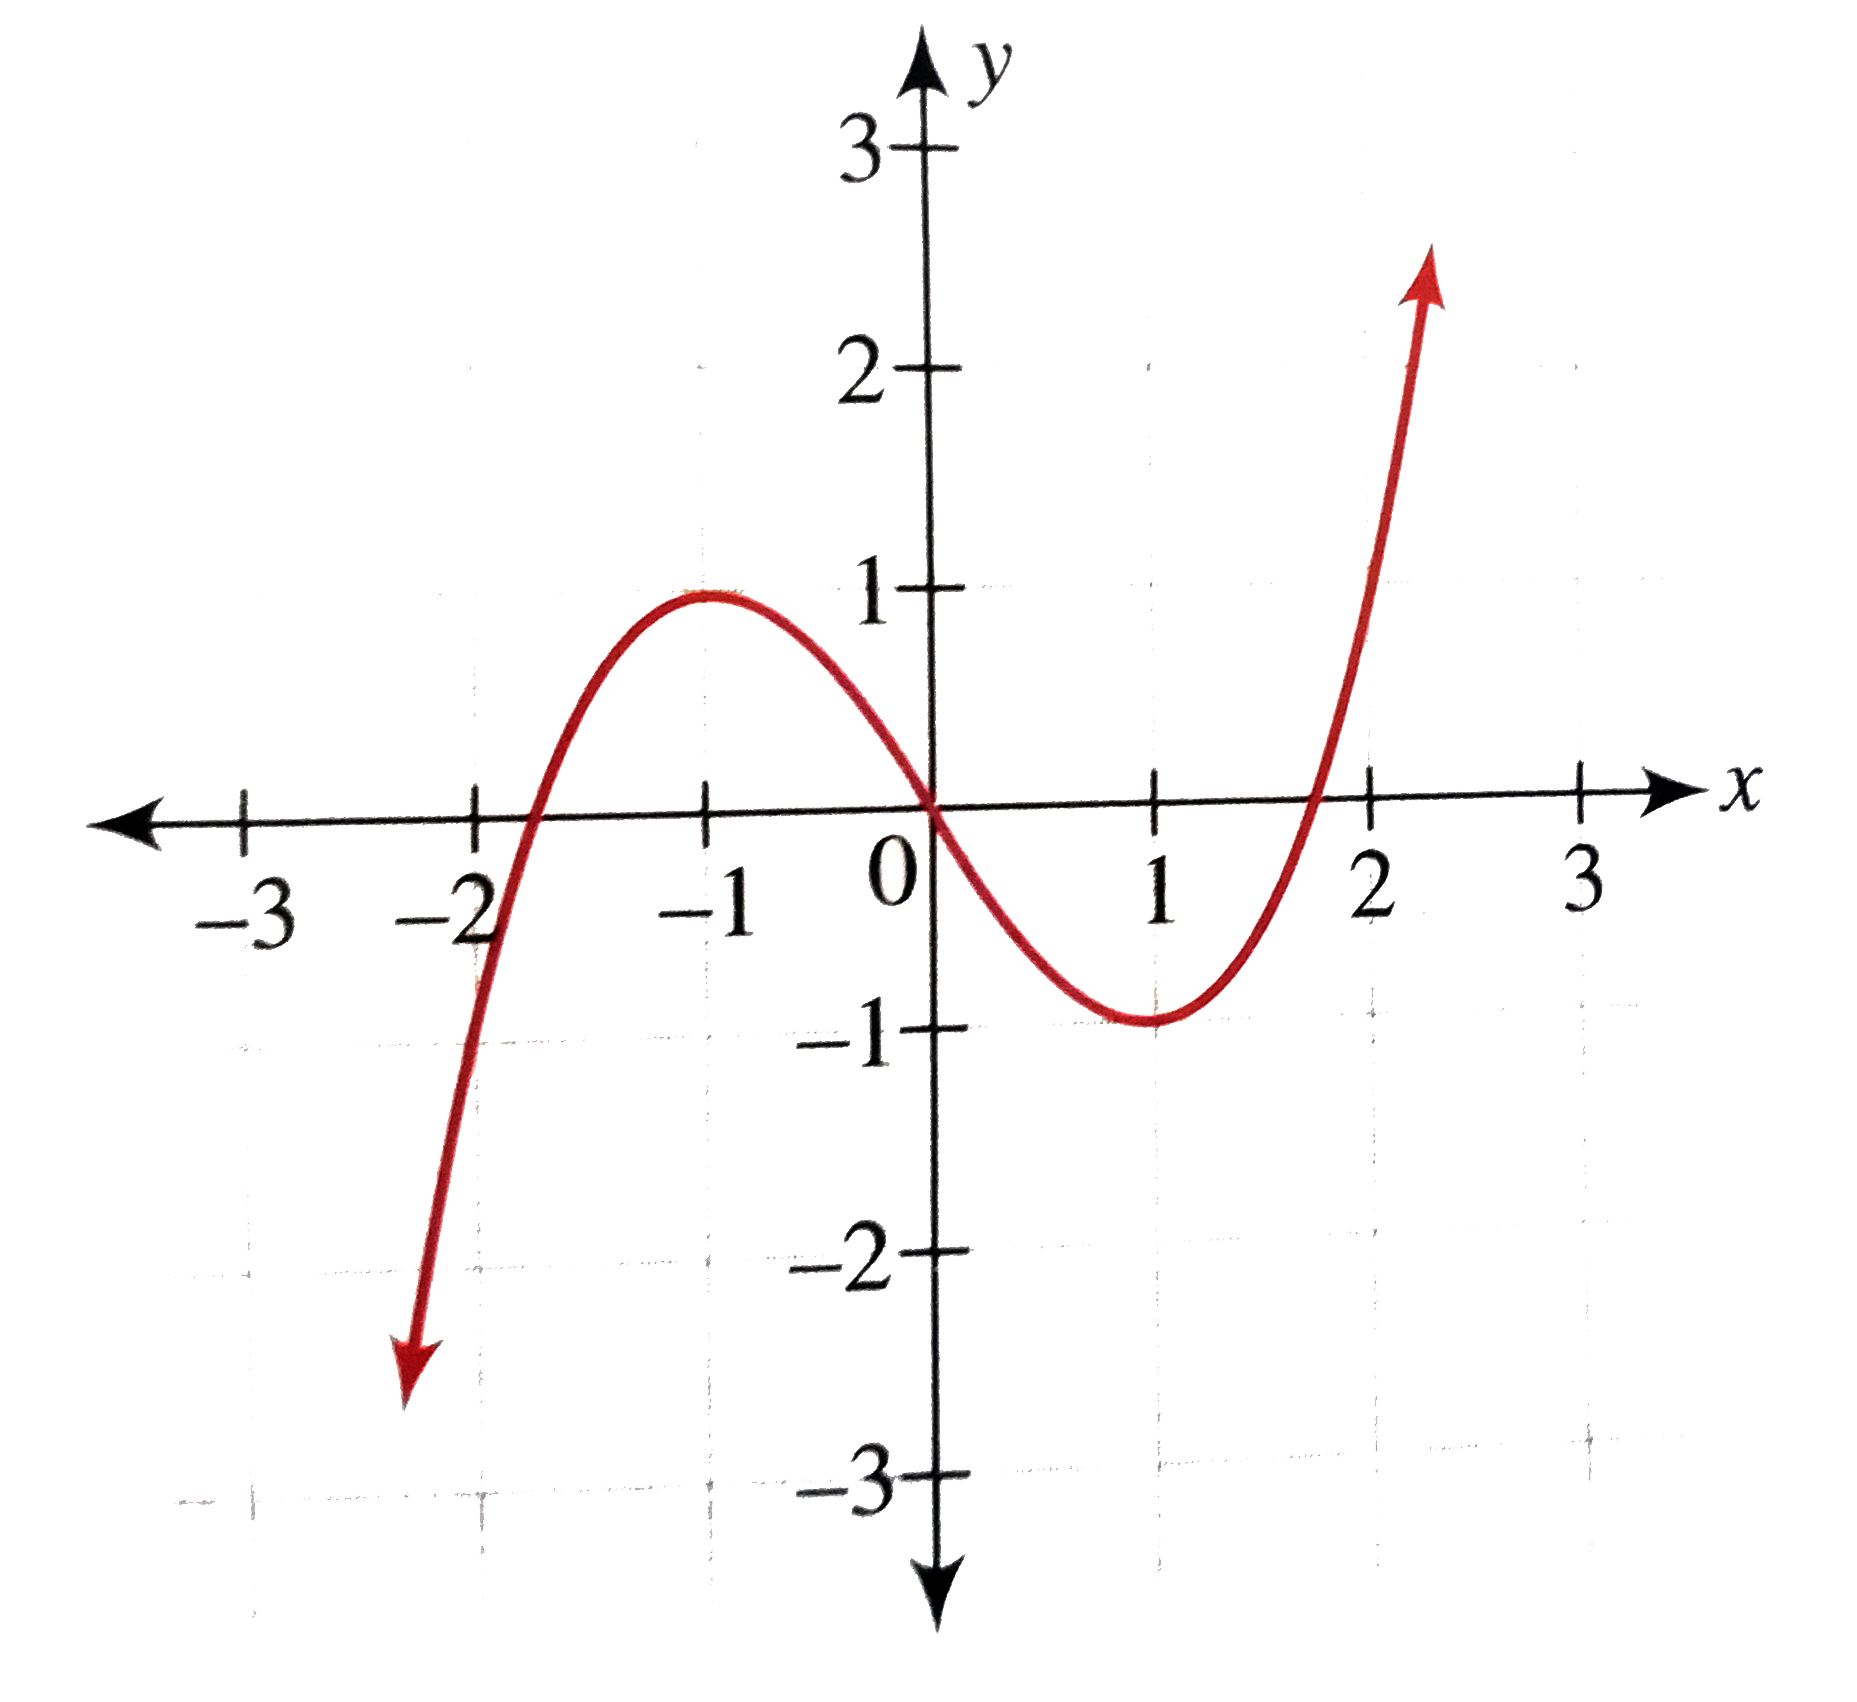
Find the number of solutions to the equation ||f(x)|−1|=12.
View Solution