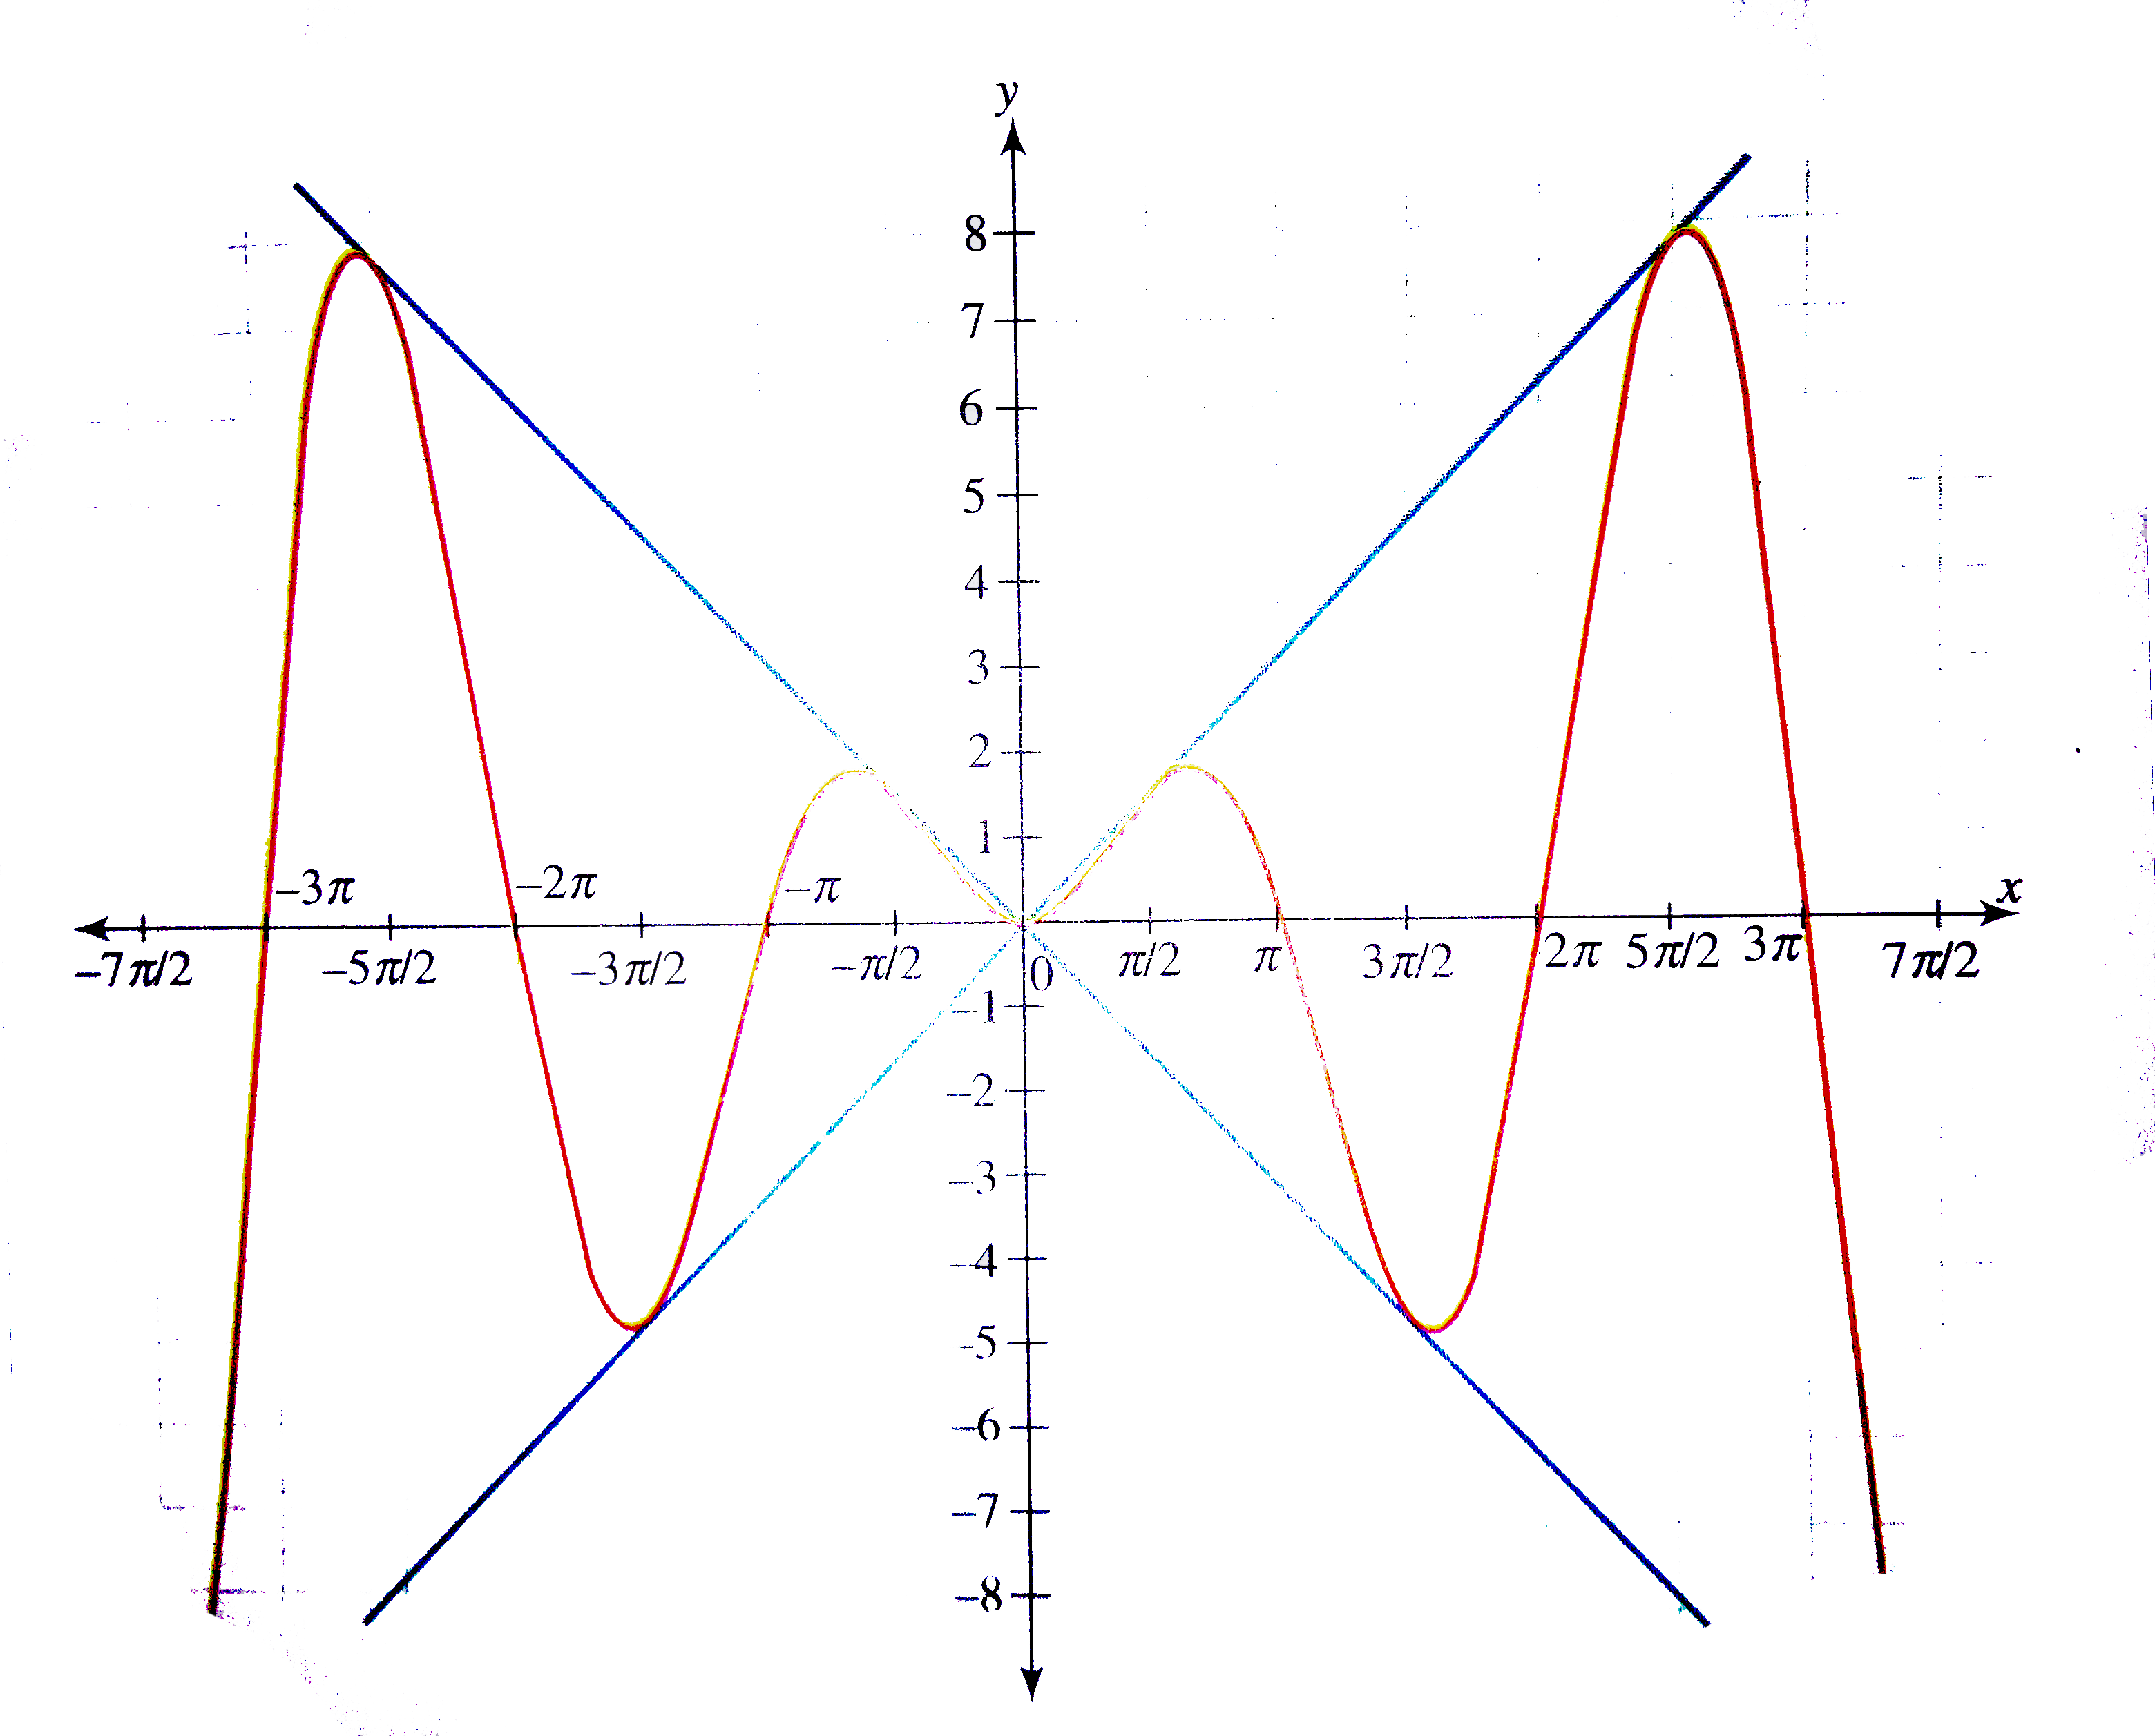
Draw the graph of y=xsinx.
Video Solution
Text Solution
We have y = f(x) = x sin x.
First draw the graph of y=±x.
Now consider the values of f(x) for quadrant angles.
f(0) = 0
f(π/2)=π/2
f(π)=0
f(3π/2)=−3π/2
f(2π)=0
f(5π/2)=5π/2 etc.
Points (π/2,π/2),(5π/2,5π/2),... lie on the graph of y = x.
Points (3π/2,3π/2),(7π/2,7π/2),... lie on the graph of y = -x.
Further f(x) = f(-x), hence the function is even and the graph is symmetrical about the y-axis.
From the above discussion, the graph of the function is as shown in the following figure.

|
Updated on:21/07/2023
Topper's Solved these Questions
- BOOK - CENGAGE ENGLISHCHAPTER - GRAPHS OF TRIGONOMETRIC FUNCTIONSEXERCISE - Exercises22videos
GRAPHS OF TRIGONOMETRIC FUNCTIONS
- BOOK - CENGAGE ENGLISHCHAPTER - GRAPHS OF ELEMENTARY FUNCTIONS EXERCISE - EXERCISES34videos
GRAPHS OF ELEMENTARY FUNCTIONS
- BOOK - CENGAGE ENGLISHCHAPTER - HIGHT AND DISTANCE EXERCISE - Archives3videos
HIGHT AND DISTANCE
Similar Questions
Draw the graph of y=exsin2πx.
View SolutionDraw the graph of y=|x|
View SolutionDraw the graph of y=2x.
View SolutionDraw the graph of y=sin2x.
View SolutionDraw the graph of y=3sin2x
View SolutionDraw the graph of y=x−sinx
View SolutionDraw the graph of y=sinxx.
View SolutionDraw the graph of y=sinx+cosx,x∈[0,2π].
View SolutionDraw the graph of y=[sinx],x∈[0,2π], where [⋅] represents the greatest integer function.
View SolutionDraw the graph of [y]=sinx,x∈[0,2π] where [⋅] denotes the greatest integer function
View Solution

