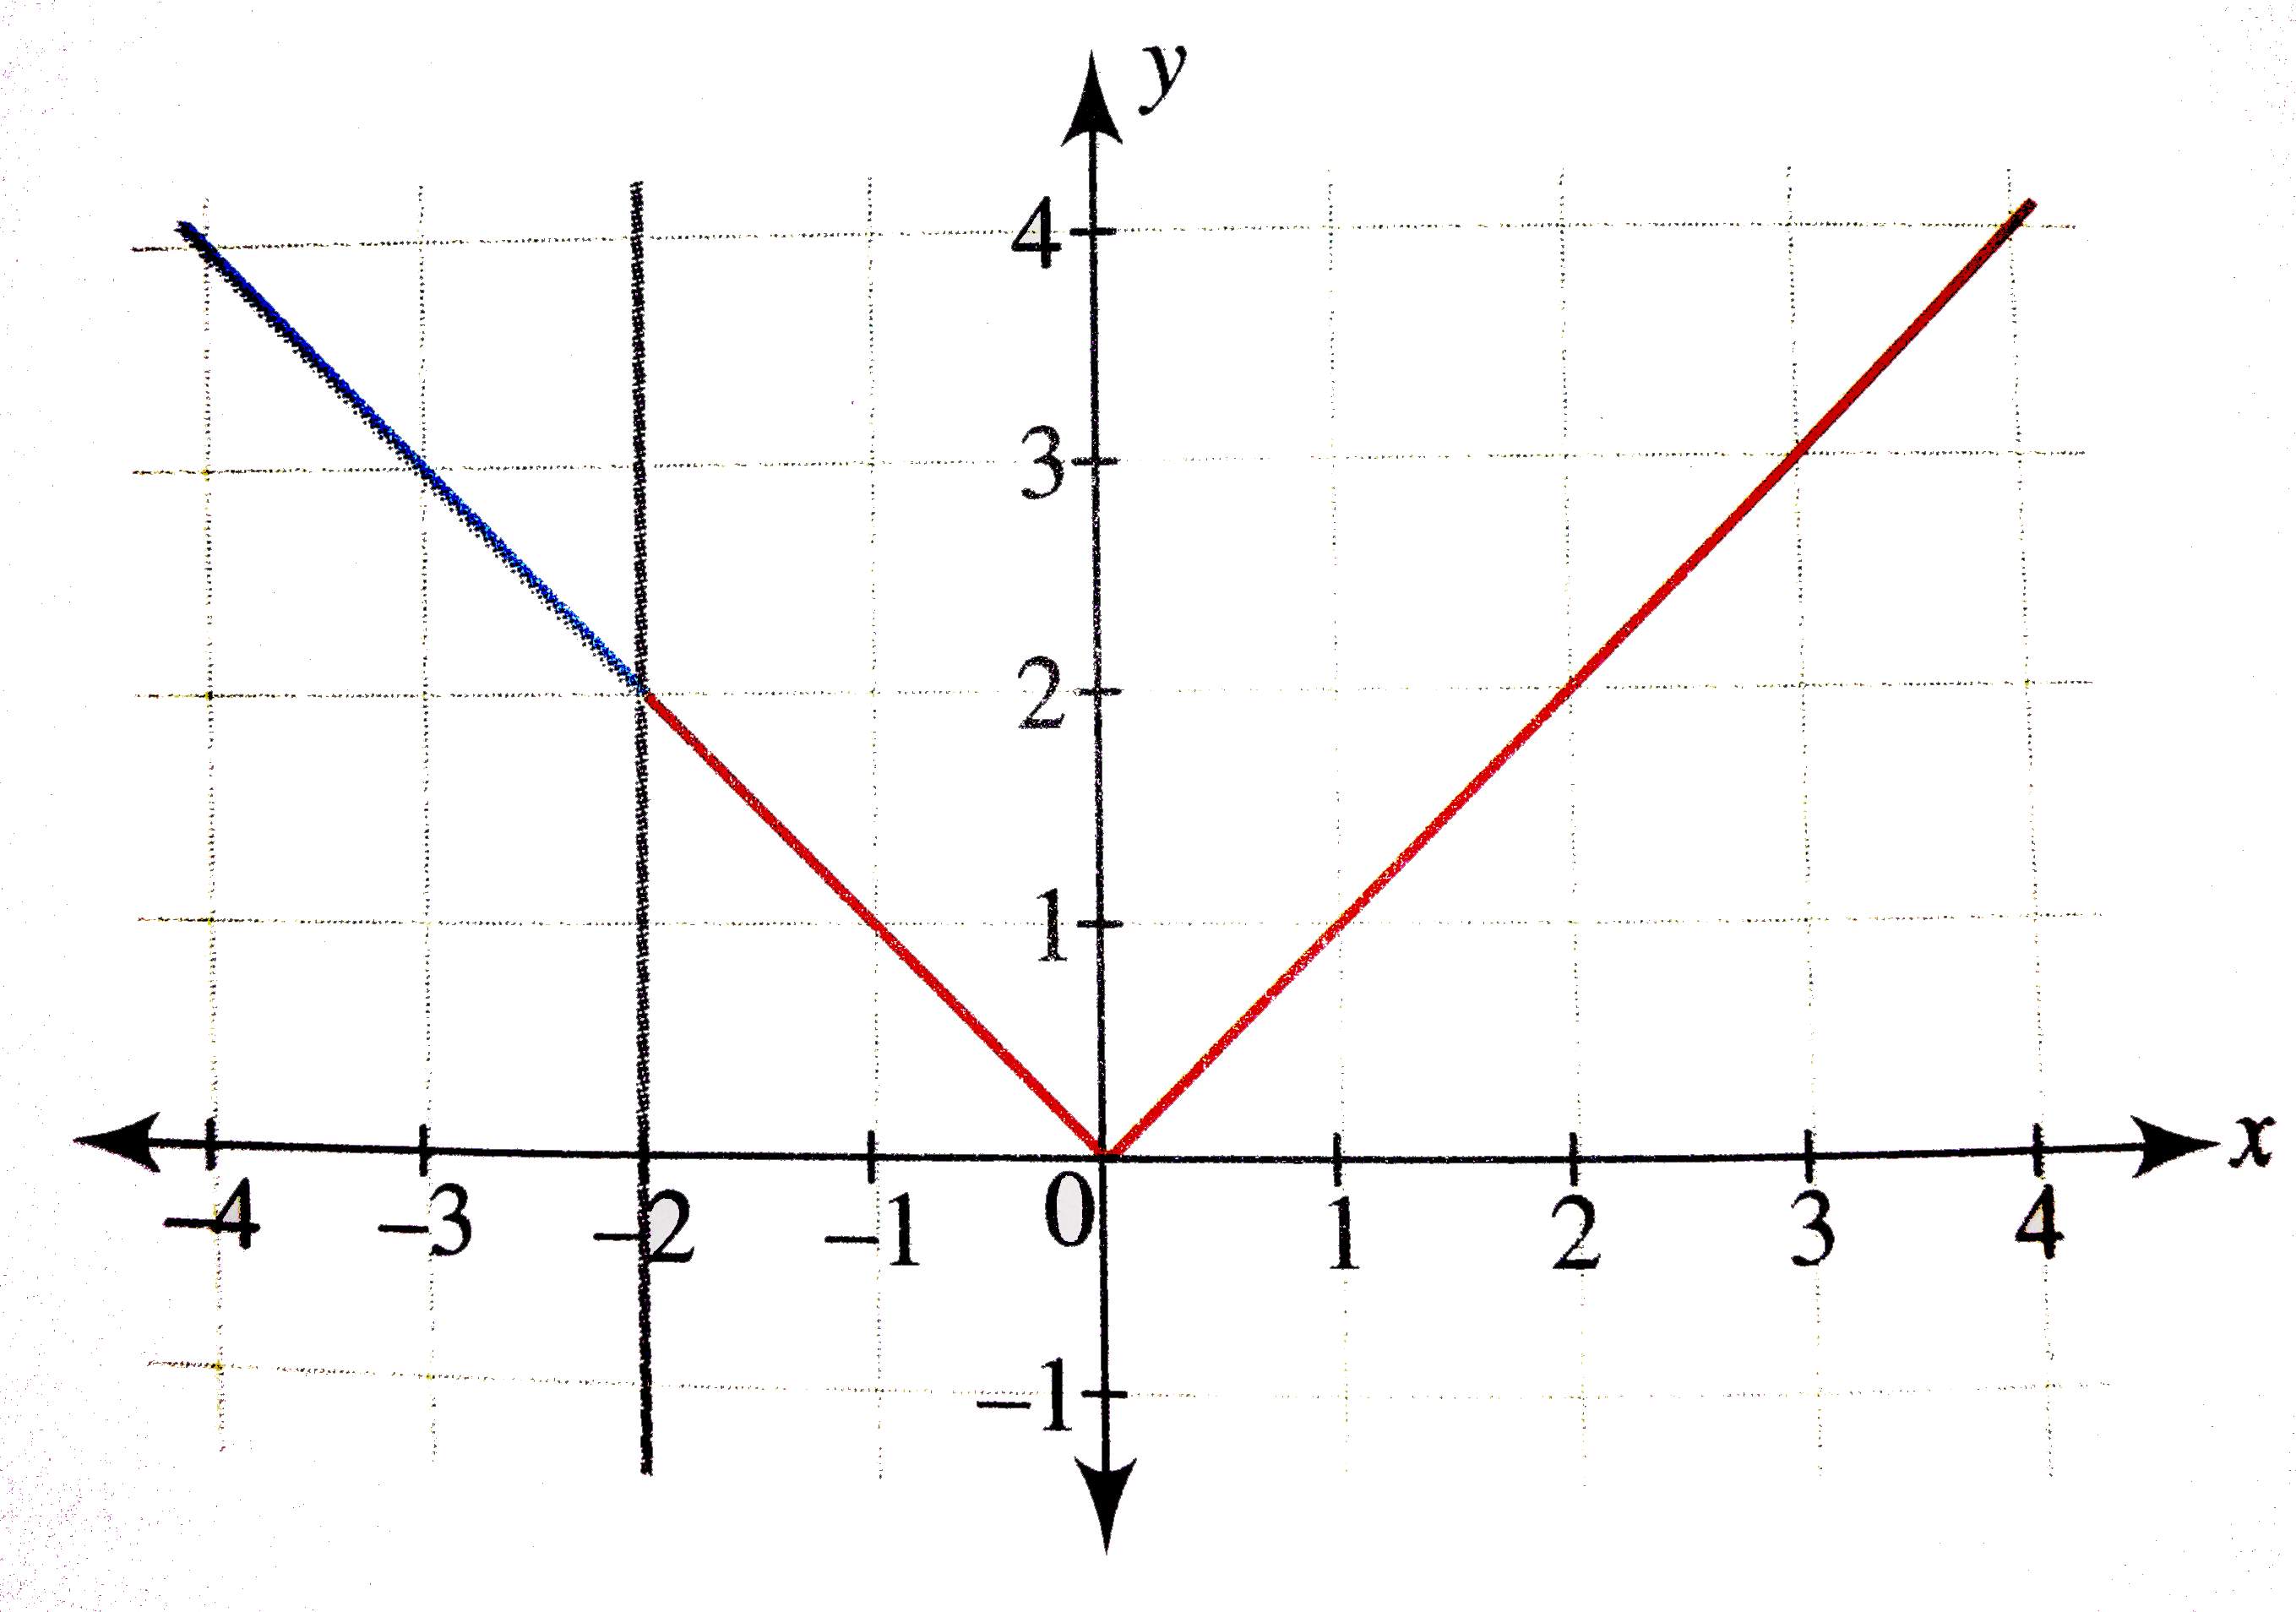
When x>−2, find the values of |x| graphically.
Video Solution
Text Solution

From the graph, the values of |x| decrease from 2 to 0 when x increases from -2 to 0, and then |x| increases from 0 to infinity when x increases from 0 to infinity when x increases from 0 to infinity.
Thus, from the red-lined graph, |x|∈[0,∞).
|
Updated on:21/07/2023
Topper's Solved these Questions
- BOOK - CENGAGE ENGLISHCHAPTER - GRAPHS OF ELEMENTARY FUNCTIONS EXERCISE - EXERCISES34videos
GRAPHS OF ELEMENTARY FUNCTIONS
- BOOK - CENGAGE ENGLISHCHAPTER - GRAPHS OF POLYNOMIAL AND RATIONAL FUNCTIONSEXERCISE - Exercises17videos
GRAPHS OF POLYNOMIAL AND RATIONAL FUNCTIONS
- BOOK - CENGAGE ENGLISHCHAPTER - GRAPHS OF TRIGONOMETRIC FUNCTIONSEXERCISE - Exercises22videos
GRAPHS OF TRIGONOMETRIC FUNCTIONS
Similar Questions
Knowledge Check
- Question 1 - Select One
When x=4 and y=2 find the value of :
x−yA2B3C4D5 - Question 2 - Select One
When x=4 and y=2 find the value of :
x+yA6B7C8D9
If x>2, then find the values of 1/x graphically.
View SolutionWhen x<3, find the values of 1/x.
View SolutionIf x<2, then find the values of x2 graphically.
View SolutionIf x<−1, then find the values of x2 graphically.
View SolutionIf x<−1, then find the values of 1/x graphically.
View SolutionWhen x=4 and y=2 find the value of :
x÷yView Solution

