Let y=f(x)={e1x2ifx≠00ifx=0 then which of the following can best represent the graph of y=f(x)?
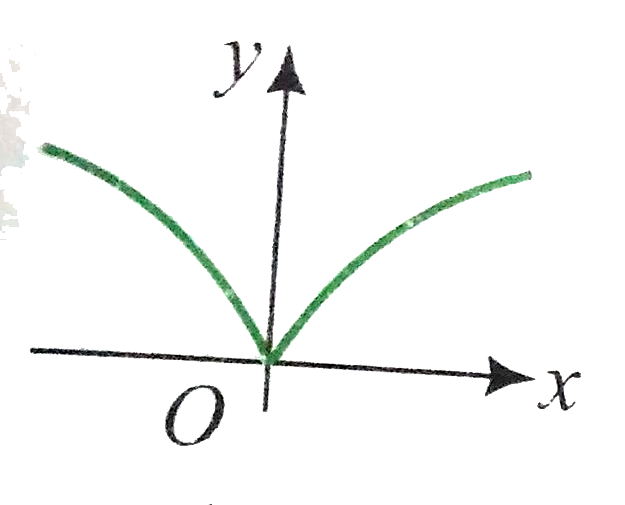
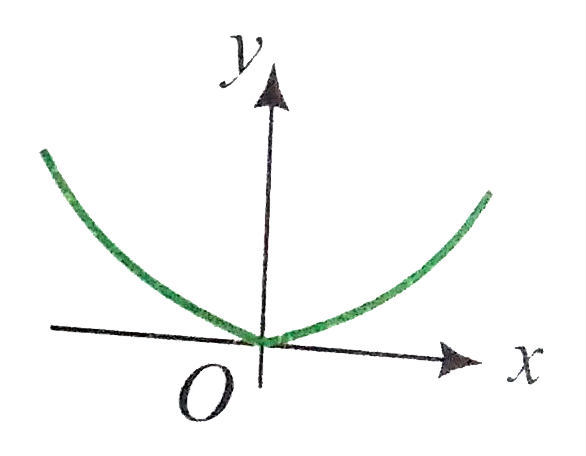
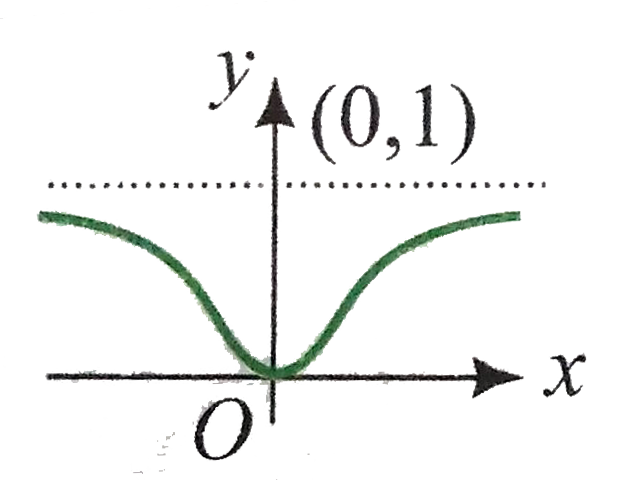
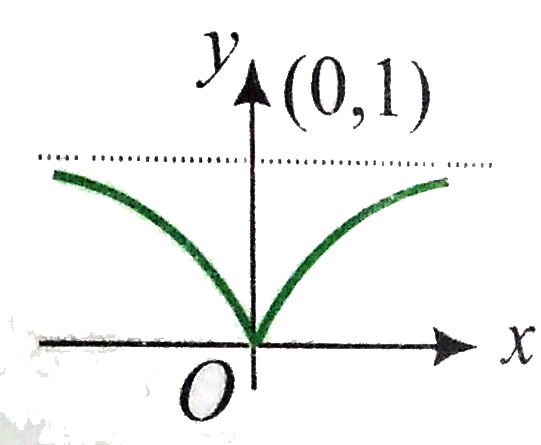
The correct Answer is:C
To solve the problem, we need to analyze the function defined as:
y=f(x)={e1x2if x≠00if x=0
Step 1: Analyze the function for x≠0
For x≠0, the function f(x)=e1x2 is defined. As x approaches 0 from either side (positive or negative), the term 1x2 approaches infinity. Therefore, e1x2 approaches infinity as well.
Step 2: Analyze the function at x=0
At x=0, the function is defined as f(0)=0.
Step 3: Check the limits as x approaches 0
- Right-hand limit as x→0+:
limx→0+f(x)=limx→0+e1x2=+∞
- Left-hand limit as x→0−:
limx→0−f(x)=limx→0−e1x2=+∞
Step 4: Check differentiability at x=0
To check differentiability at x=0, we need to find the right-hand and left-hand derivatives.
- Right-hand derivative:
f′(0+)=limx→0+f(x)−f(0)x−0=limx→0+e1x2−0x=limx→0+e1x2x
As x→0+, e1x2→+∞ and x→0+, thus this limit approaches +∞.
- Left-hand derivative:
f′(0−)=limx→0−f(x)−f(0)x−0=limx→0−e1x2−0x=limx→0−e1x2x
As x→0−, e1x2→+∞ and x→0−, thus this limit approaches −∞.
Since the right-hand derivative approaches +∞ and the left-hand derivative approaches −∞, the function is not differentiable at x=0.
Step 5: Determine the behavior as x approaches +∞ and −∞
- Limit as x→+∞:
limx→+∞f(x)=limx→+∞e1x2=e0=1
- Limit as x→−∞:
limx→−∞f(x)=limx→−∞e1x2=e0=1
Step 6: Conclusion about the graph
The function f(x) approaches 1 as x goes to both +∞ and −∞, and it is not defined at x=0 in a differentiable manner. Therefore, the graph of f(x) approaches the horizontal line y=1 as x goes to both infinities, and it has a discontinuity at x=0.
Final Answer
The graph that best represents y=f(x) is the one that shows a discontinuity at x=0 and approaches y=1 as x approaches ±∞.
---
limx→0+f(x)=limx→0+e1x2=+∞
limx→0−f(x)=limx→0−e1x2=+∞
f′(0+)=limx→0+f(x)−f(0)x−0=limx→0+e1x2−0x=limx→0+e1x2x
As x→0+, e1x2→+∞ and x→0+, thus this limit approaches +∞.
f′(0−)=limx→0−f(x)−f(0)x−0=limx→0−e1x2−0x=limx→0−e1x2x
As x→0−, e1x2→+∞ and x→0−, thus this limit approaches −∞.
limx→+∞f(x)=limx→+∞e1x2=e0=1
limx→−∞f(x)=limx→−∞e1x2=e0=1
Similar Questions
Knowledge Check
The graph of y=f(x) is shown below.
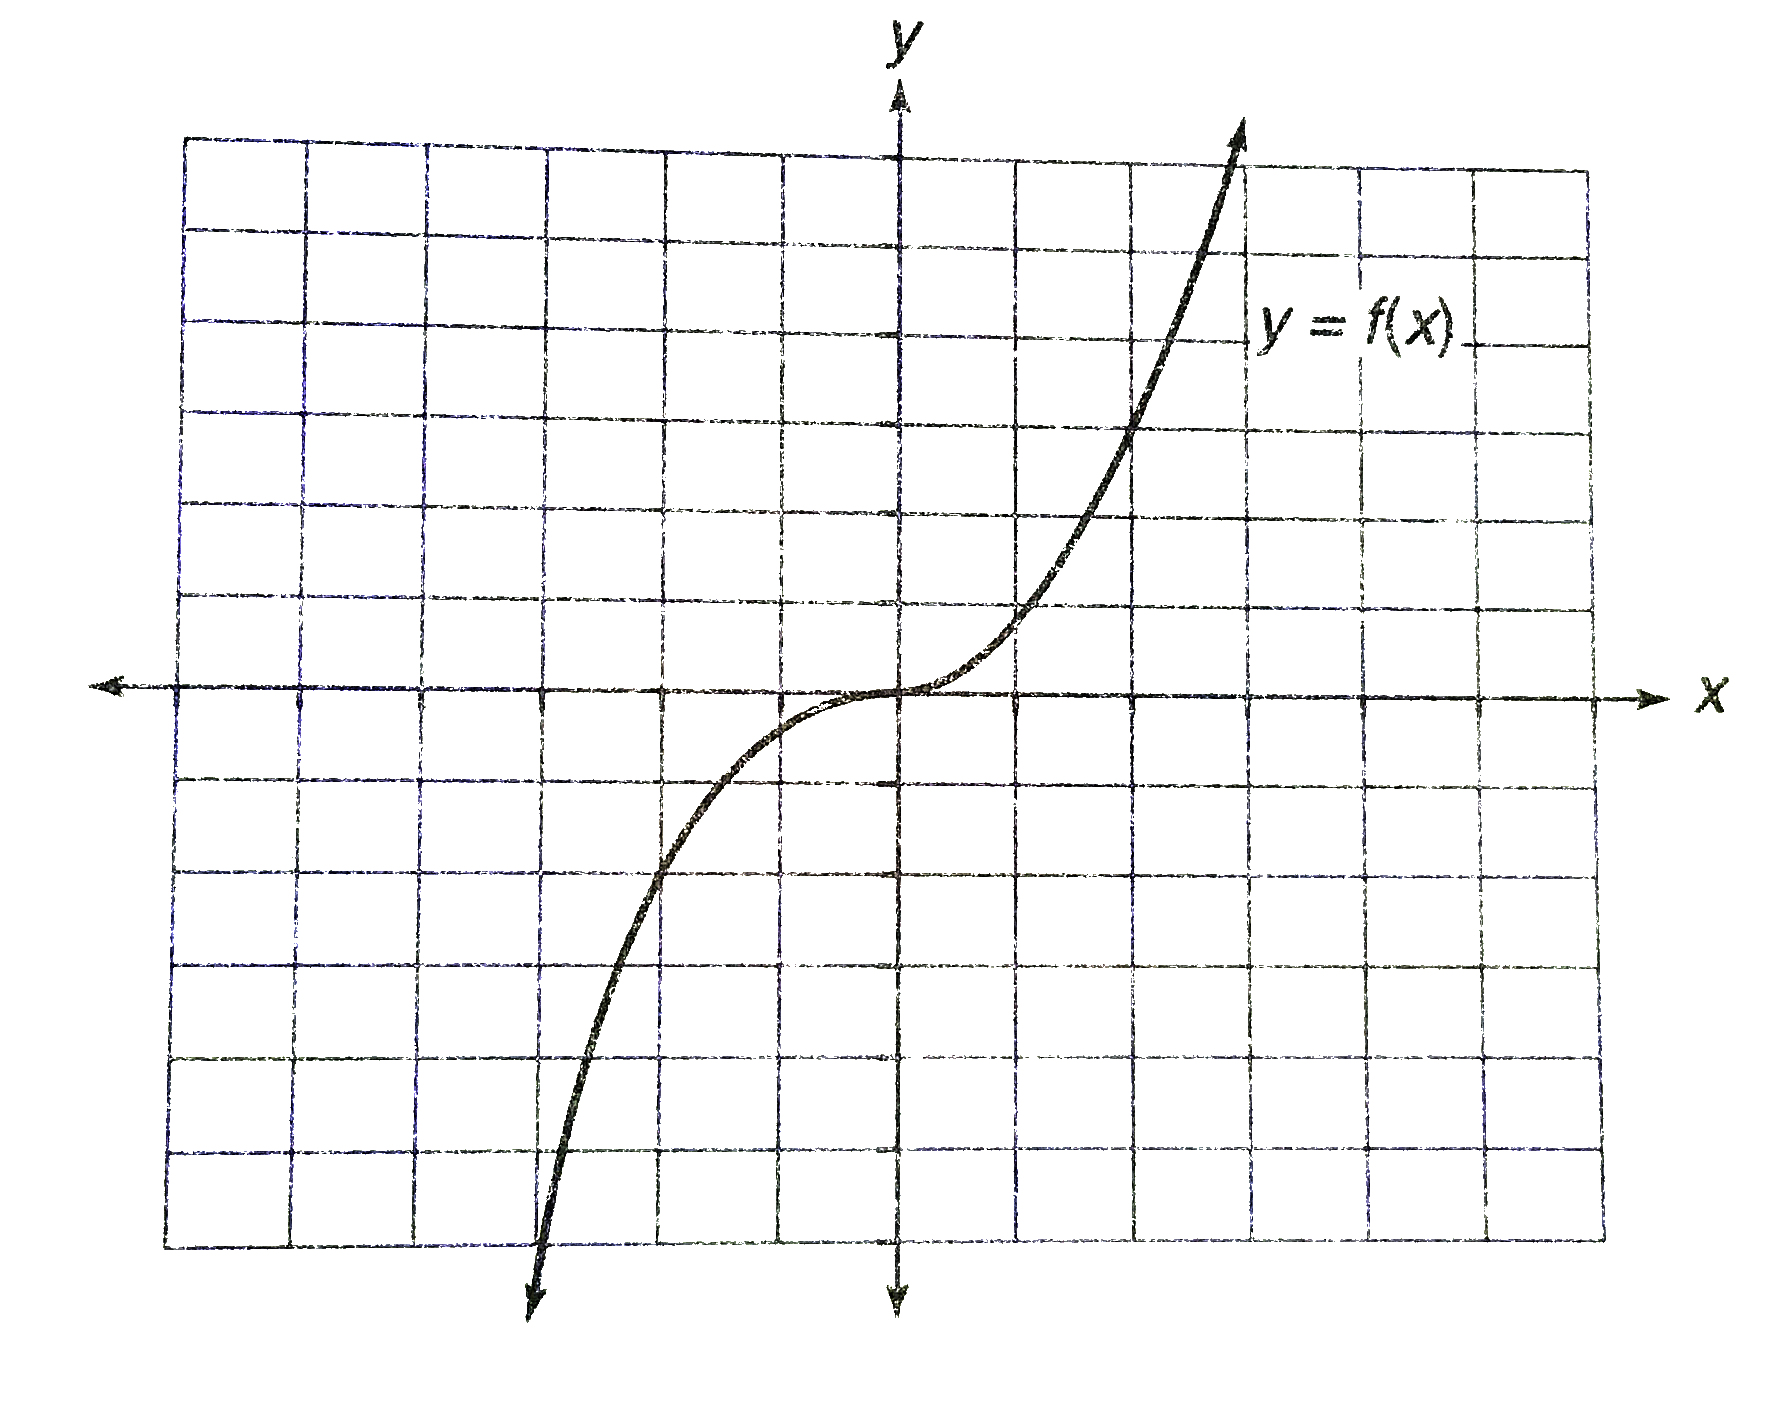
Which of the following could represents the graph of y=f(x−2)+1?A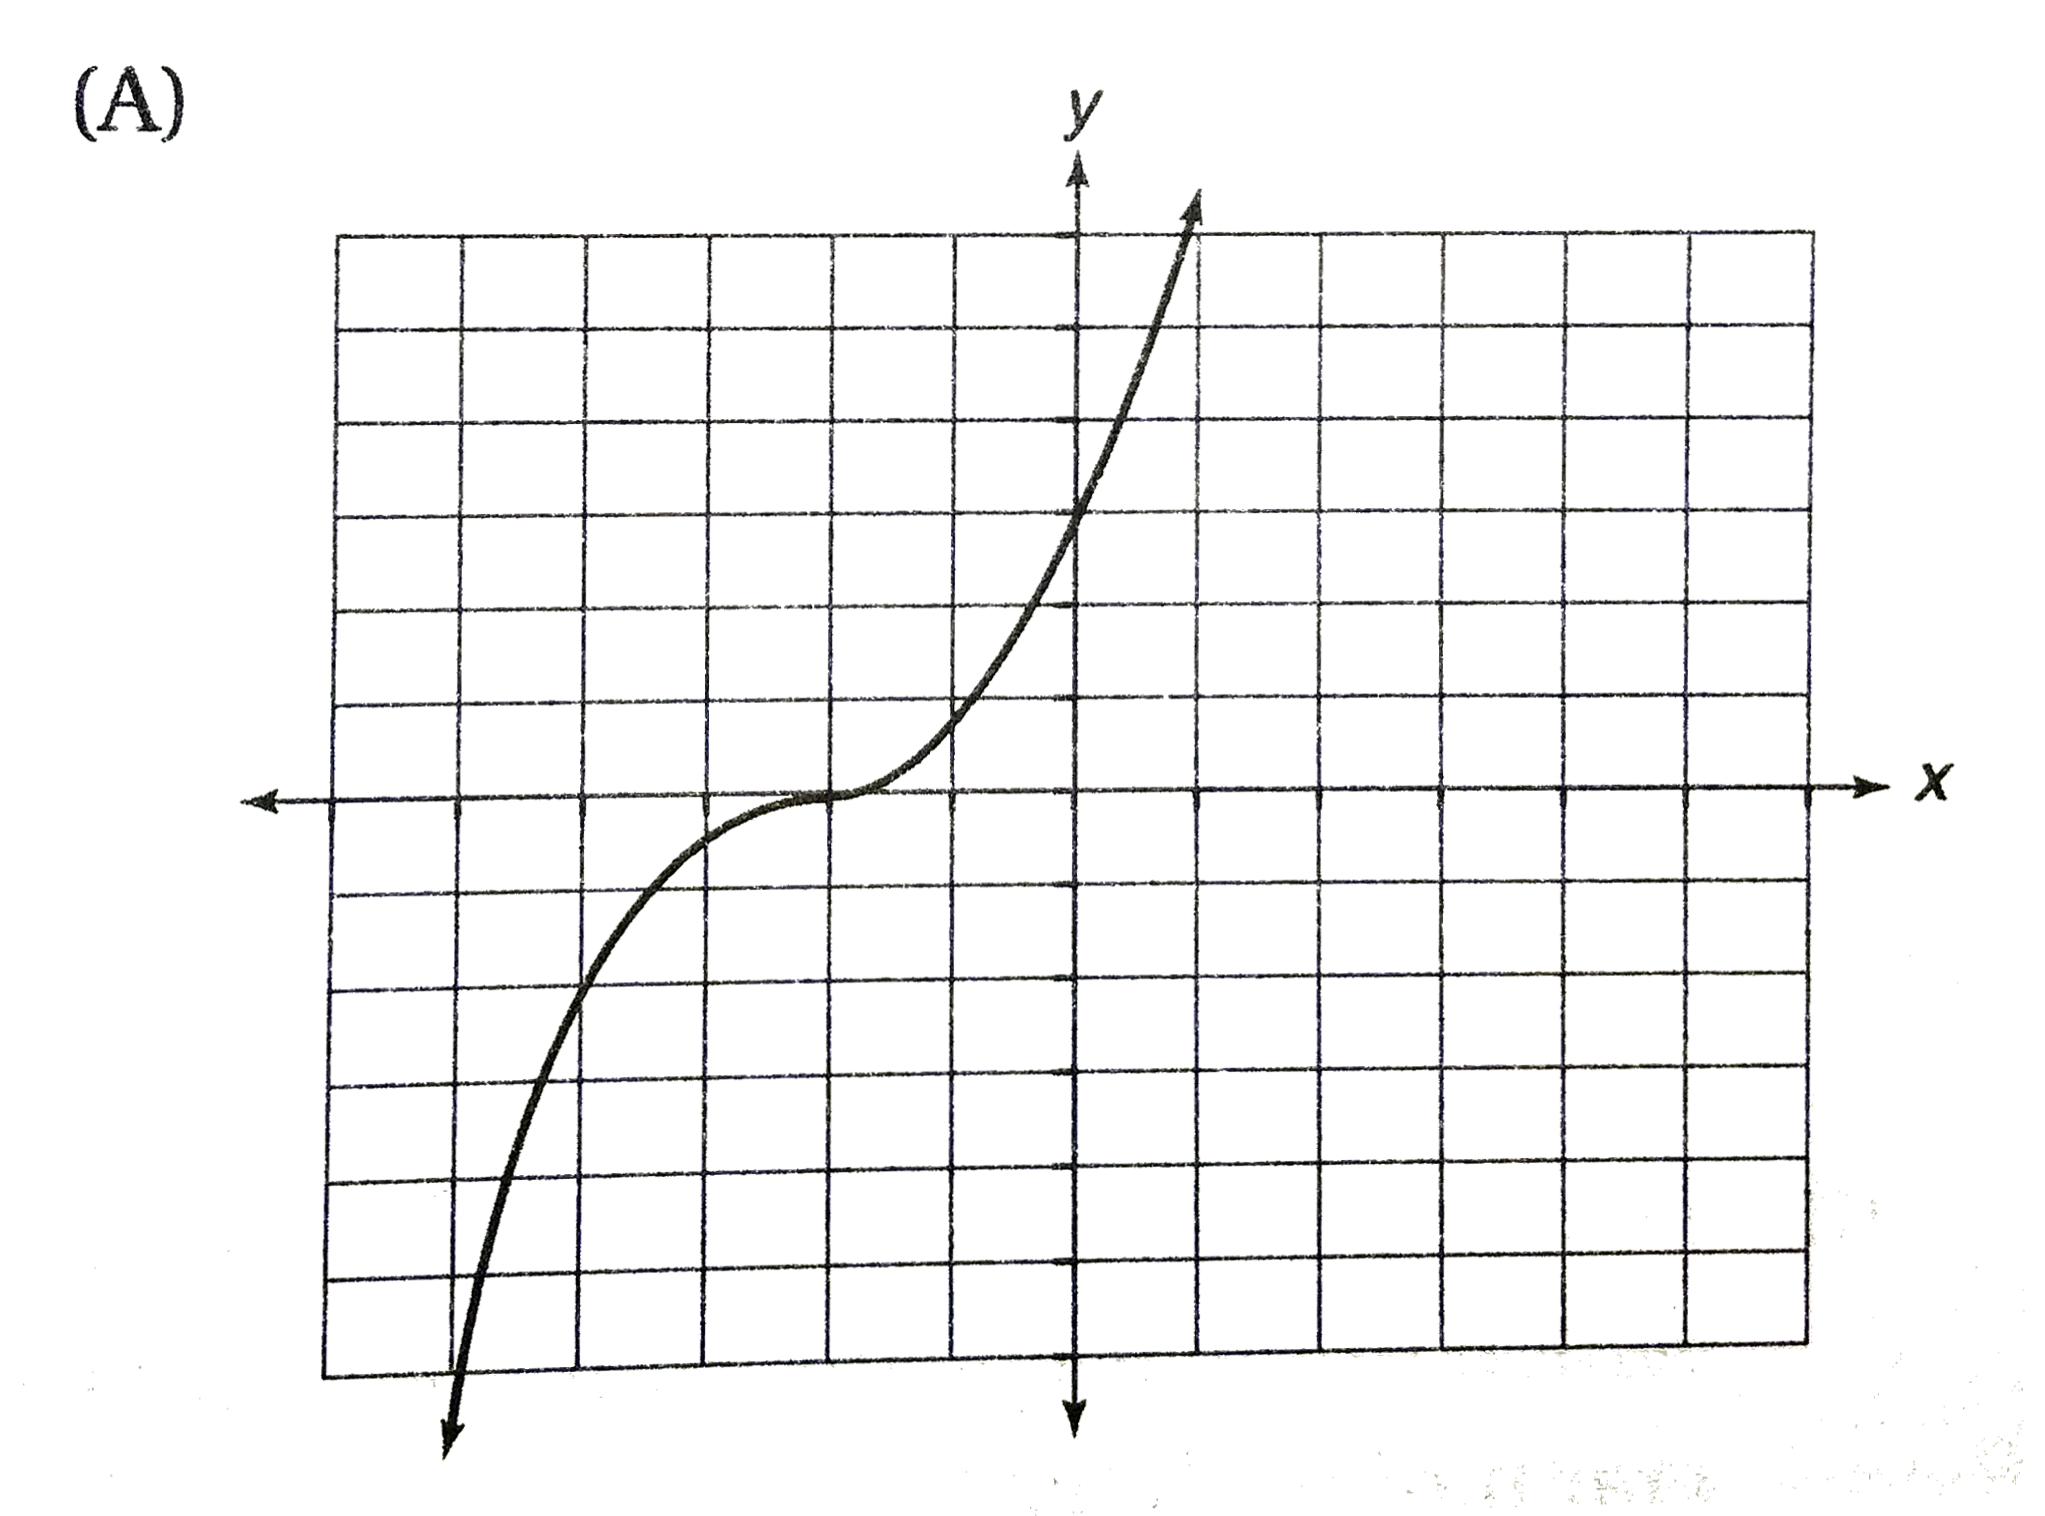 B
B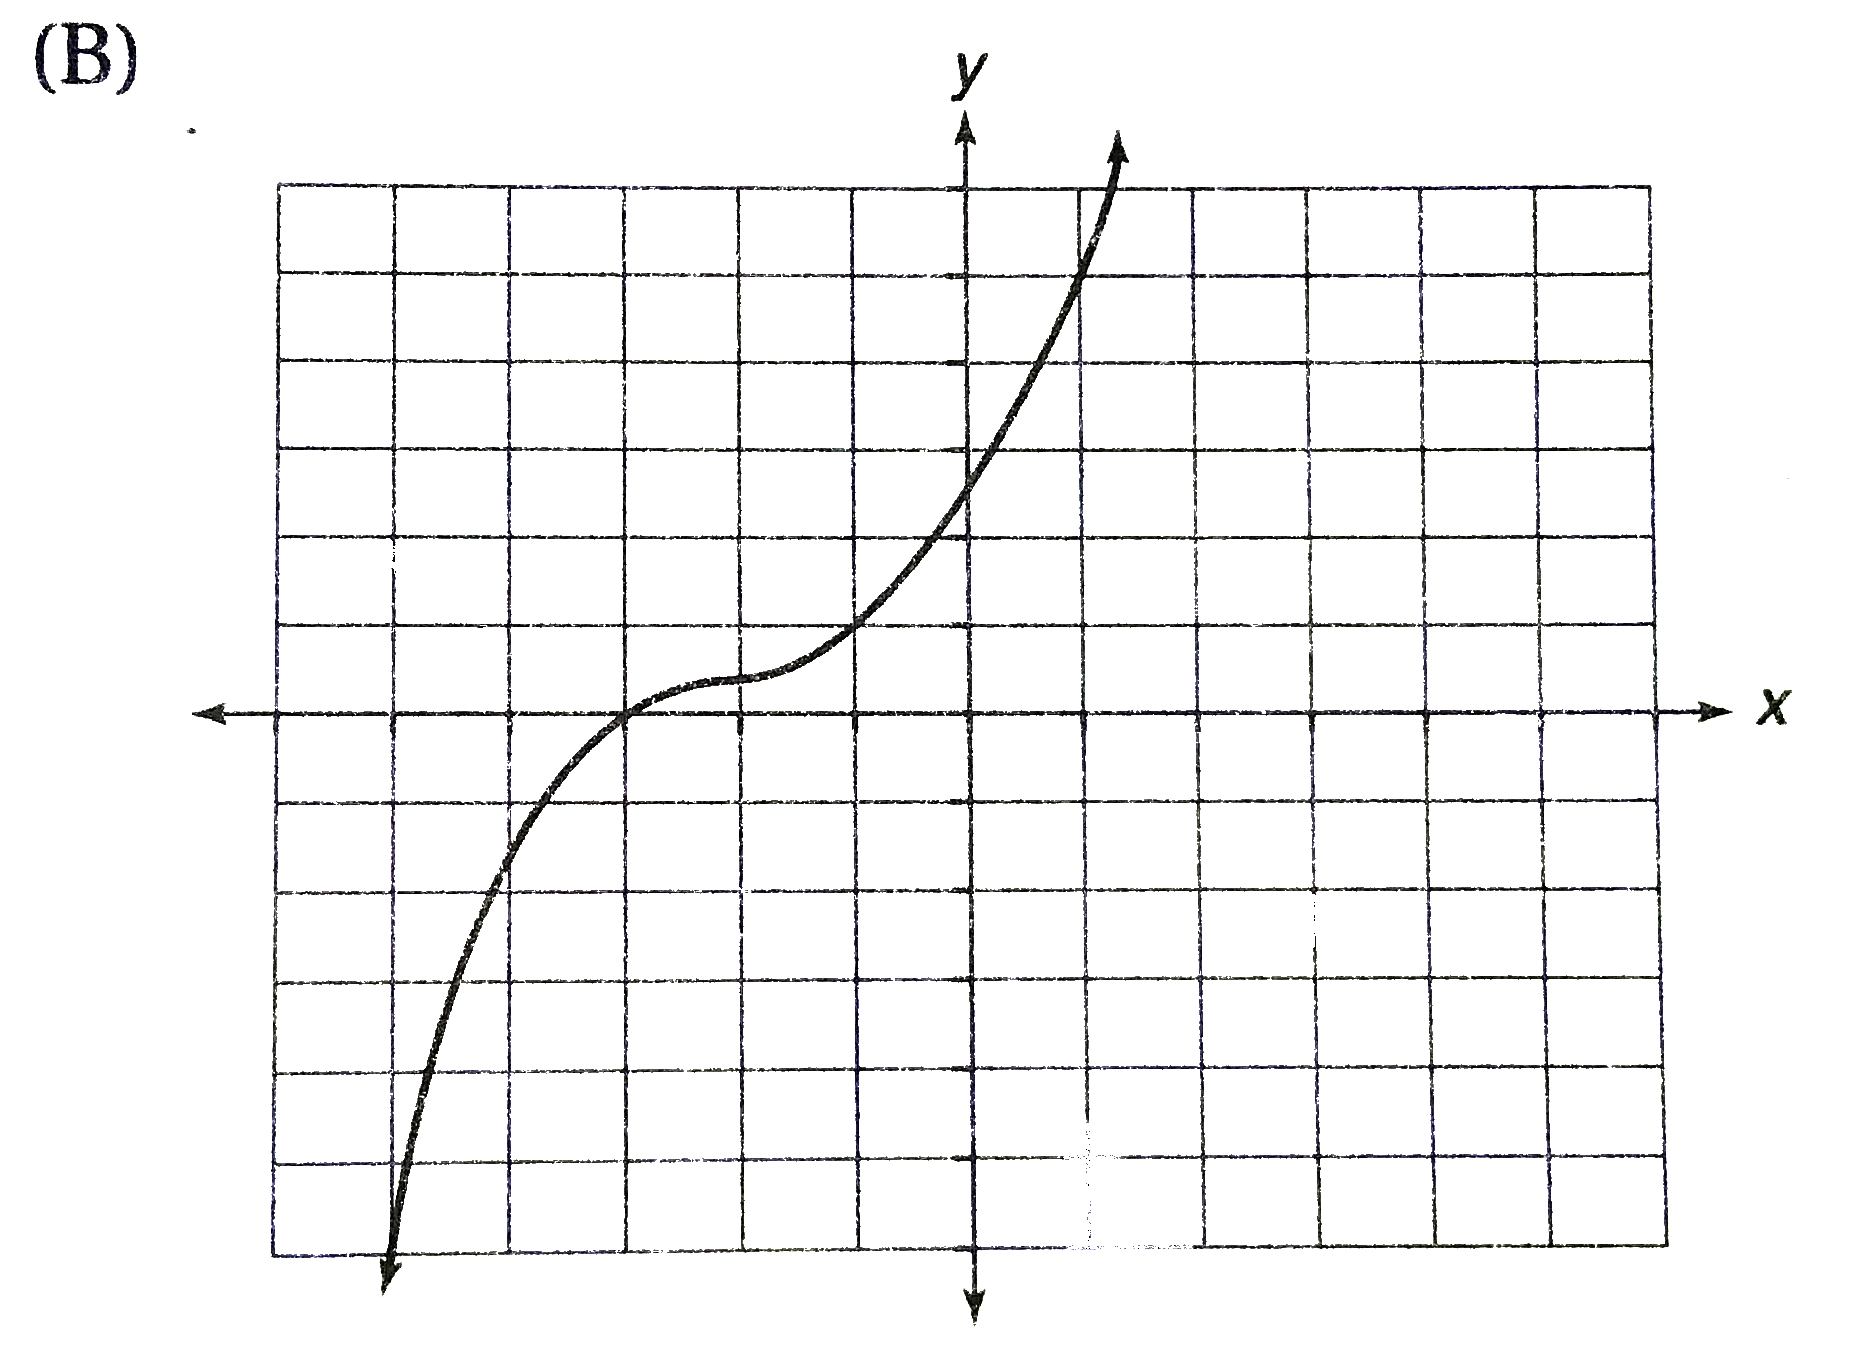 C
C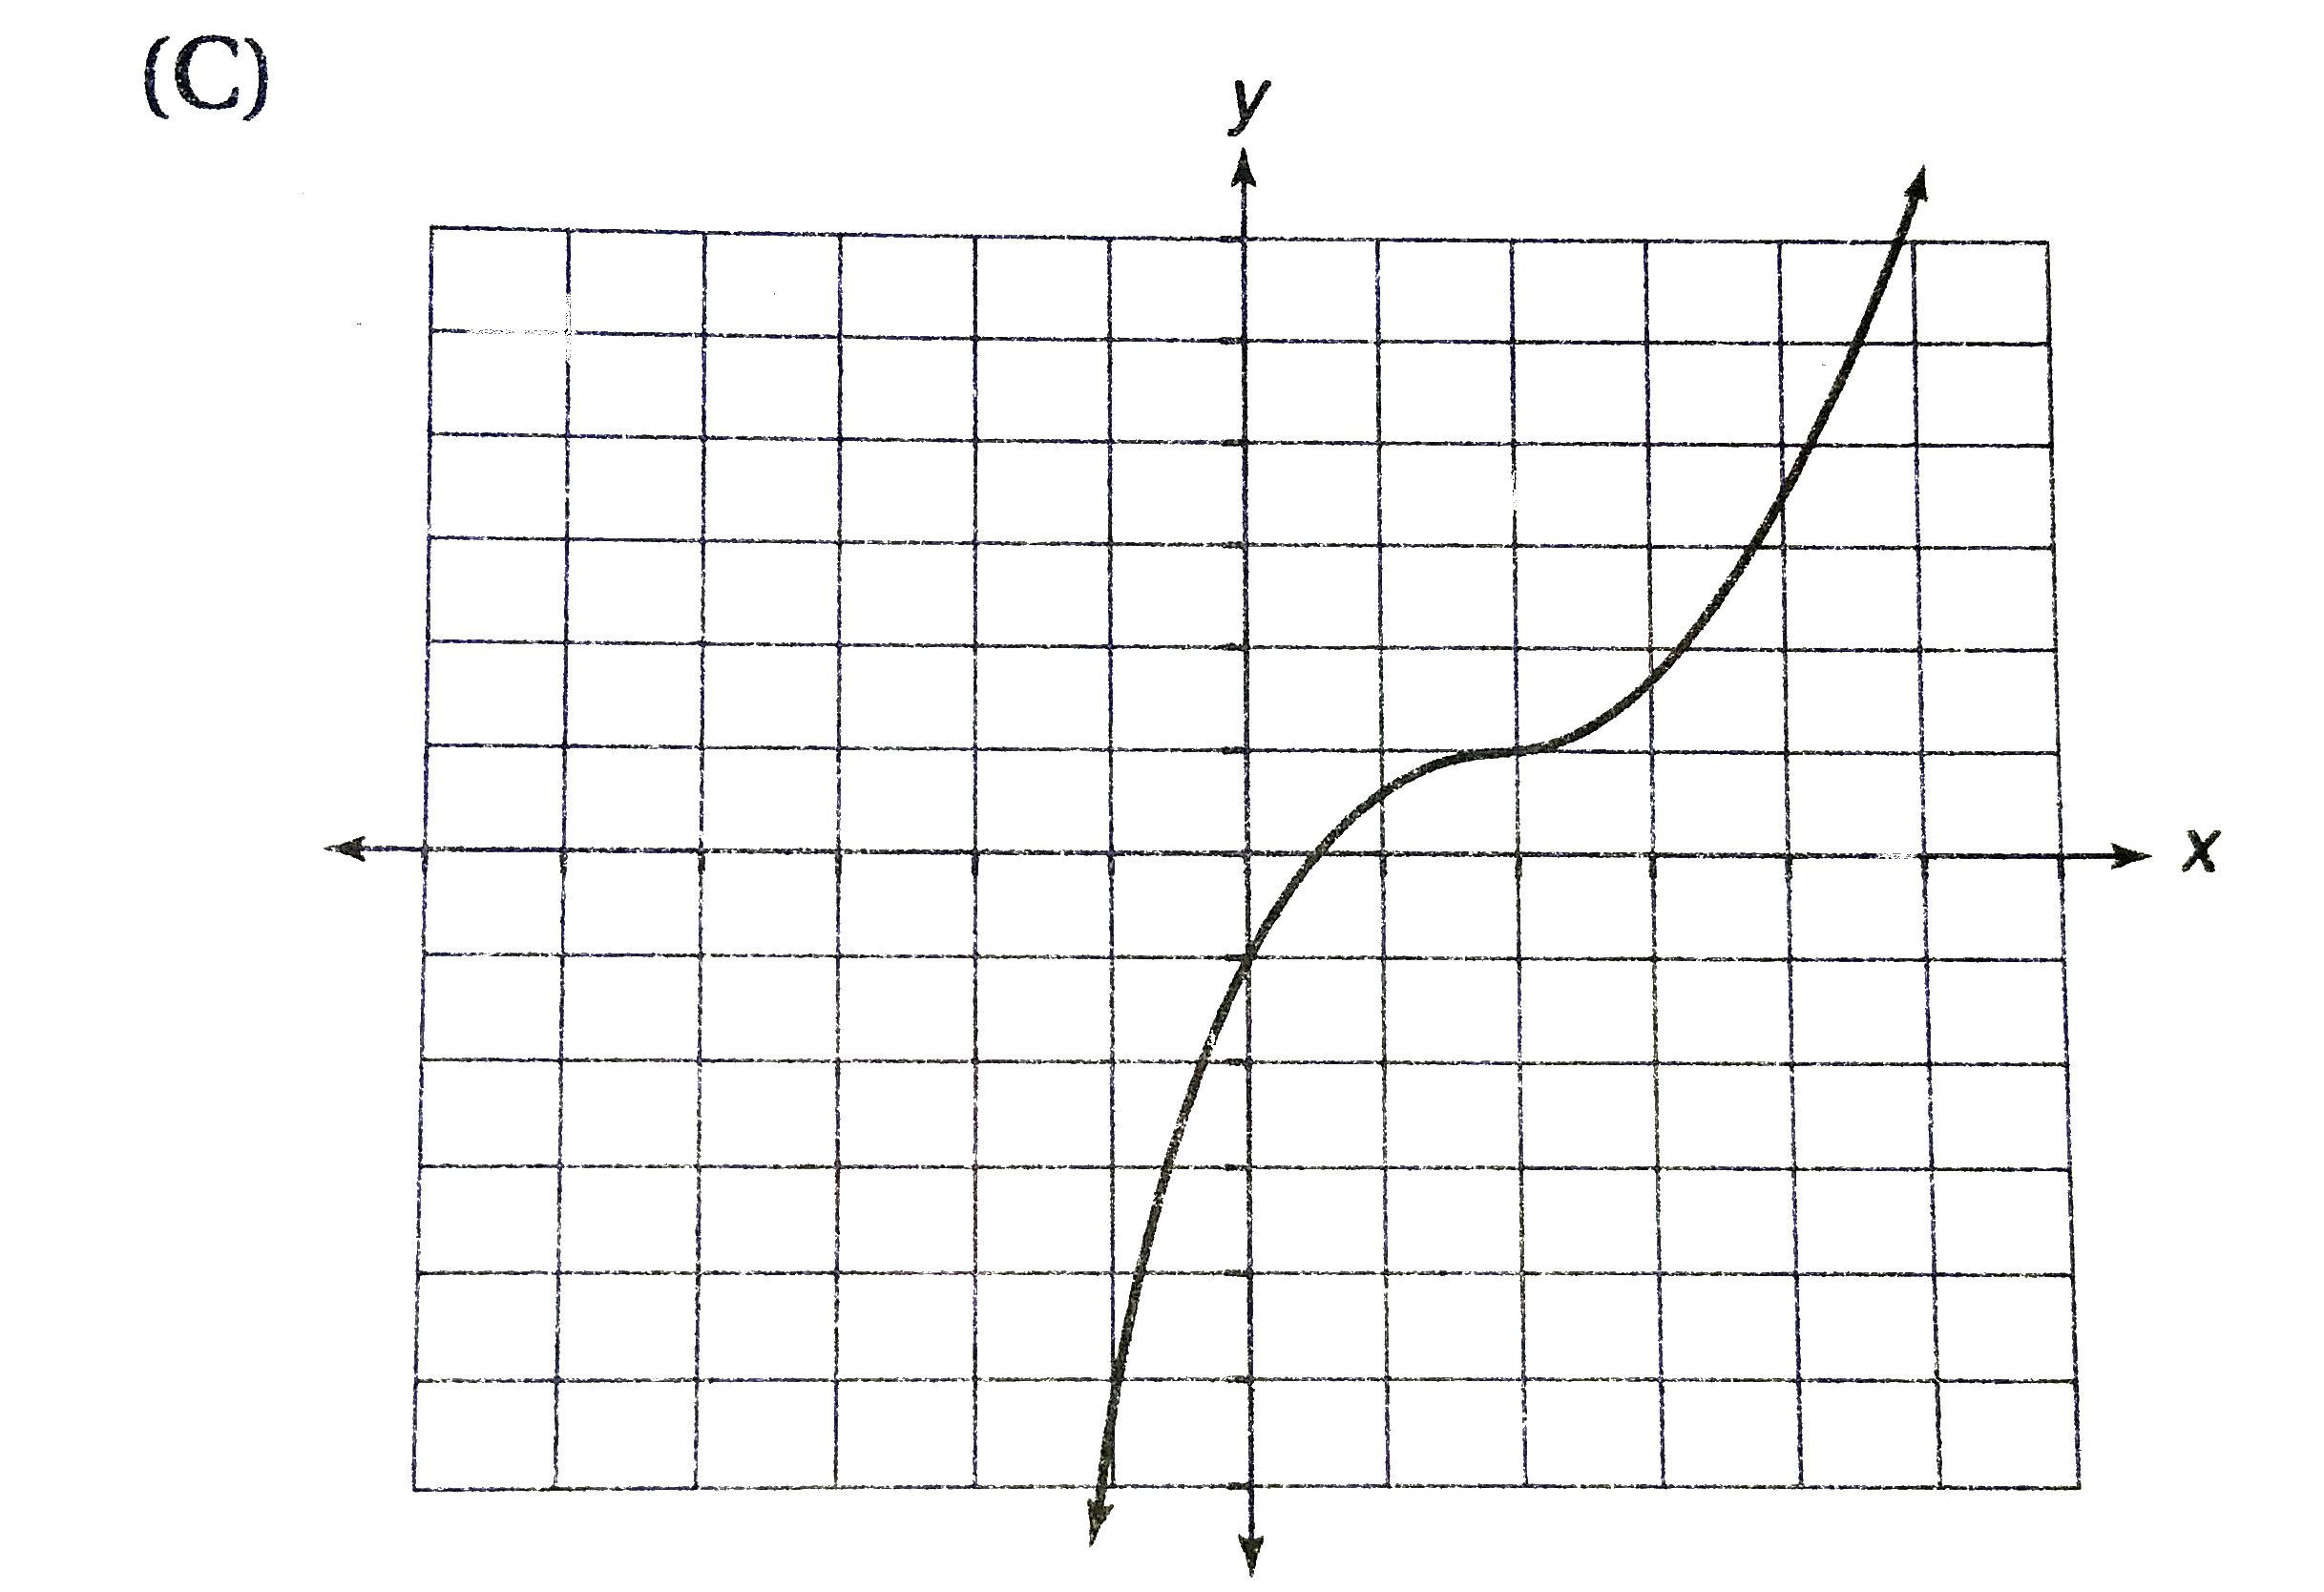 D
D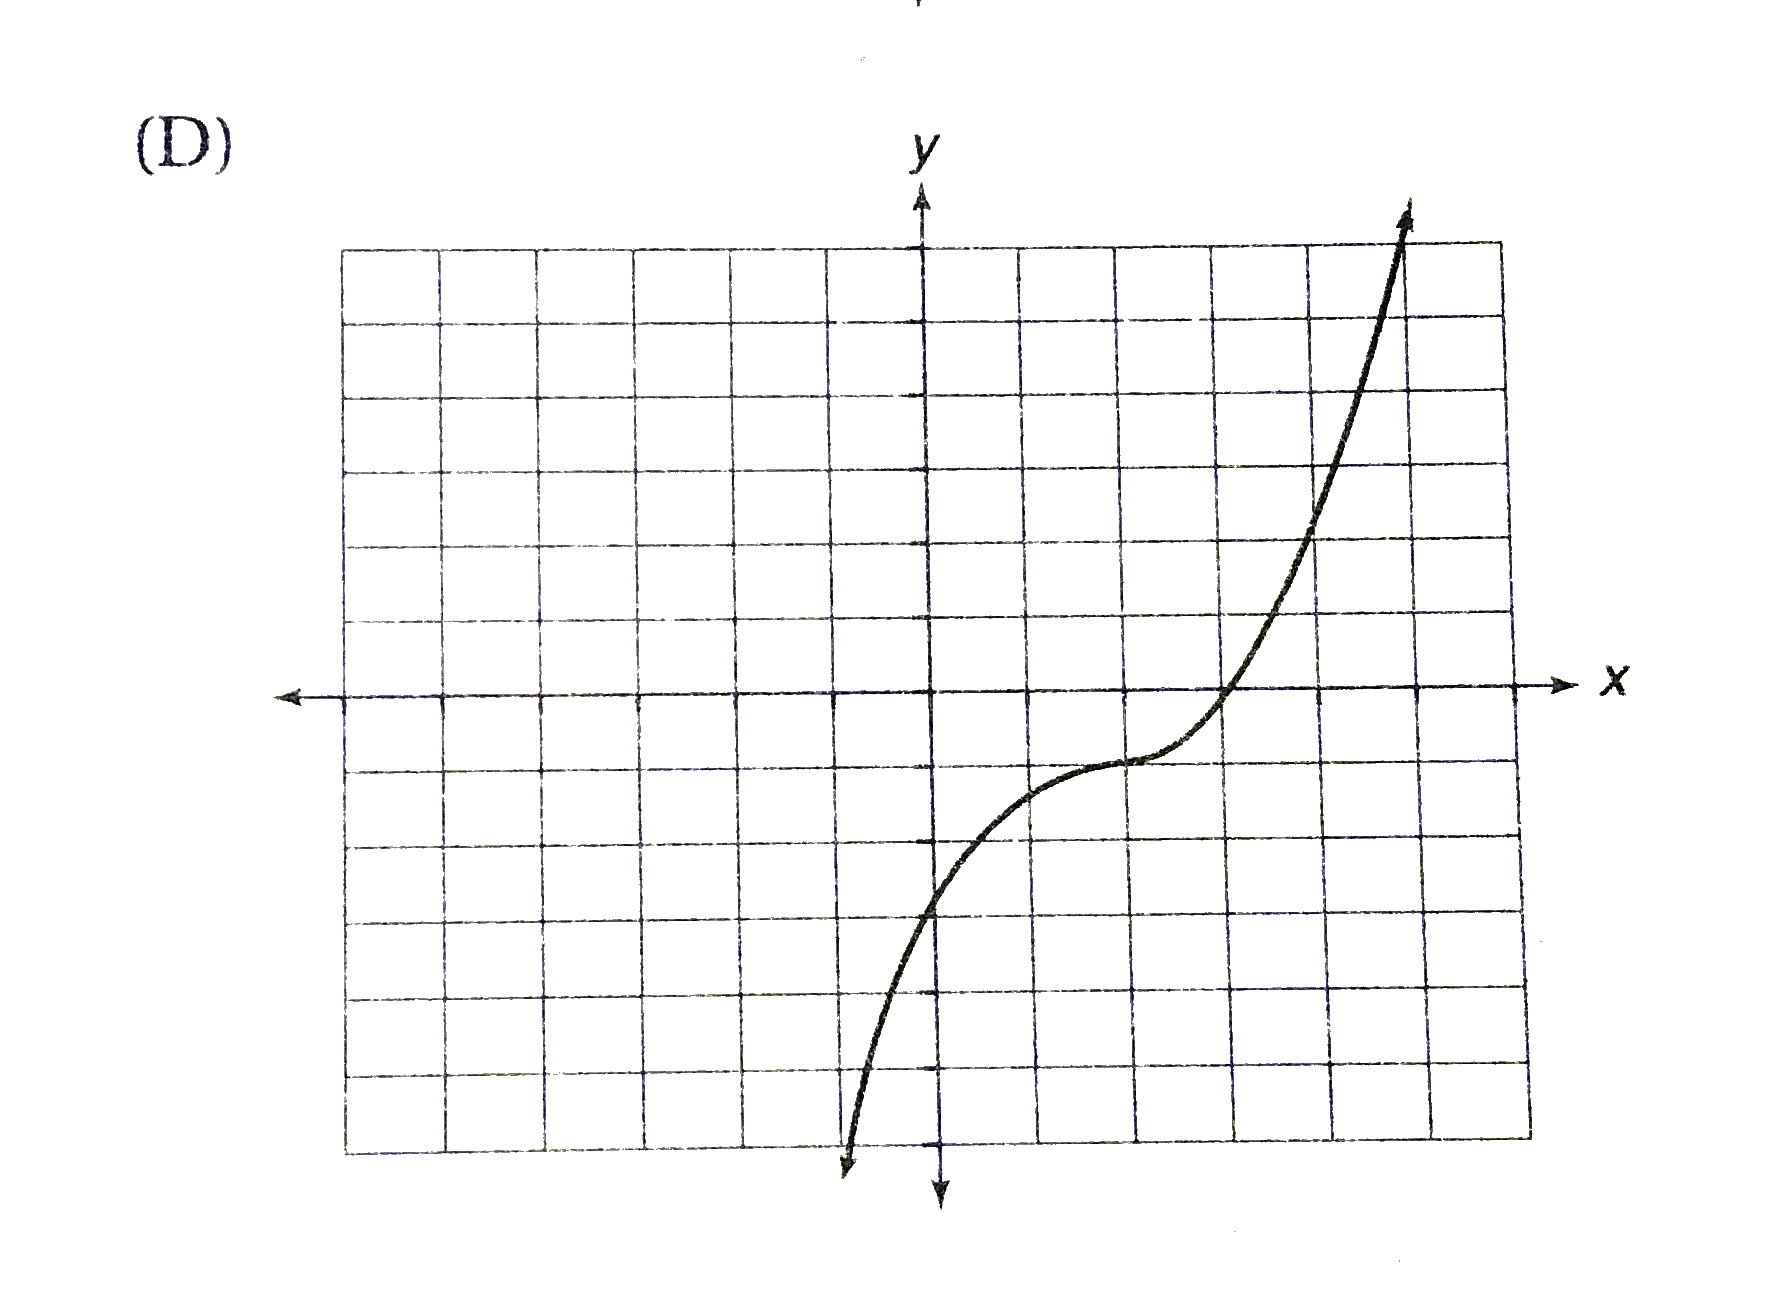
If f(x)={1e1/x,x≠00,x=0 then
View SolutionIf f(x)=⎧⎨⎩xe−(1|x|+1x)x≠00x=0 then f(x) is
View SolutionIf f(x)={1x−2e2x−1x≠01x=0
View SolutionIf f(x)=⎧⎨⎩ex[x]−1x+[x]x≠01x=0 then
View SolutionLet f(x)={(e1x2sin1x,x≠0),(λ,x=(0),thenf'(0)
View SolutionIf f(x)=⎧⎪⎨⎪⎩e2x−1e2x+1:x≠00:x=0, then f(x) is
View SolutionIf f(x)={x−ex+1−(1−cos2x)x2x≠0kx=0 is continous at x=0 then which of the following statement is false ?
View Solution
