The marks scored by 750 students in an examination are given in the form of a frequency distribution table: Marks No. of students Marks No. of students 600-640 16 760-800 172 640-680 45 800-840 59 680-720 156 840-880 18 720-760 284 Prepare a cumulative frequency table by less than method and draw an ogive.
To solve the problem of preparing a cumulative frequency table using the less than method and drawing an ogive, we will follow these steps:
Step 1: Create the Frequency Distribution Table
We start with the given frequency distribution table:
| Marks | No. of Students |
|-------------|-----------------|
| 600-640 | 16 |
| 640-680 | 45 |
| 680-720 | 156 |
| 720-760 | 284 |
| 760-800 | 172 |
| 800-840 | 59 |
| 840-880 | 18 |
Step 2: Prepare the Cumulative Frequency Table
Using the less than method, we will calculate the cumulative frequency (CF) by adding the frequencies cumulatively.
| Marks (Less than) | No. of Students (Frequency) | Cumulative Frequency (CF) |
|--------------------|-----------------------------|----------------------------|
| 640 | 16 | 16 |
| 680 | 45 | 16 + 45 = 61 |
| 720 | 156 | 61 + 156 = 217 |
| 760 | 284 | 217 + 284 = 501 |
| 800 | 172 | 501 + 172 = 673 |
| 840 | 59 | 673 + 59 = 732 |
| 880 | 18 | 732 + 18 = 750 |
Step 3: Final Cumulative Frequency Table
The final cumulative frequency table is:
| Marks (Less than) | Cumulative Frequency (CF) |
|--------------------|----------------------------|
| 640 | 16 |
| 680 | 61 |
| 720 | 217 |
| 760 | 501 |
| 800 | 673 |
| 840 | 732 |
| 880 | 750 |
Step 4: Plotting the Ogive
To draw the ogive, we will plot the points from the cumulative frequency table on a graph.
1. X-axis: Marks (Less than)
2. Y-axis: Cumulative Frequency
Plot the points:
- (640, 16)
- (680, 61)
- (720, 217)
- (760, 501)
- (800, 673)
- (840, 732)
- (880, 750)
Connect the points with a smooth curve to form the ogive.
Step 5: Conclusion
The ogive represents the cumulative frequency distribution of the marks scored by the students.
We start with the given frequency distribution table:
|-------------|-----------------|
| 600-640 | 16 |
| 640-680 | 45 |
| 680-720 | 156 |
| 720-760 | 284 |
| 760-800 | 172 |
| 800-840 | 59 |
| 840-880 | 18 |
Using the less than method, we will calculate the cumulative frequency (CF) by adding the frequencies cumulatively.
|--------------------|-----------------------------|----------------------------|
| 640 | 16 | 16 |
| 680 | 45 | 16 + 45 = 61 |
| 720 | 156 | 61 + 156 = 217 |
| 760 | 284 | 217 + 284 = 501 |
| 800 | 172 | 501 + 172 = 673 |
| 840 | 59 | 673 + 59 = 732 |
| 880 | 18 | 732 + 18 = 750 |
The final cumulative frequency table is:
|--------------------|----------------------------|
| 640 | 16 |
| 680 | 61 |
| 720 | 217 |
| 760 | 501 |
| 800 | 673 |
| 840 | 732 |
| 880 | 750 |
To draw the ogive, we will plot the points from the cumulative frequency table on a graph.
2. Y-axis: Cumulative Frequency
- (640, 16)
- (680, 61)
- (720, 217)
- (760, 501)
- (800, 673)
- (840, 732)
- (880, 750)
The ogive represents the cumulative frequency distribution of the marks scored by the students.
Topper's Solved these Questions
Similar Questions
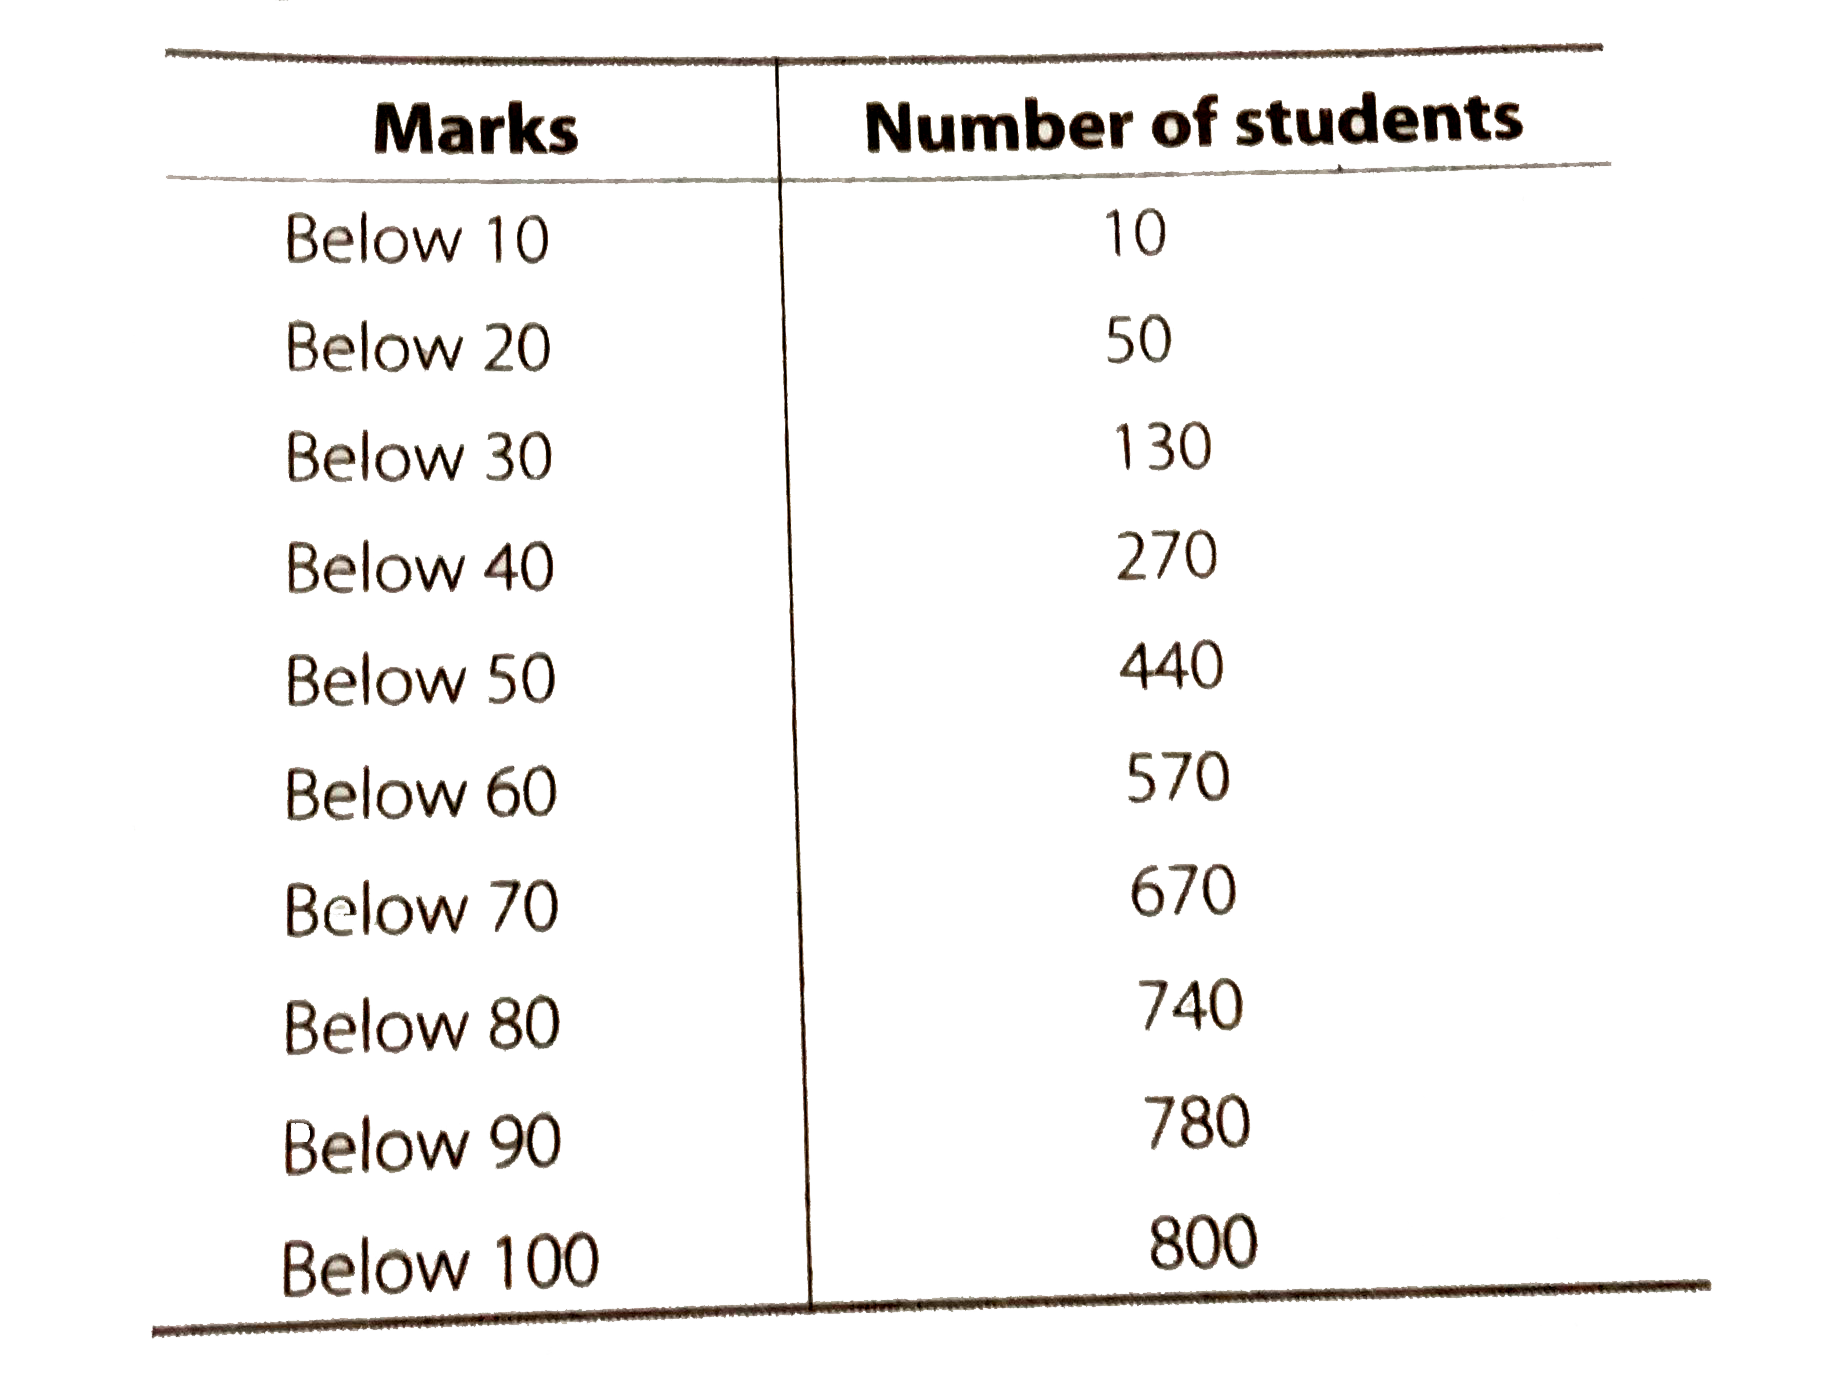
The following table show tha cumulative frequency distribution of marks of 800 students in an examination.

Construct a frequency distribution table for the data above.
View SolutionThe marks scored by 750 students in an examination are given in the form of a frequency distribution table.
.Marks 600−640,640−680,680−720and720−760,760−800,800−840,840−880
N⊙ofStudents:16451562841725918 Represent this data in the form of a histogram and construct a frequency polygon.
View SolutionA cumulative frequency distribution is given below. Convert this into a frequency distribution table. Marks Below 45 Below 60 Below 75 Below 90 Below 105 Below 120 No. of Students 0 8 23 48 85 116
View SolutionA cumulative frequency distribution is given below. Convert this into a frequency distribution table. Marks Below 45 Below 60 Below 75 Below 90 Below 105 Below 120 No. of Students 0 8 23 48 85 116
View SolutionThe marks obtained out of 50, by 102 students in a Physics test are given in the frequency table below: Marks (x) : 15 20 22 24 25 30 33 38 45 Frequency (f) : 5 8 11 20 23 18 13 3 1 Find the average number of marks.
View SolutionThe marks of 20 students out of 25 are given below
1217227111924184823251521161191217 Prepare a frequency table for the given data.
View SolutionThe following table gives the marks scored by 100 students in an entrance examination. Marks: 0-10 10-20 20-30 30-40 40-50 50-60 60-70 70-80 No. of Students (Frequency): 4 10 16 22 20 18 8 2 Represent this data in the form of a histogram.
View SolutionThe marks obtained by 40 students of class VIII in an examination are given below: 18,8,12,0,8,16,12,5,23,2,16,23,2,10,20,12,9,7,6,5,3,5, 13,21,13,15,20,24,1,7,21,16,13,18,23,7,3,18,17,16 Present the data in the form of a frequency distribution using the same class size, one such class being 15-20 (where 20 is not included).
View SolutionThe marks scored by 40 students of class VIII in mathematics are given below: 81,55,68,79,85,43,29,68,54,73,47,35,72,64,95,44,50,77,64, 35,79,52,45,54,70,83,62,64,72,92,84,76,63,43,54,38,73,68,52,54. Prepare a frequency distribution with class size of 10 marks.
View SolutionIf r% of students scored less than 33 marks, then find r, given N=50, class size=10, frequency of the rth. Percentile class =12 and cumulative frequency of the rth percentile class =22, lower limit of rth percentile class =30
View Solution
