Consider the following population and year graph: find the slope of the line AB and using it find what will be the population in the year 2010.
To solve the problem step-by-step, we will find the slope of the line AB and then use it to estimate the population in the year 2010.
Step 1: Identify the Points on the Graph
From the problem, we have two points:
- Point A (1985, 92)
- Point B (1995, 97)
Step 2: Calculate the Slope of Line AB
The formula for the slope (m) between two points (x1, y1) and (x2, y2) is given by:
m=y2−y1x2−x1
Substituting the coordinates of points A and B:
- x1=1985, y1=92
- x2=1995, y2=97
m=97−921995−1985=510=12
Step 3: Use the Slope to Predict the Population in 2010
Next, we need to find the population in the year 2010. We can denote this population as y and the year as x=2010.
Using the slope of line AB, we can set up the equation for the slope between points B (1995, 97) and C (2010, y):
slope of BC=y−972010−1995
Since the slope of AB is equal to the slope of BC, we have:
y−972010−1995=12
Substituting 2010−1995=15:
y−9715=12
Step 4: Solve for y
Cross-multiplying gives us:
2(y−97)=15
Expanding this:
2y−194=15
Adding 194 to both sides:
2y=209
Dividing by 2:
y=2092=104.5
Conclusion
Thus, the predicted population in the year 2010 is 104.5 crores.
---
From the problem, we have two points:
- Point A (1985, 92)
- Point B (1995, 97)
The formula for the slope (m) between two points (x1, y1) and (x2, y2) is given by:
- x2=1995, y2=97
Next, we need to find the population in the year 2010. We can denote this population as y and the year as x=2010.
Cross-multiplying gives us:
Thus, the predicted population in the year 2010 is 104.5 crores.
Topper's Solved these Questions
Similar Questions
Knowledge Check
A population has more young individuals compared to the older individuals. What would be the status of the population after some years ?
AIt will declineBIt will stabiliseCIt will increaseDIt will first decline and then stabilise
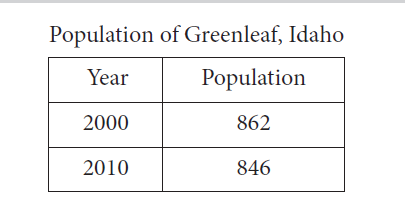
Population of Greenleaf, Idaho

The table above shows the population of Greenleaf, Idaho, for the years 2000 and 2010. If the relationship between population and year is linear, which of the following functions P models the population of Greenleaf t years after 2000?
View SolutionThe population of a city was 20,000 in the year 1997. It increased at the rate of 5% p.a. Find the population at the end of the year 2000.
View SolutionA population has more young individuals compared to the older individuals. What would be the status of the population after some years ?
View SolutionThe present population of a town is 28000. If it increases at the rate of 5% per annum, what will be its population after 2 years?
View SolutionA population has more young individuals compared to the older individuals. What would be the status of the population after some years ?
View SolutionA population has more young individuals compared to the older individuals. What would be the status of the population after some years ?
View SolutionThe population of a village increases continuously at the rate proportional to the number of its inhabitants present at any time. If the population of the village was 20, 000 in 1999 and 25000 in the year 2004, what will be the population of the village in 2009?
View Solution
