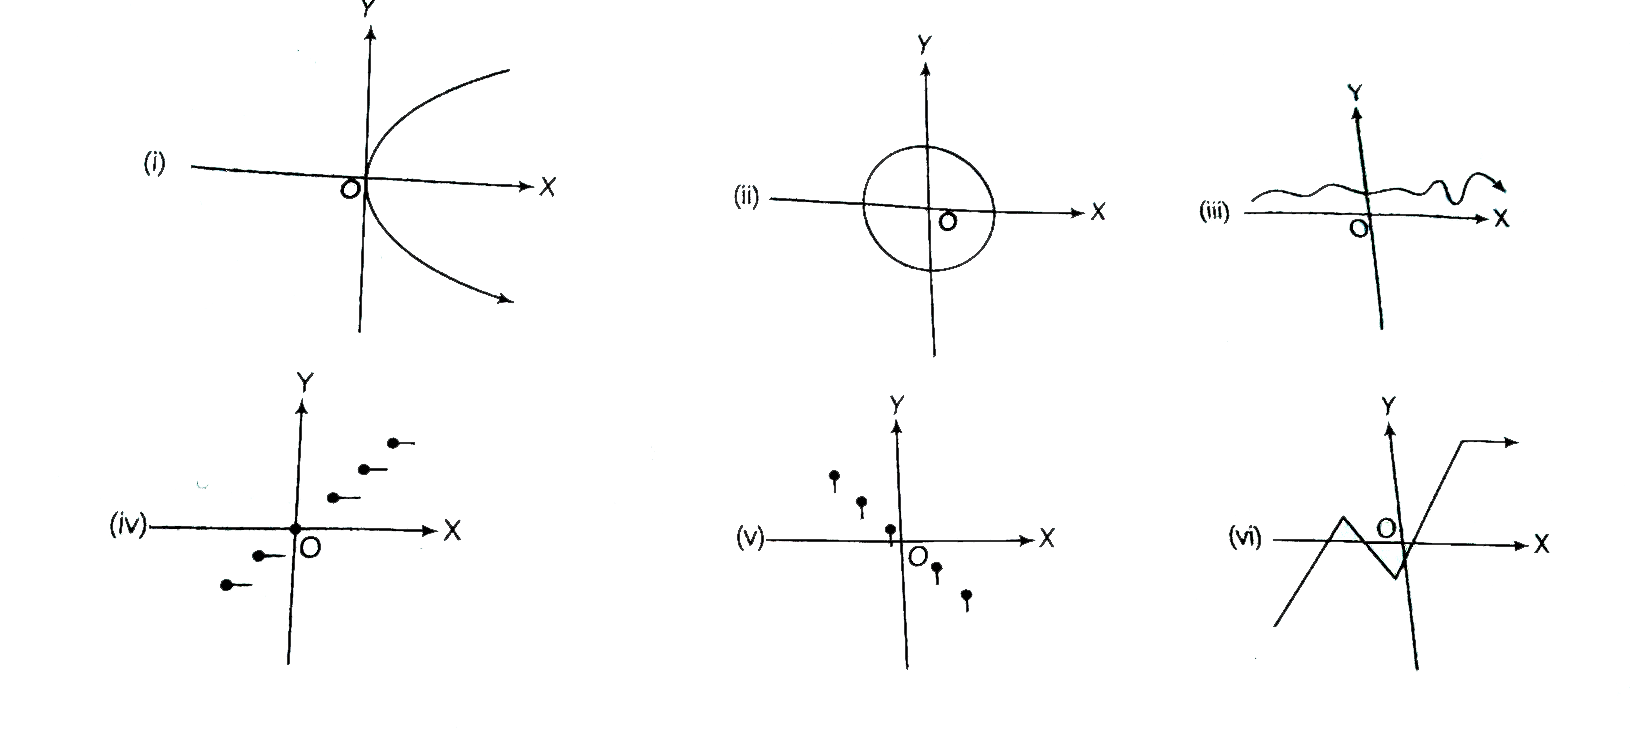
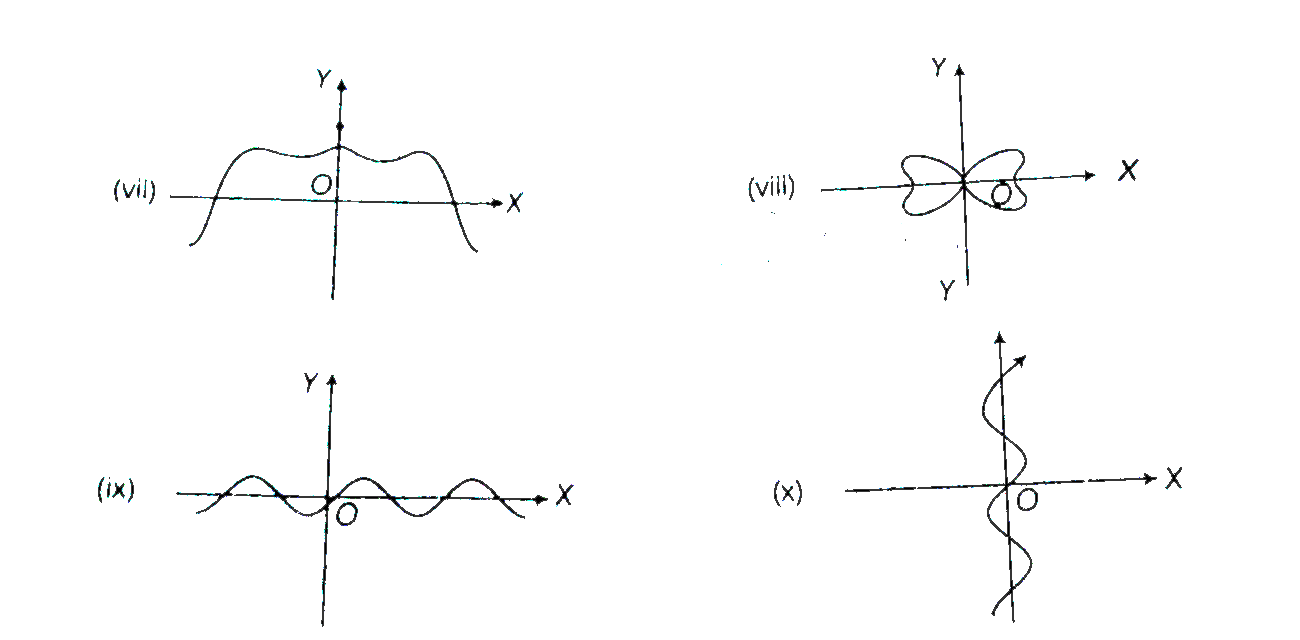
Which one of the following graphs represent a function? (FIGURE)
To determine which of the given graphs represents a function, we can use the vertical line test. A graph represents a function if any vertical line intersects the graph at most once. Here’s a step-by-step solution:
1. Understand the Definition of a Function:
A function is a relation where each input (x-value) has exactly one output (y-value).
Hint: Remember that for a relation to be a function, no x-value can correspond to more than one y-value.
2. Identify the Graphs:
Look at the provided graphs and identify the shapes and patterns of each graph.
Hint: Pay attention to how the lines or curves behave across the x-axis.
3. Apply the Vertical Line Test:
For each graph, imagine drawing vertical lines (or use a ruler) at various x-values. Observe how many times the vertical line intersects the graph.
Hint: If a vertical line intersects the graph more than once at any point, that graph does not represent a function.
4. Analyze Each Graph:
- If a graph is a straight line (not vertical), it typically represents a function.
- If a graph is a circle or any closed shape, it does not represent a function because a vertical line can intersect it at two points.
Hint: Look for curves or shapes that might loop back on themselves.
5. Conclude Which Graph Represents a Function:
After applying the vertical line test to all graphs, identify which graph(s) only intersect the vertical lines once.
Hint: The graph that passes the vertical line test is the one that represents a function.
Final Conclusion
Select the graph that meets the criteria of the vertical line test, indicating it represents a function.
A function is a relation where each input (x-value) has exactly one output (y-value).
Look at the provided graphs and identify the shapes and patterns of each graph.
For each graph, imagine drawing vertical lines (or use a ruler) at various x-values. Observe how many times the vertical line intersects the graph.
- If a graph is a straight line (not vertical), it typically represents a function.
- If a graph is a circle or any closed shape, it does not represent a function because a vertical line can intersect it at two points.
After applying the vertical line test to all graphs, identify which graph(s) only intersect the vertical lines once.
Select the graph that meets the criteria of the vertical line test, indicating it represents a function.
Topper's Solved these Questions
Similar Questions
Knowledge Check
A function f(x) is defined as even if and only if f(x)=f(−x) for all real values of x. Which one of the following graphs represents an even function f(x) ?
A B
B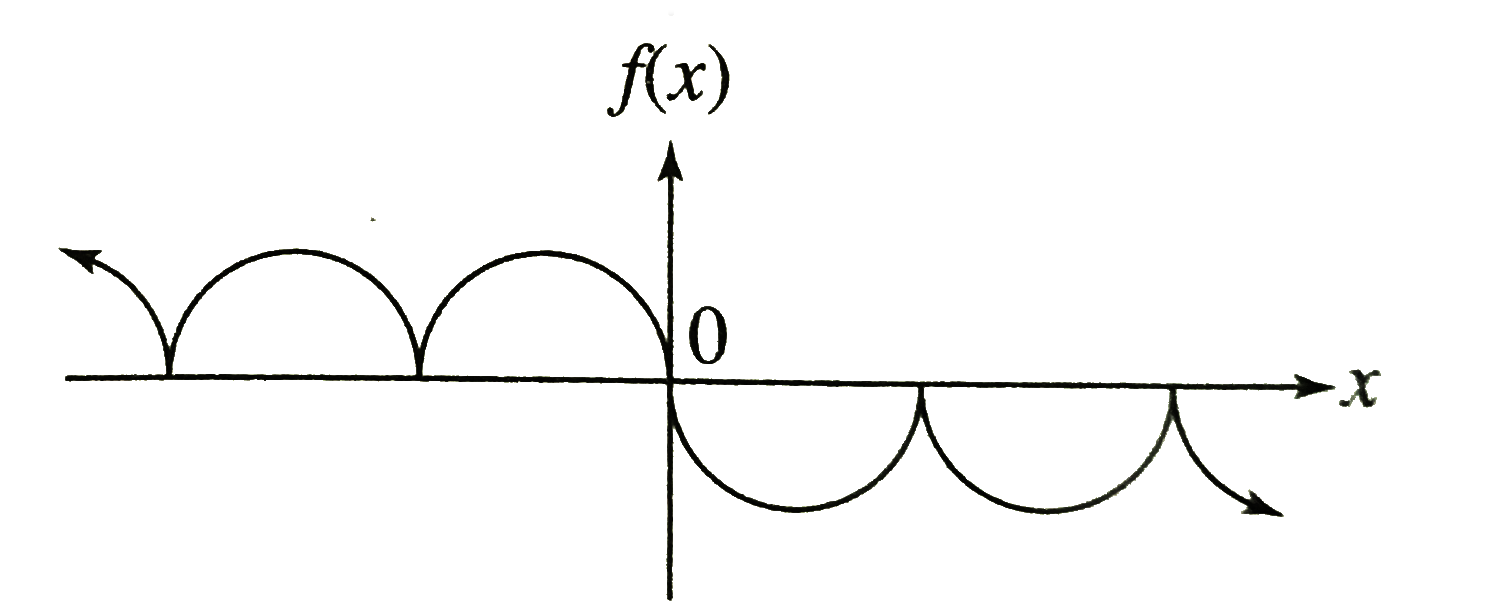 C
C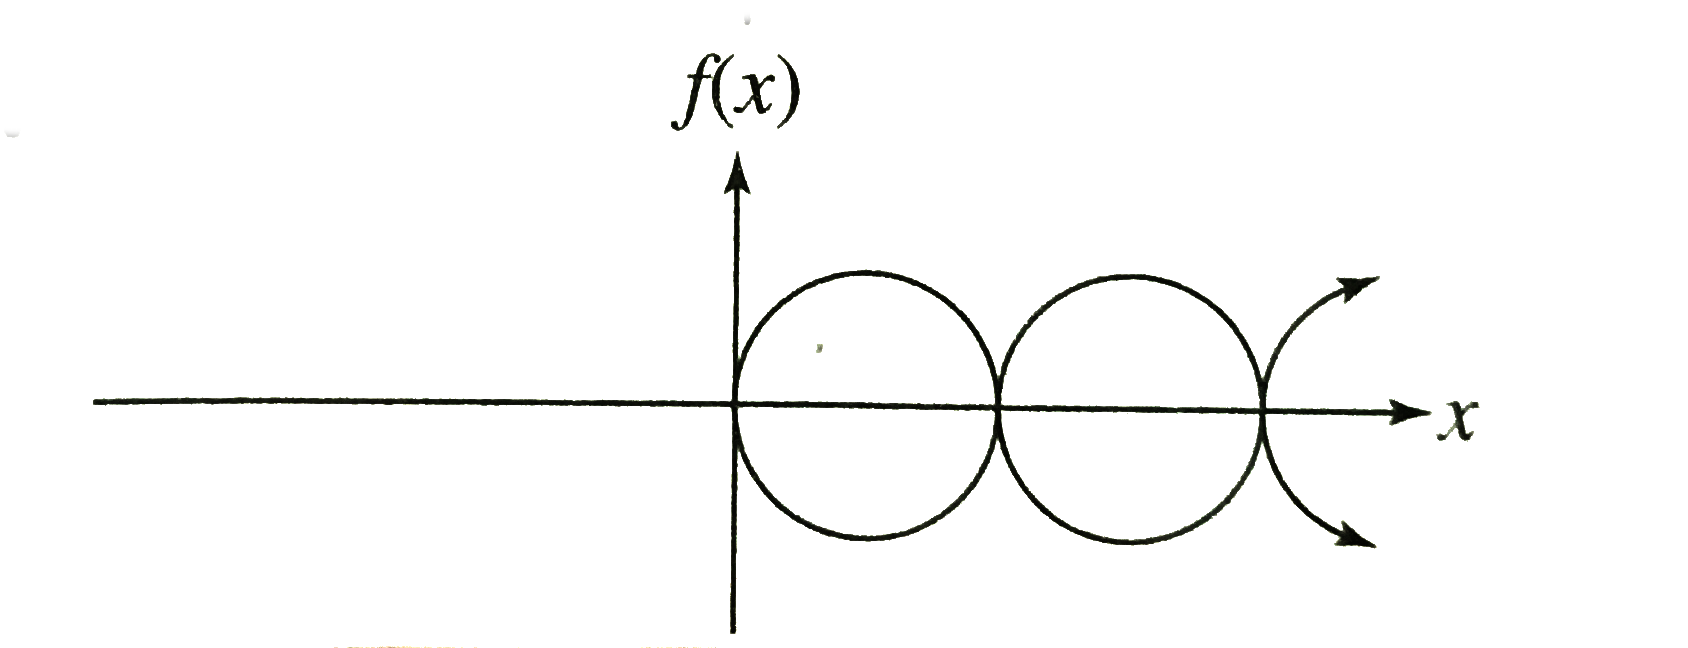 D
D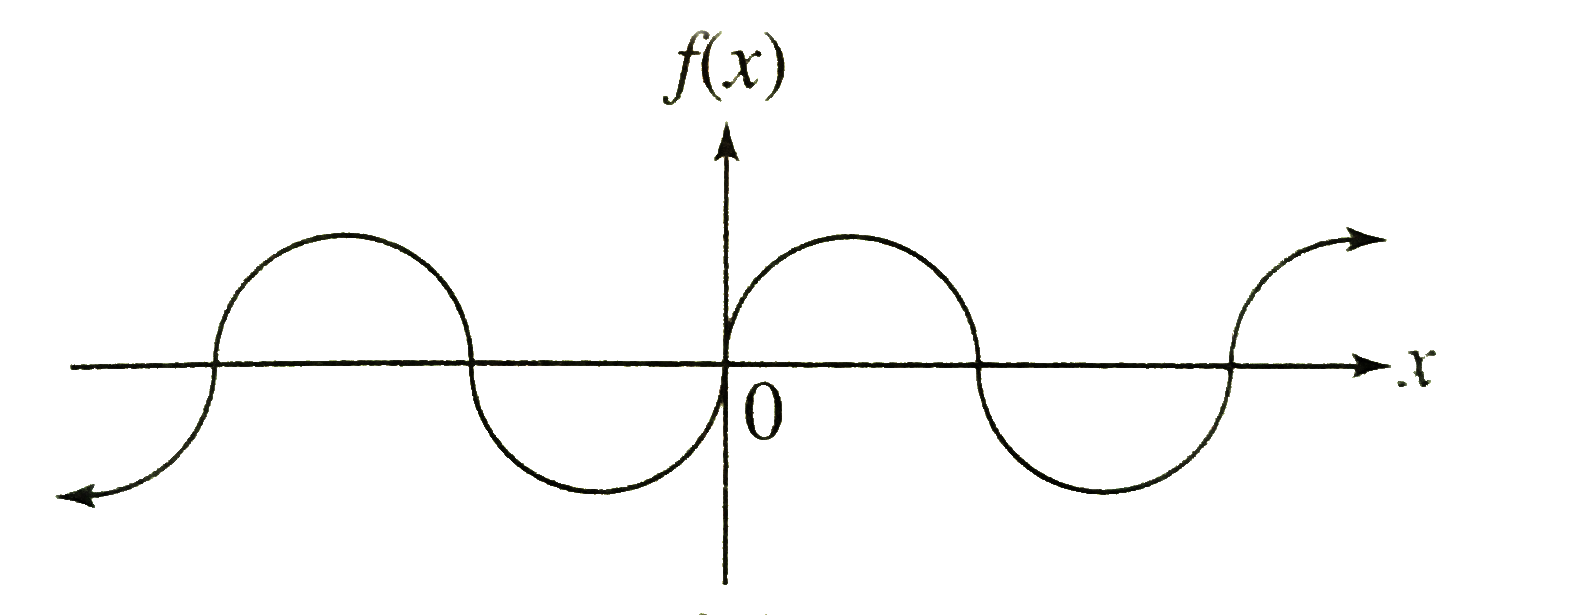
Which of the following graphs is NOT a function ?
A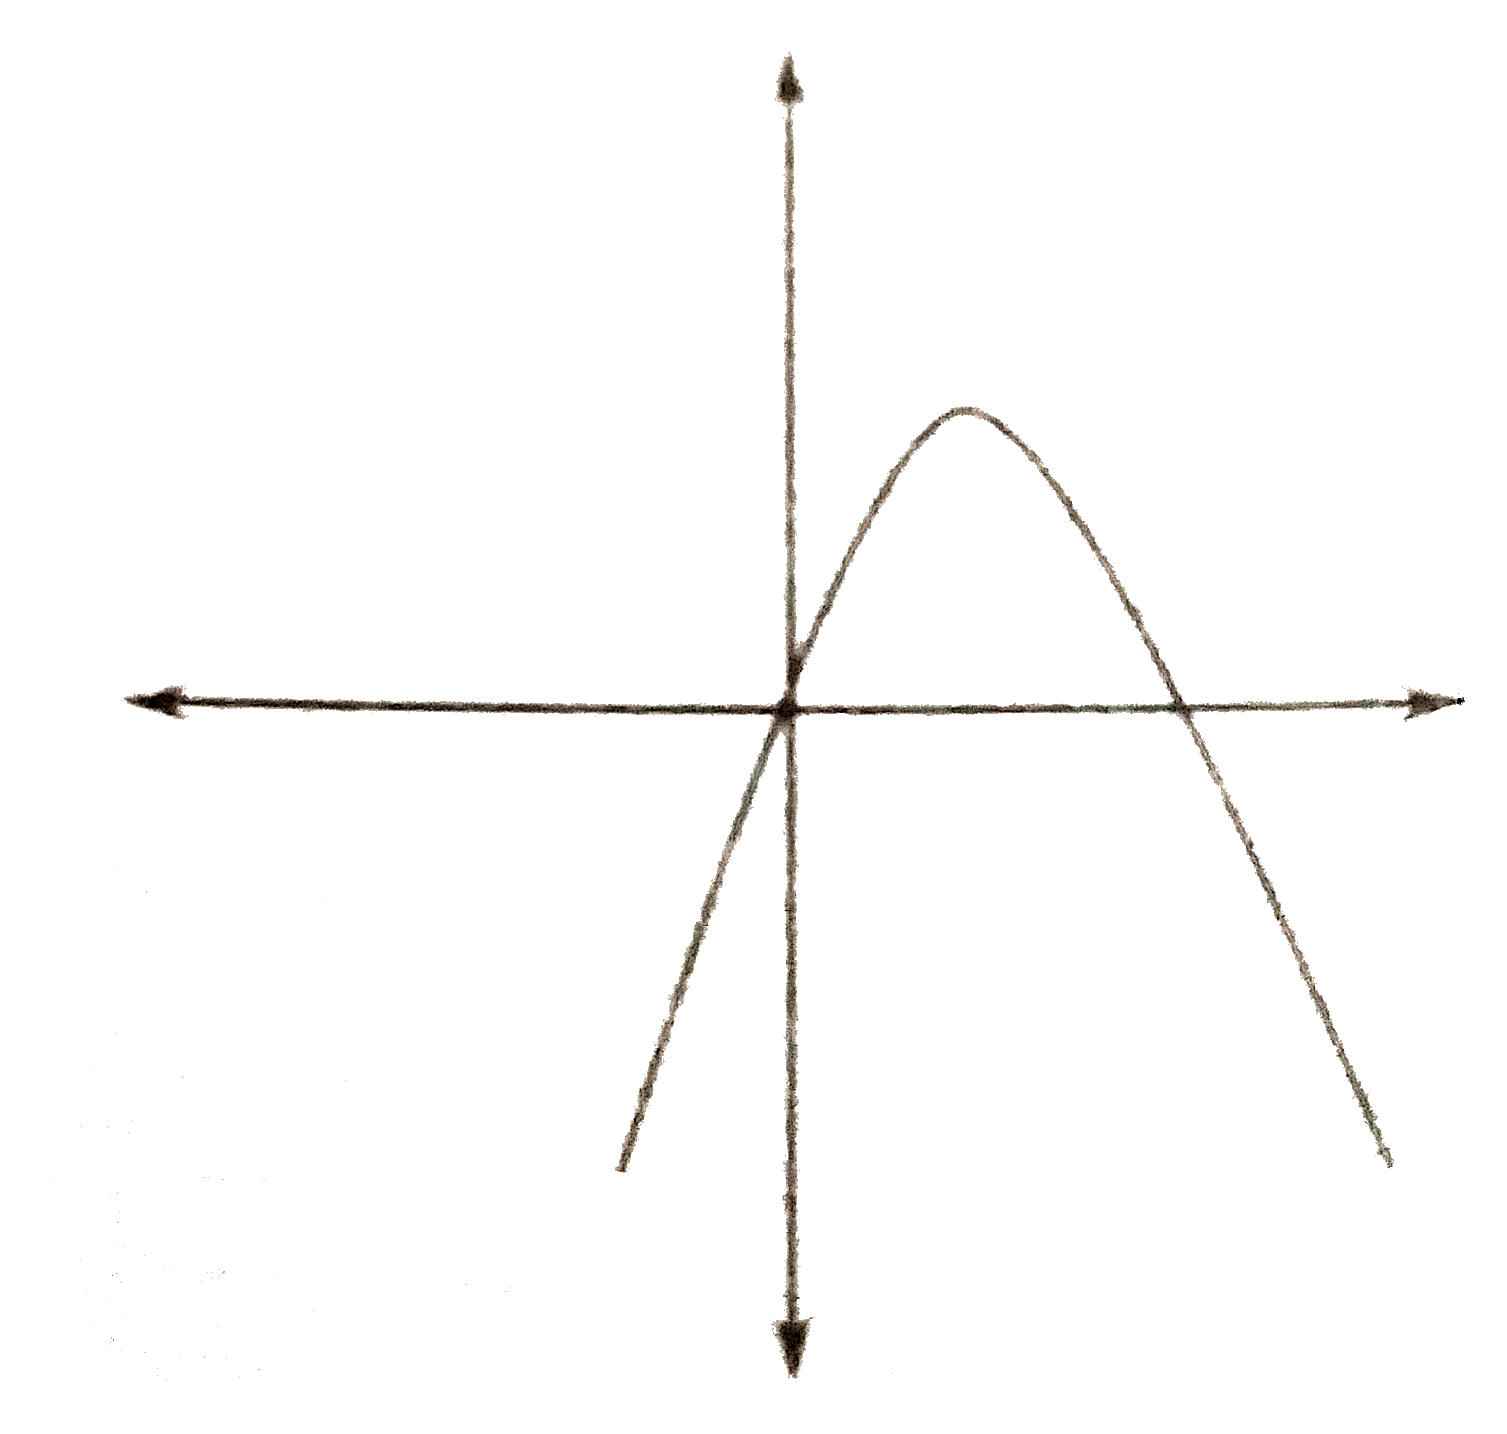 B
B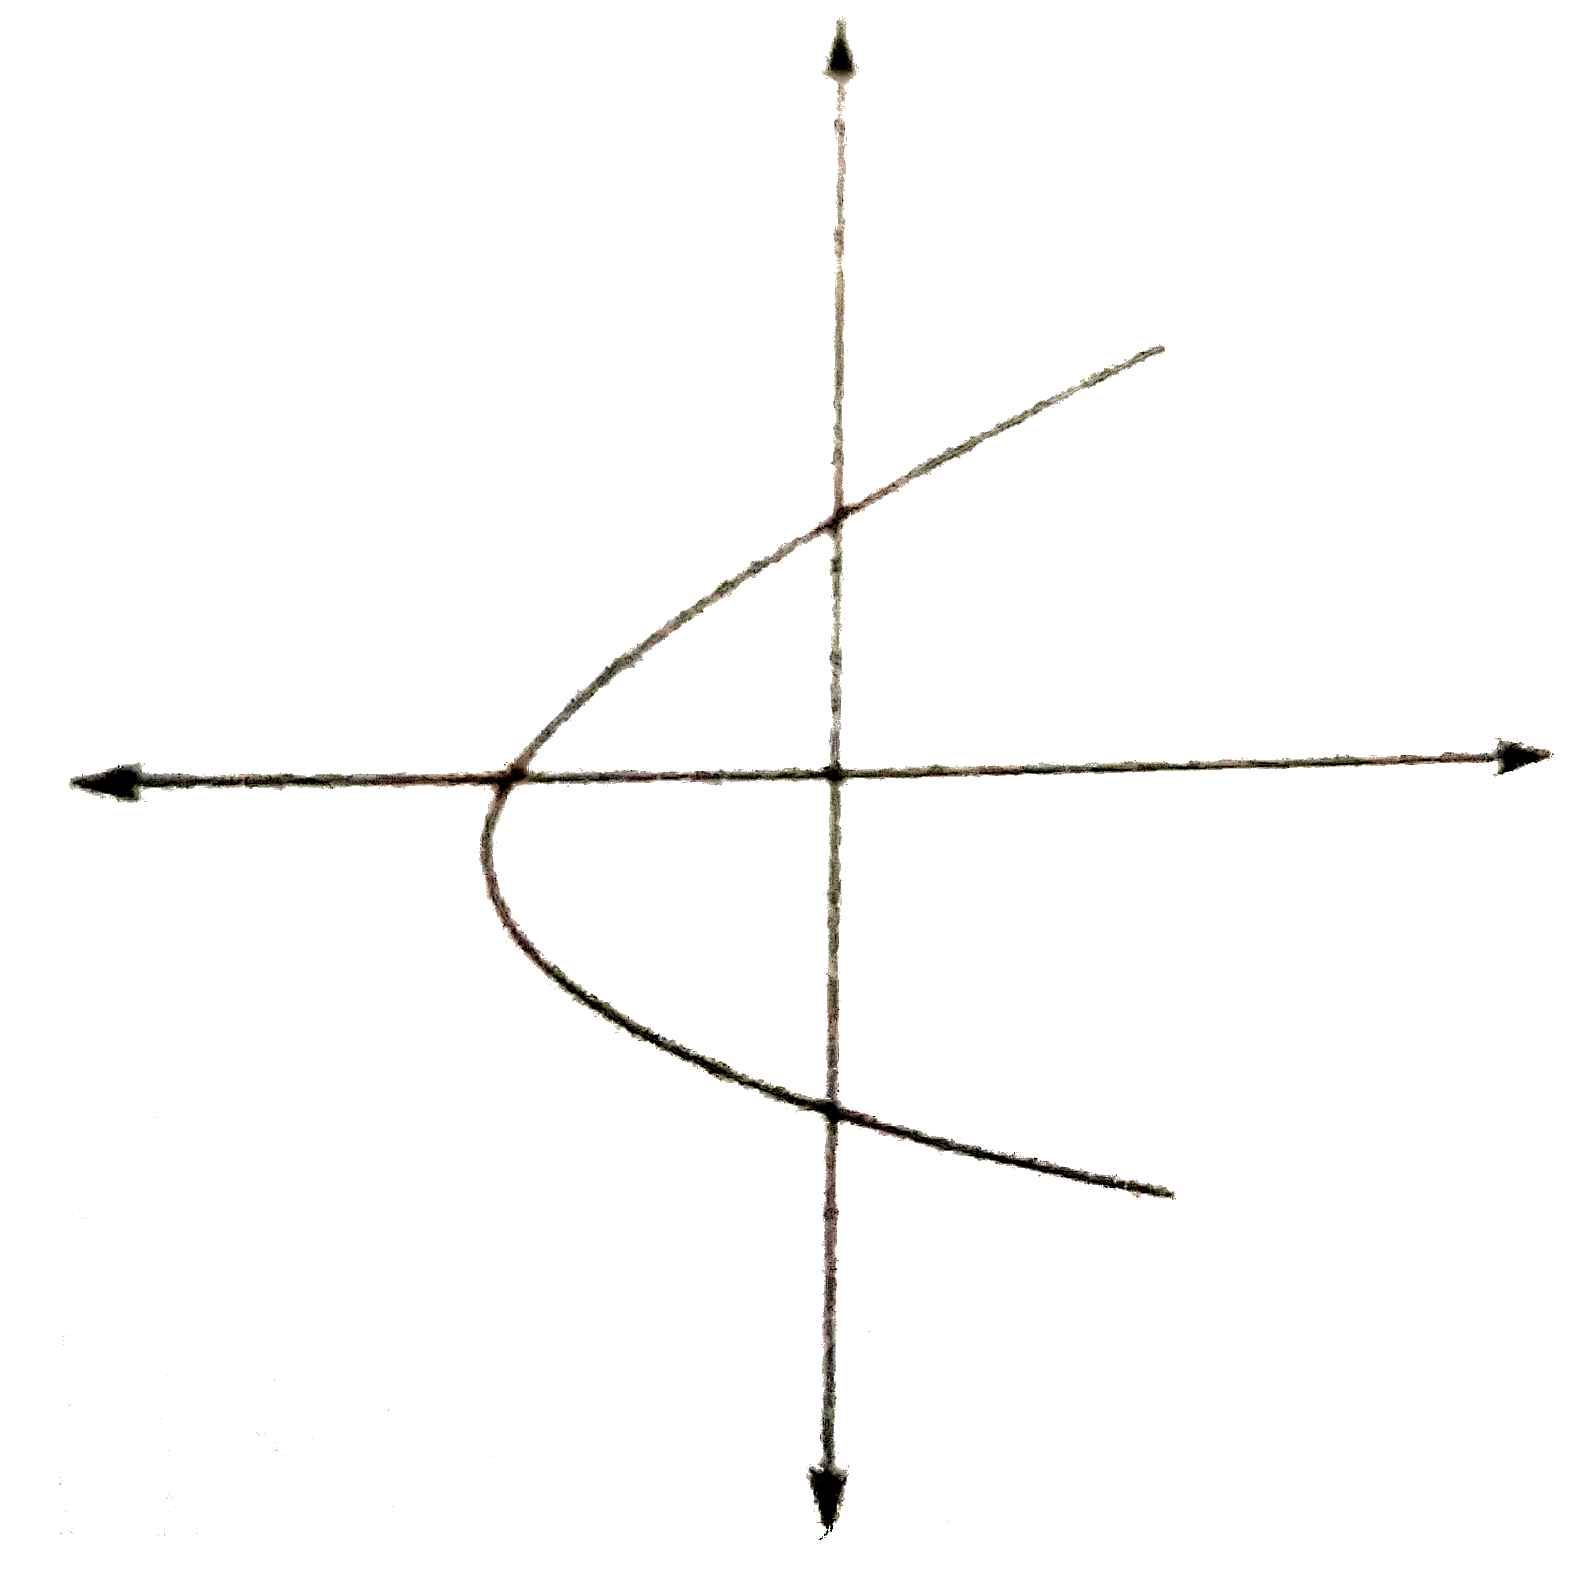 C
C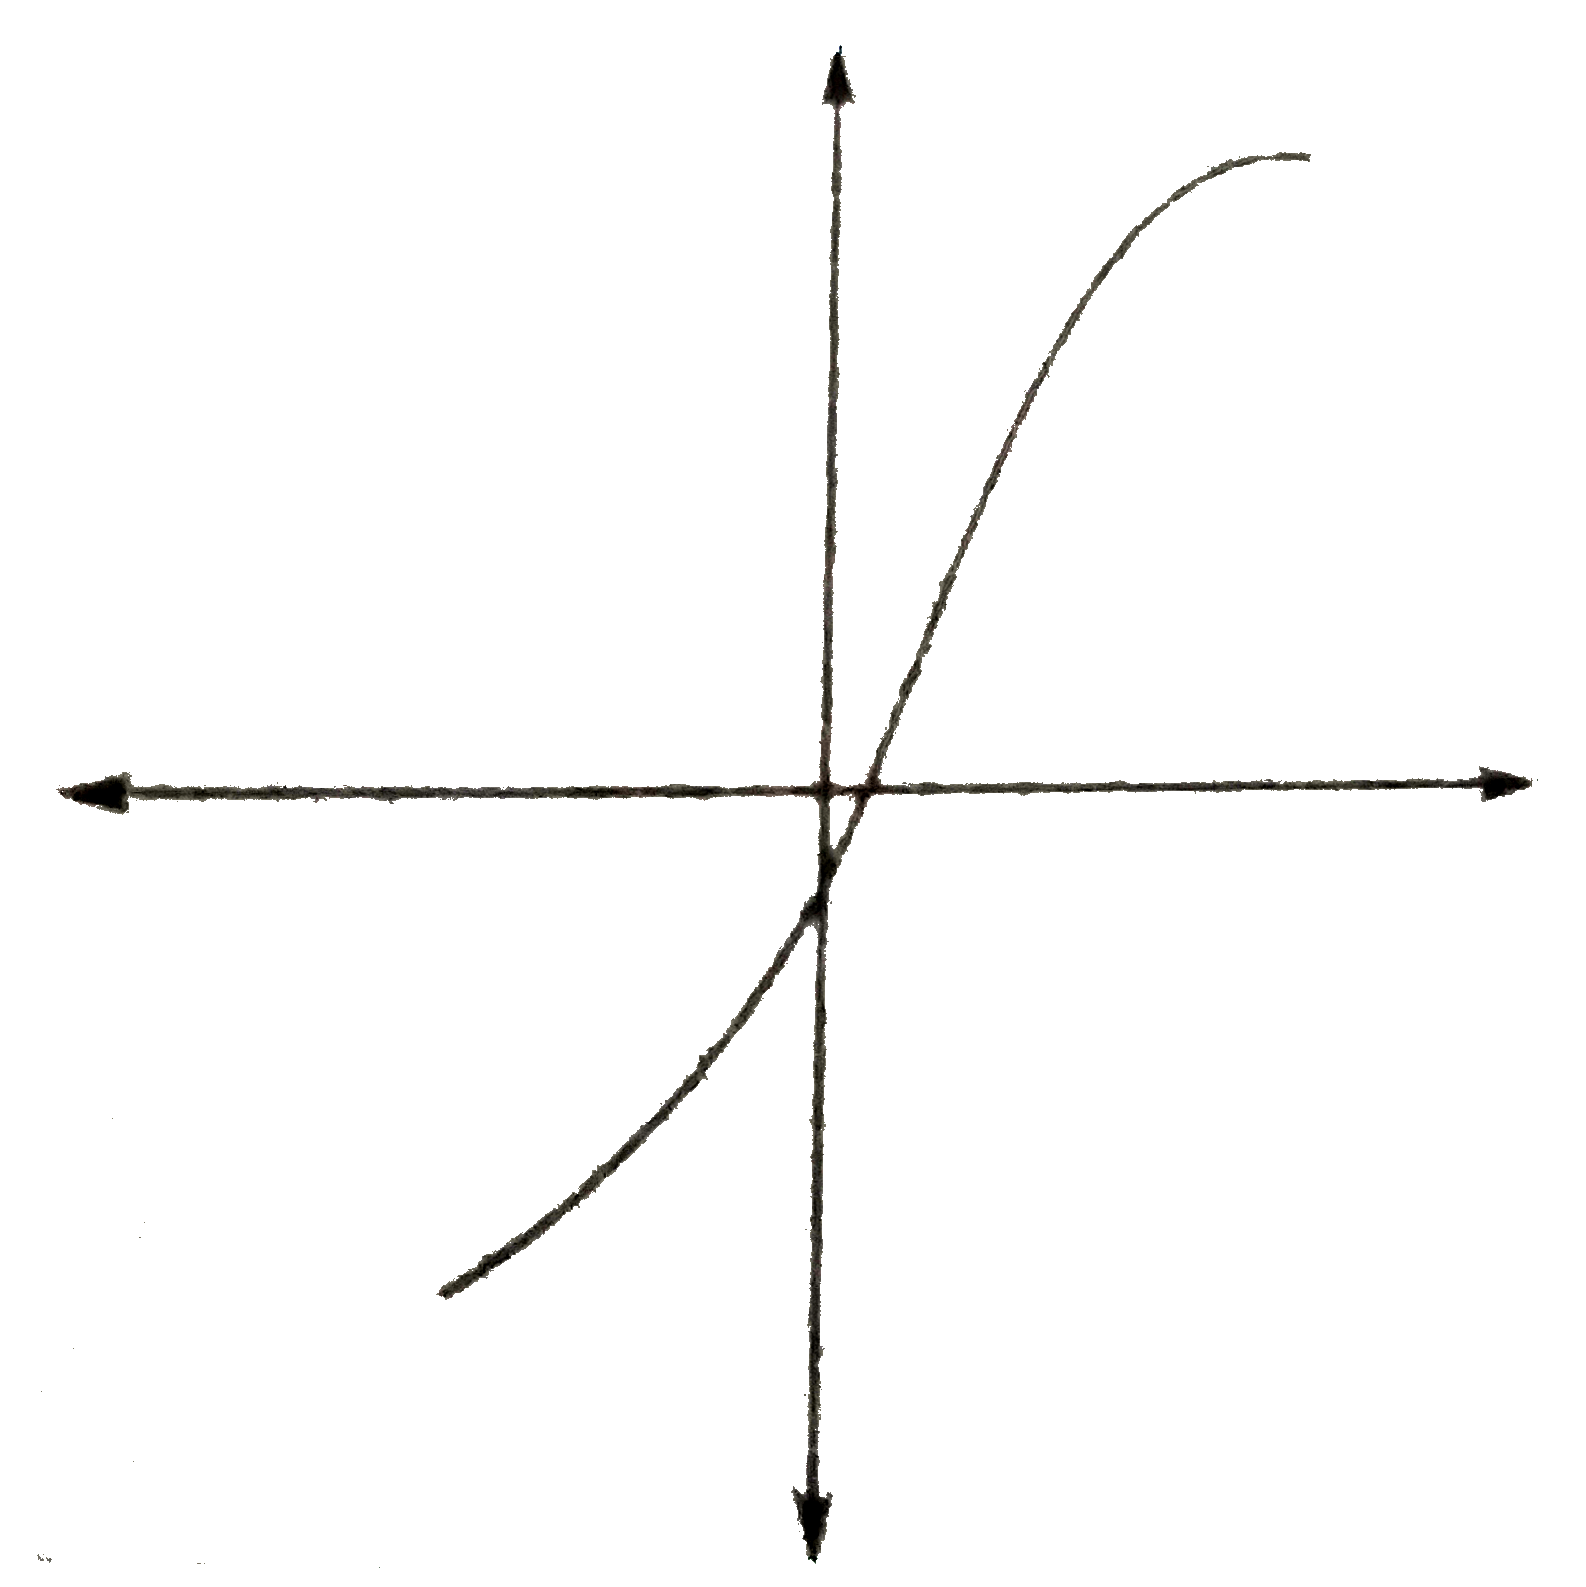 D
D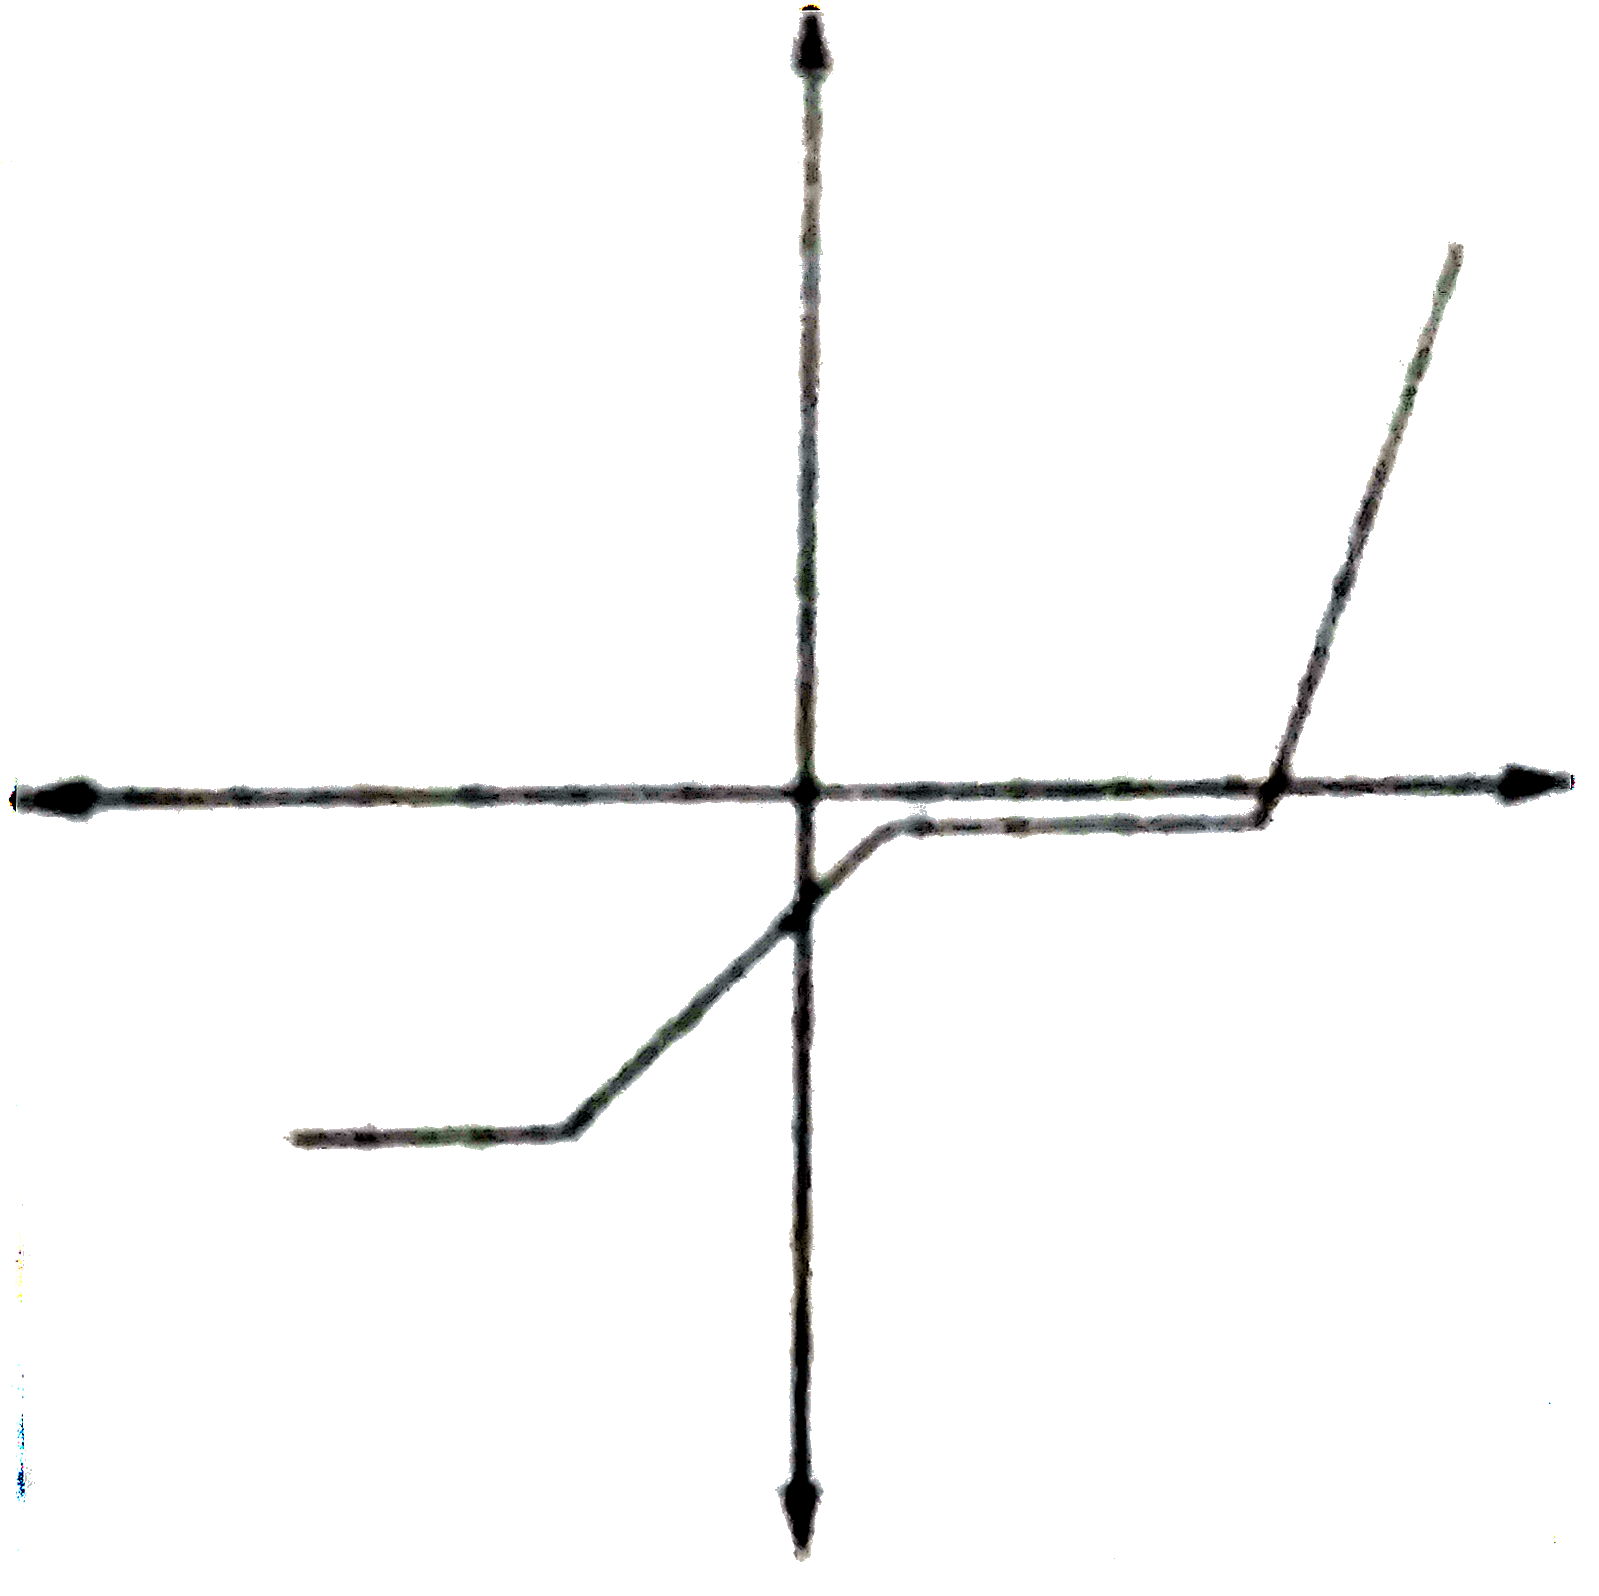
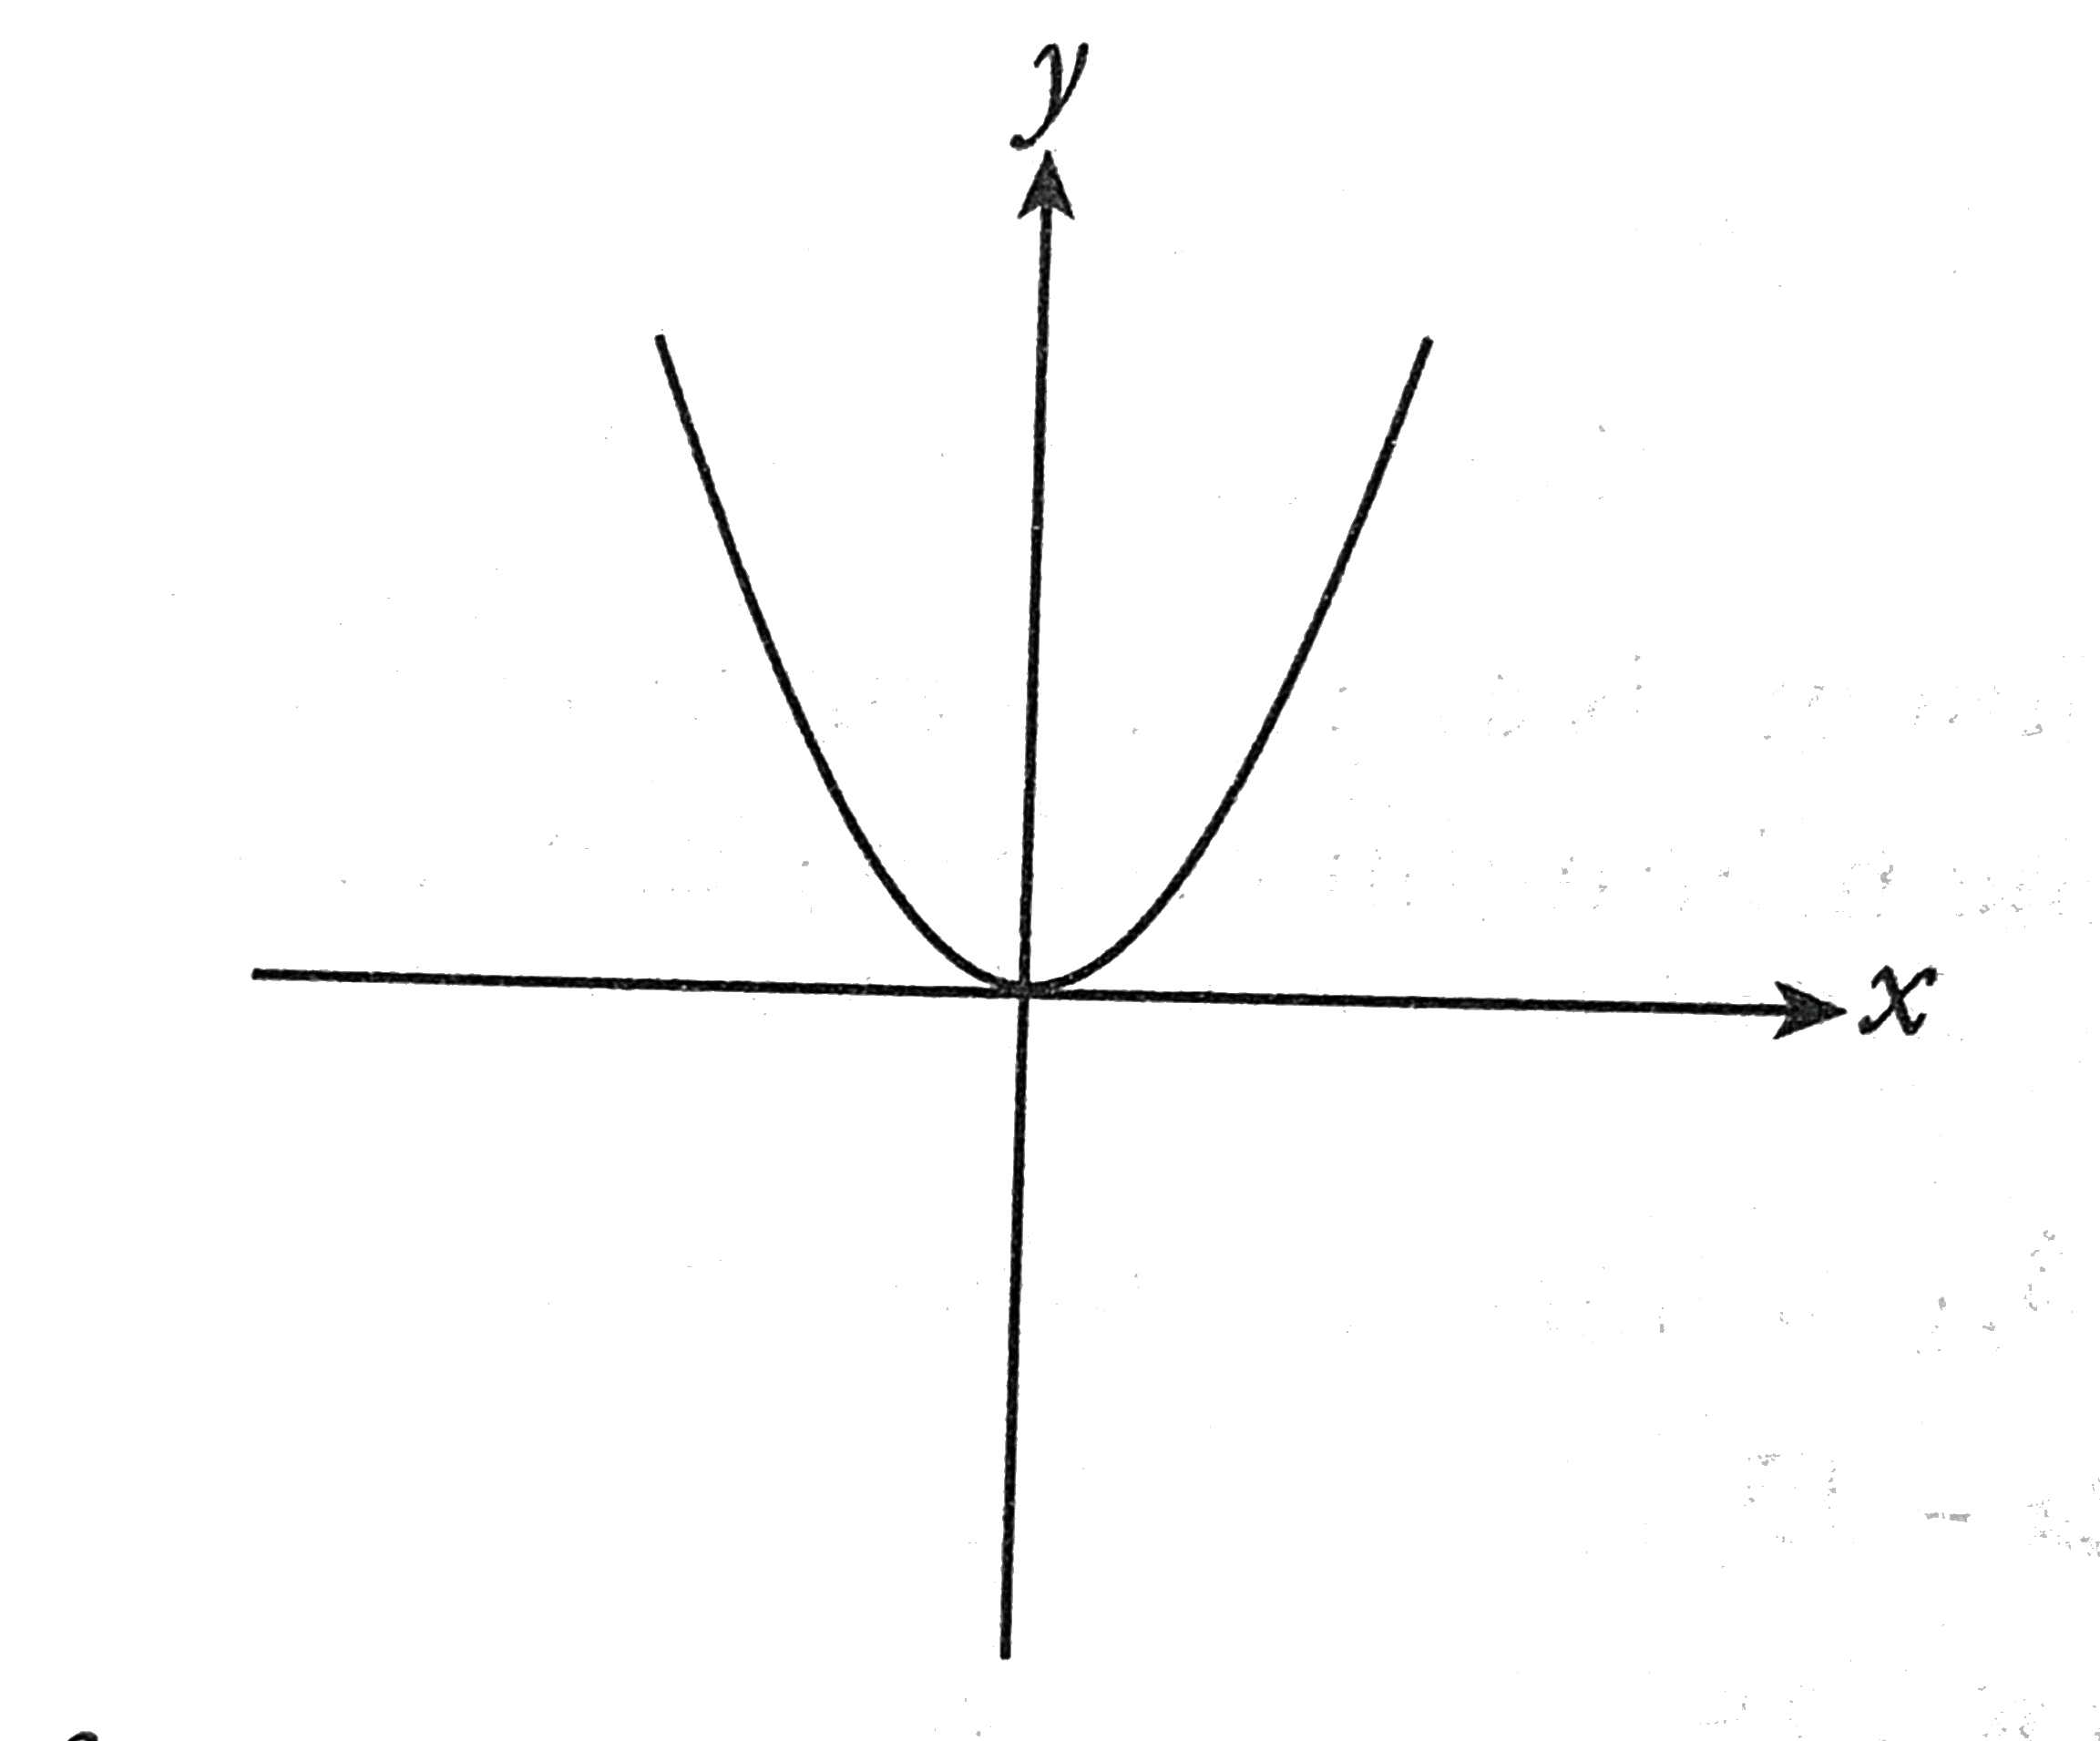
The quadratic y=f(x) is shown above. Which of the following graphs represents the function y=f(x+3)−4?A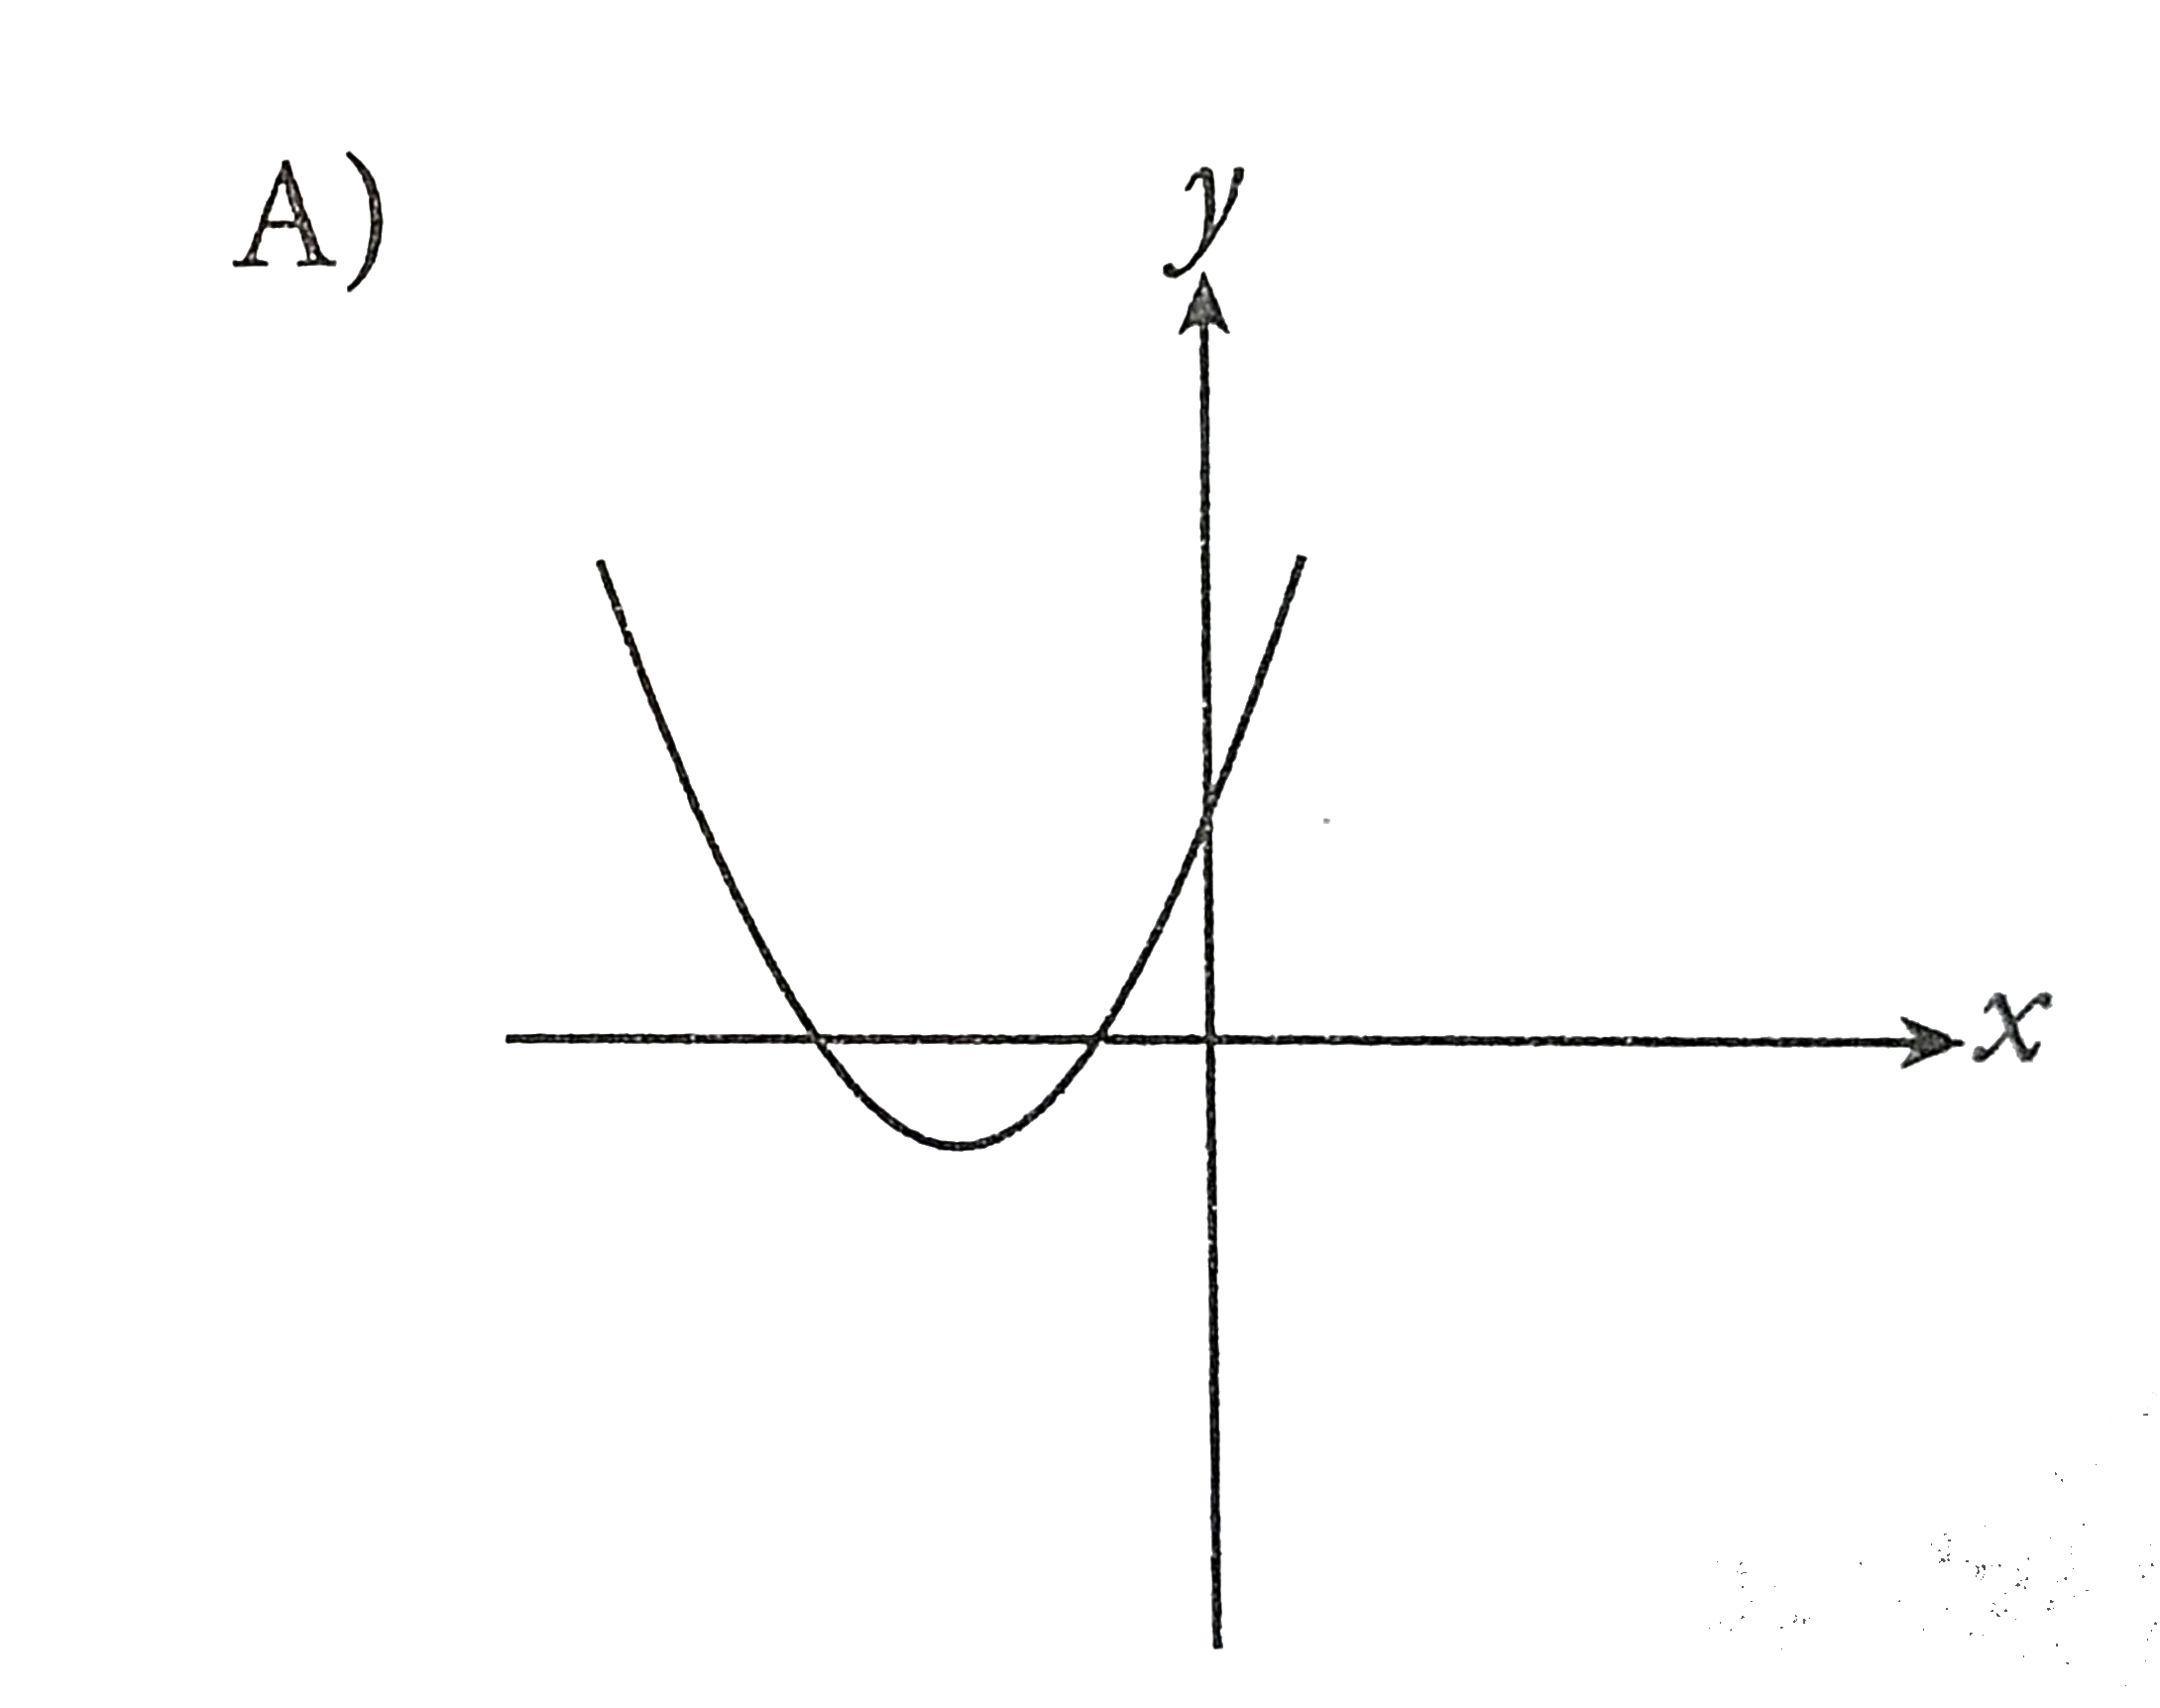 B
B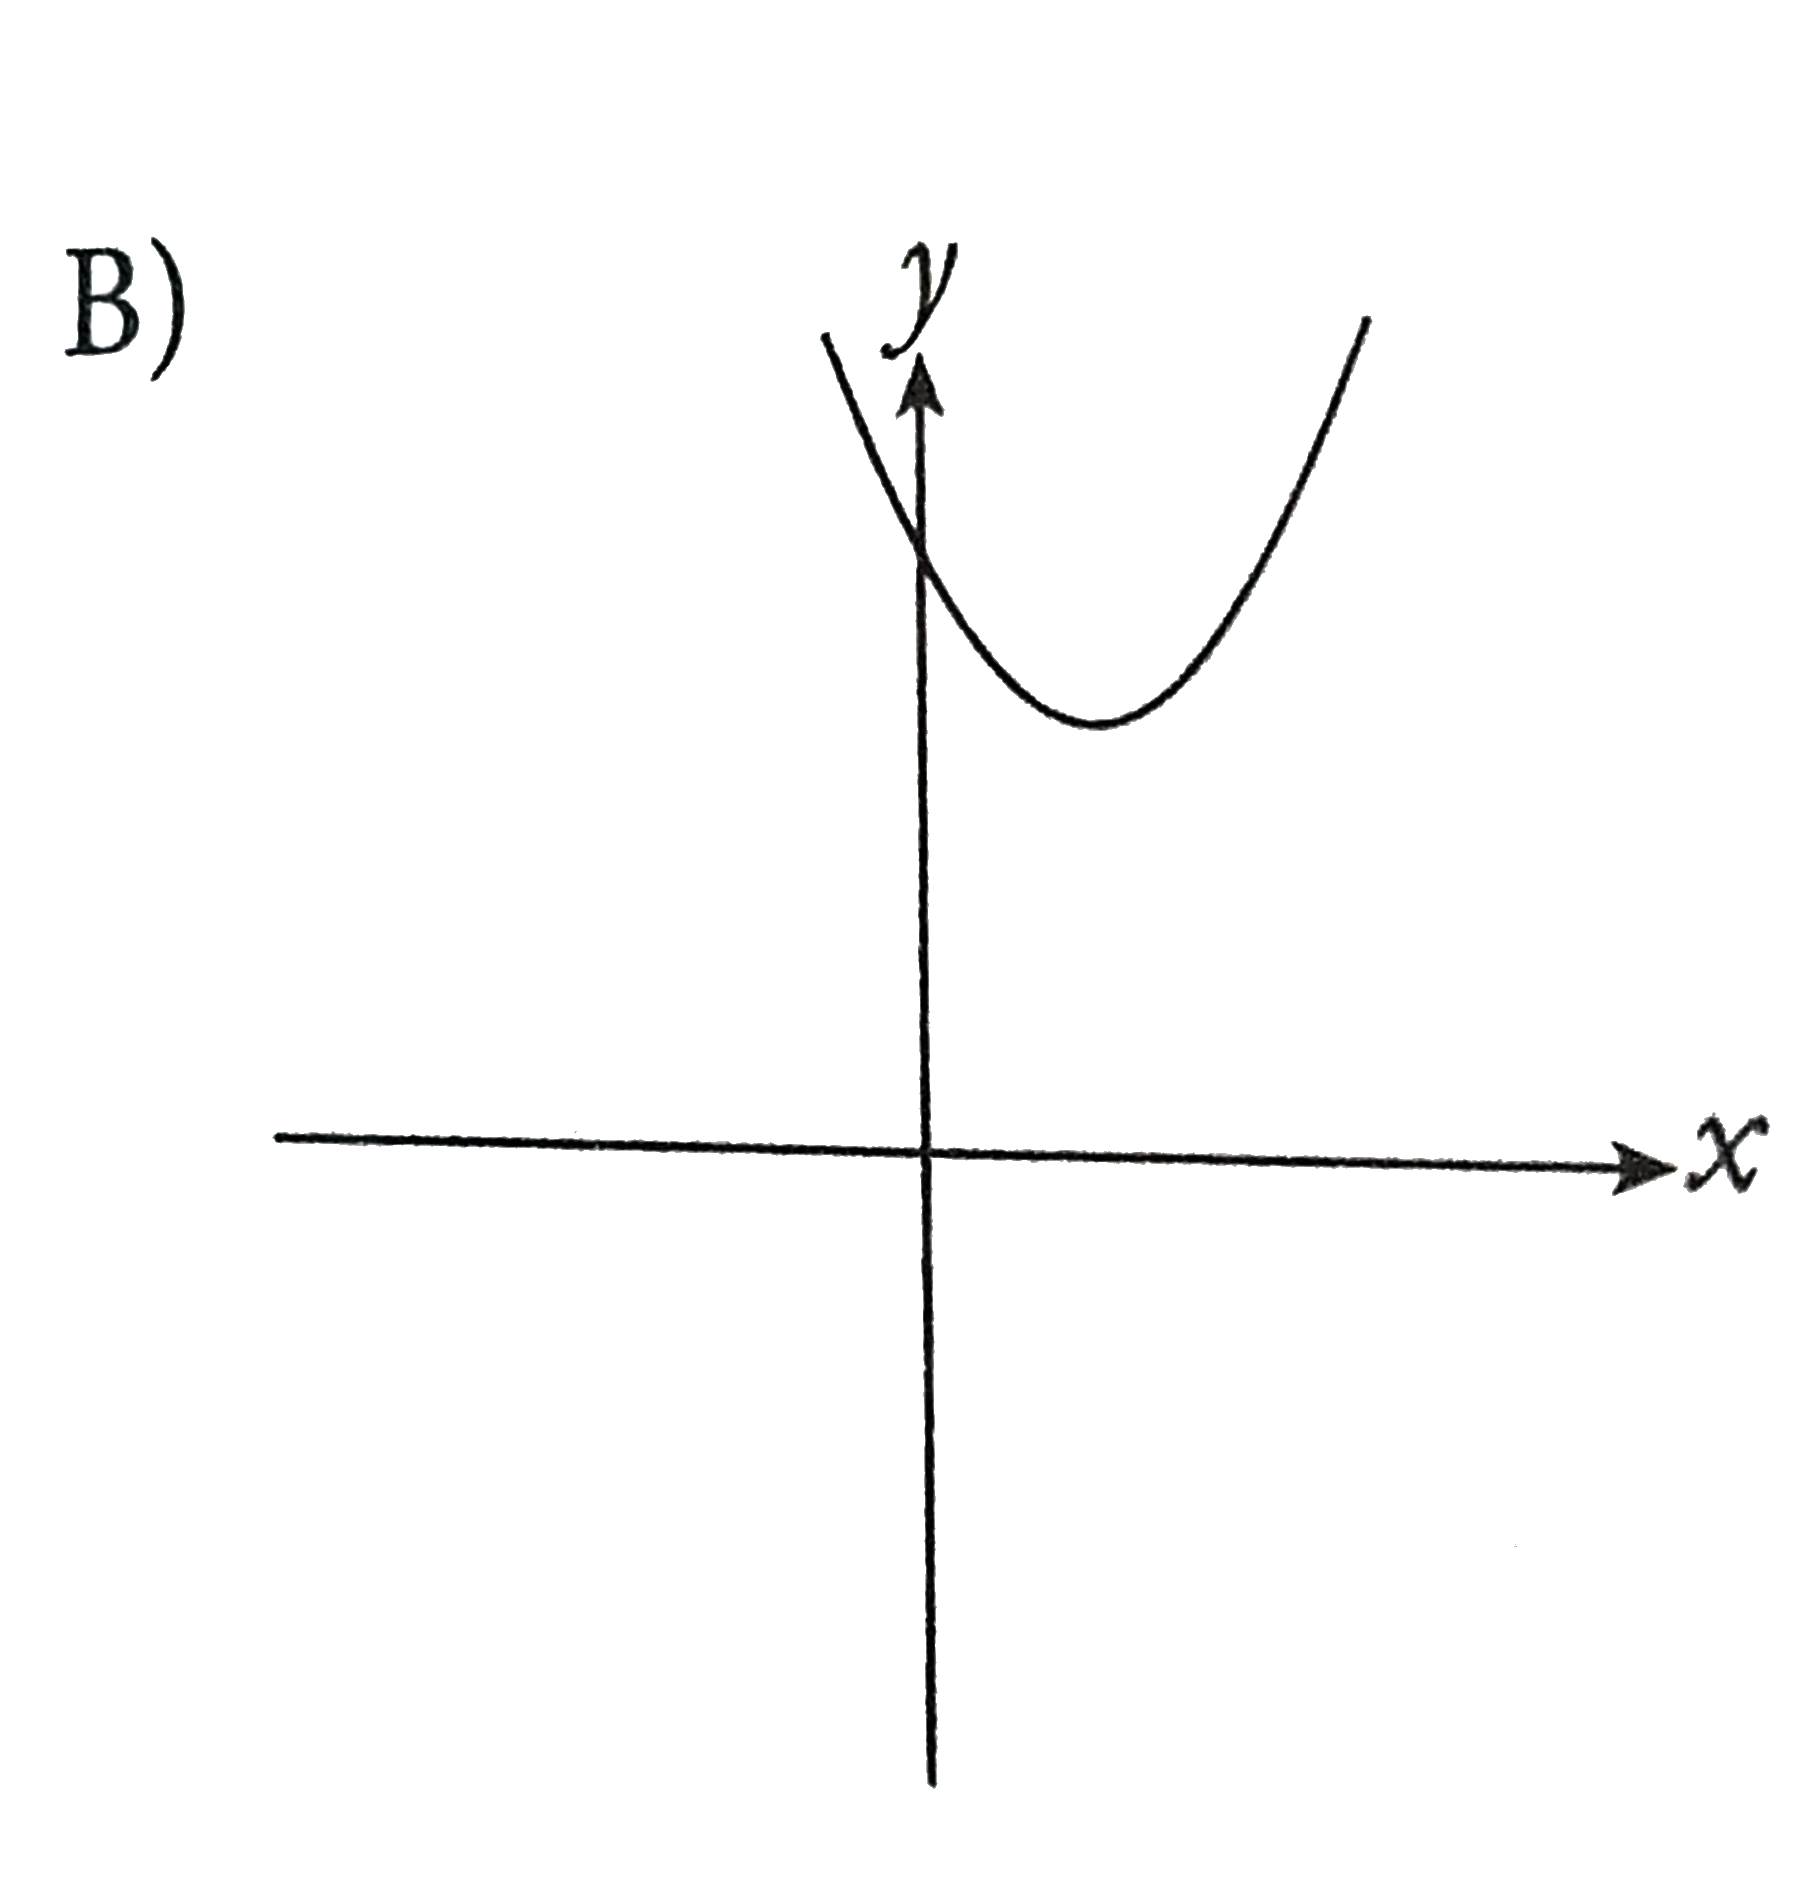 C
C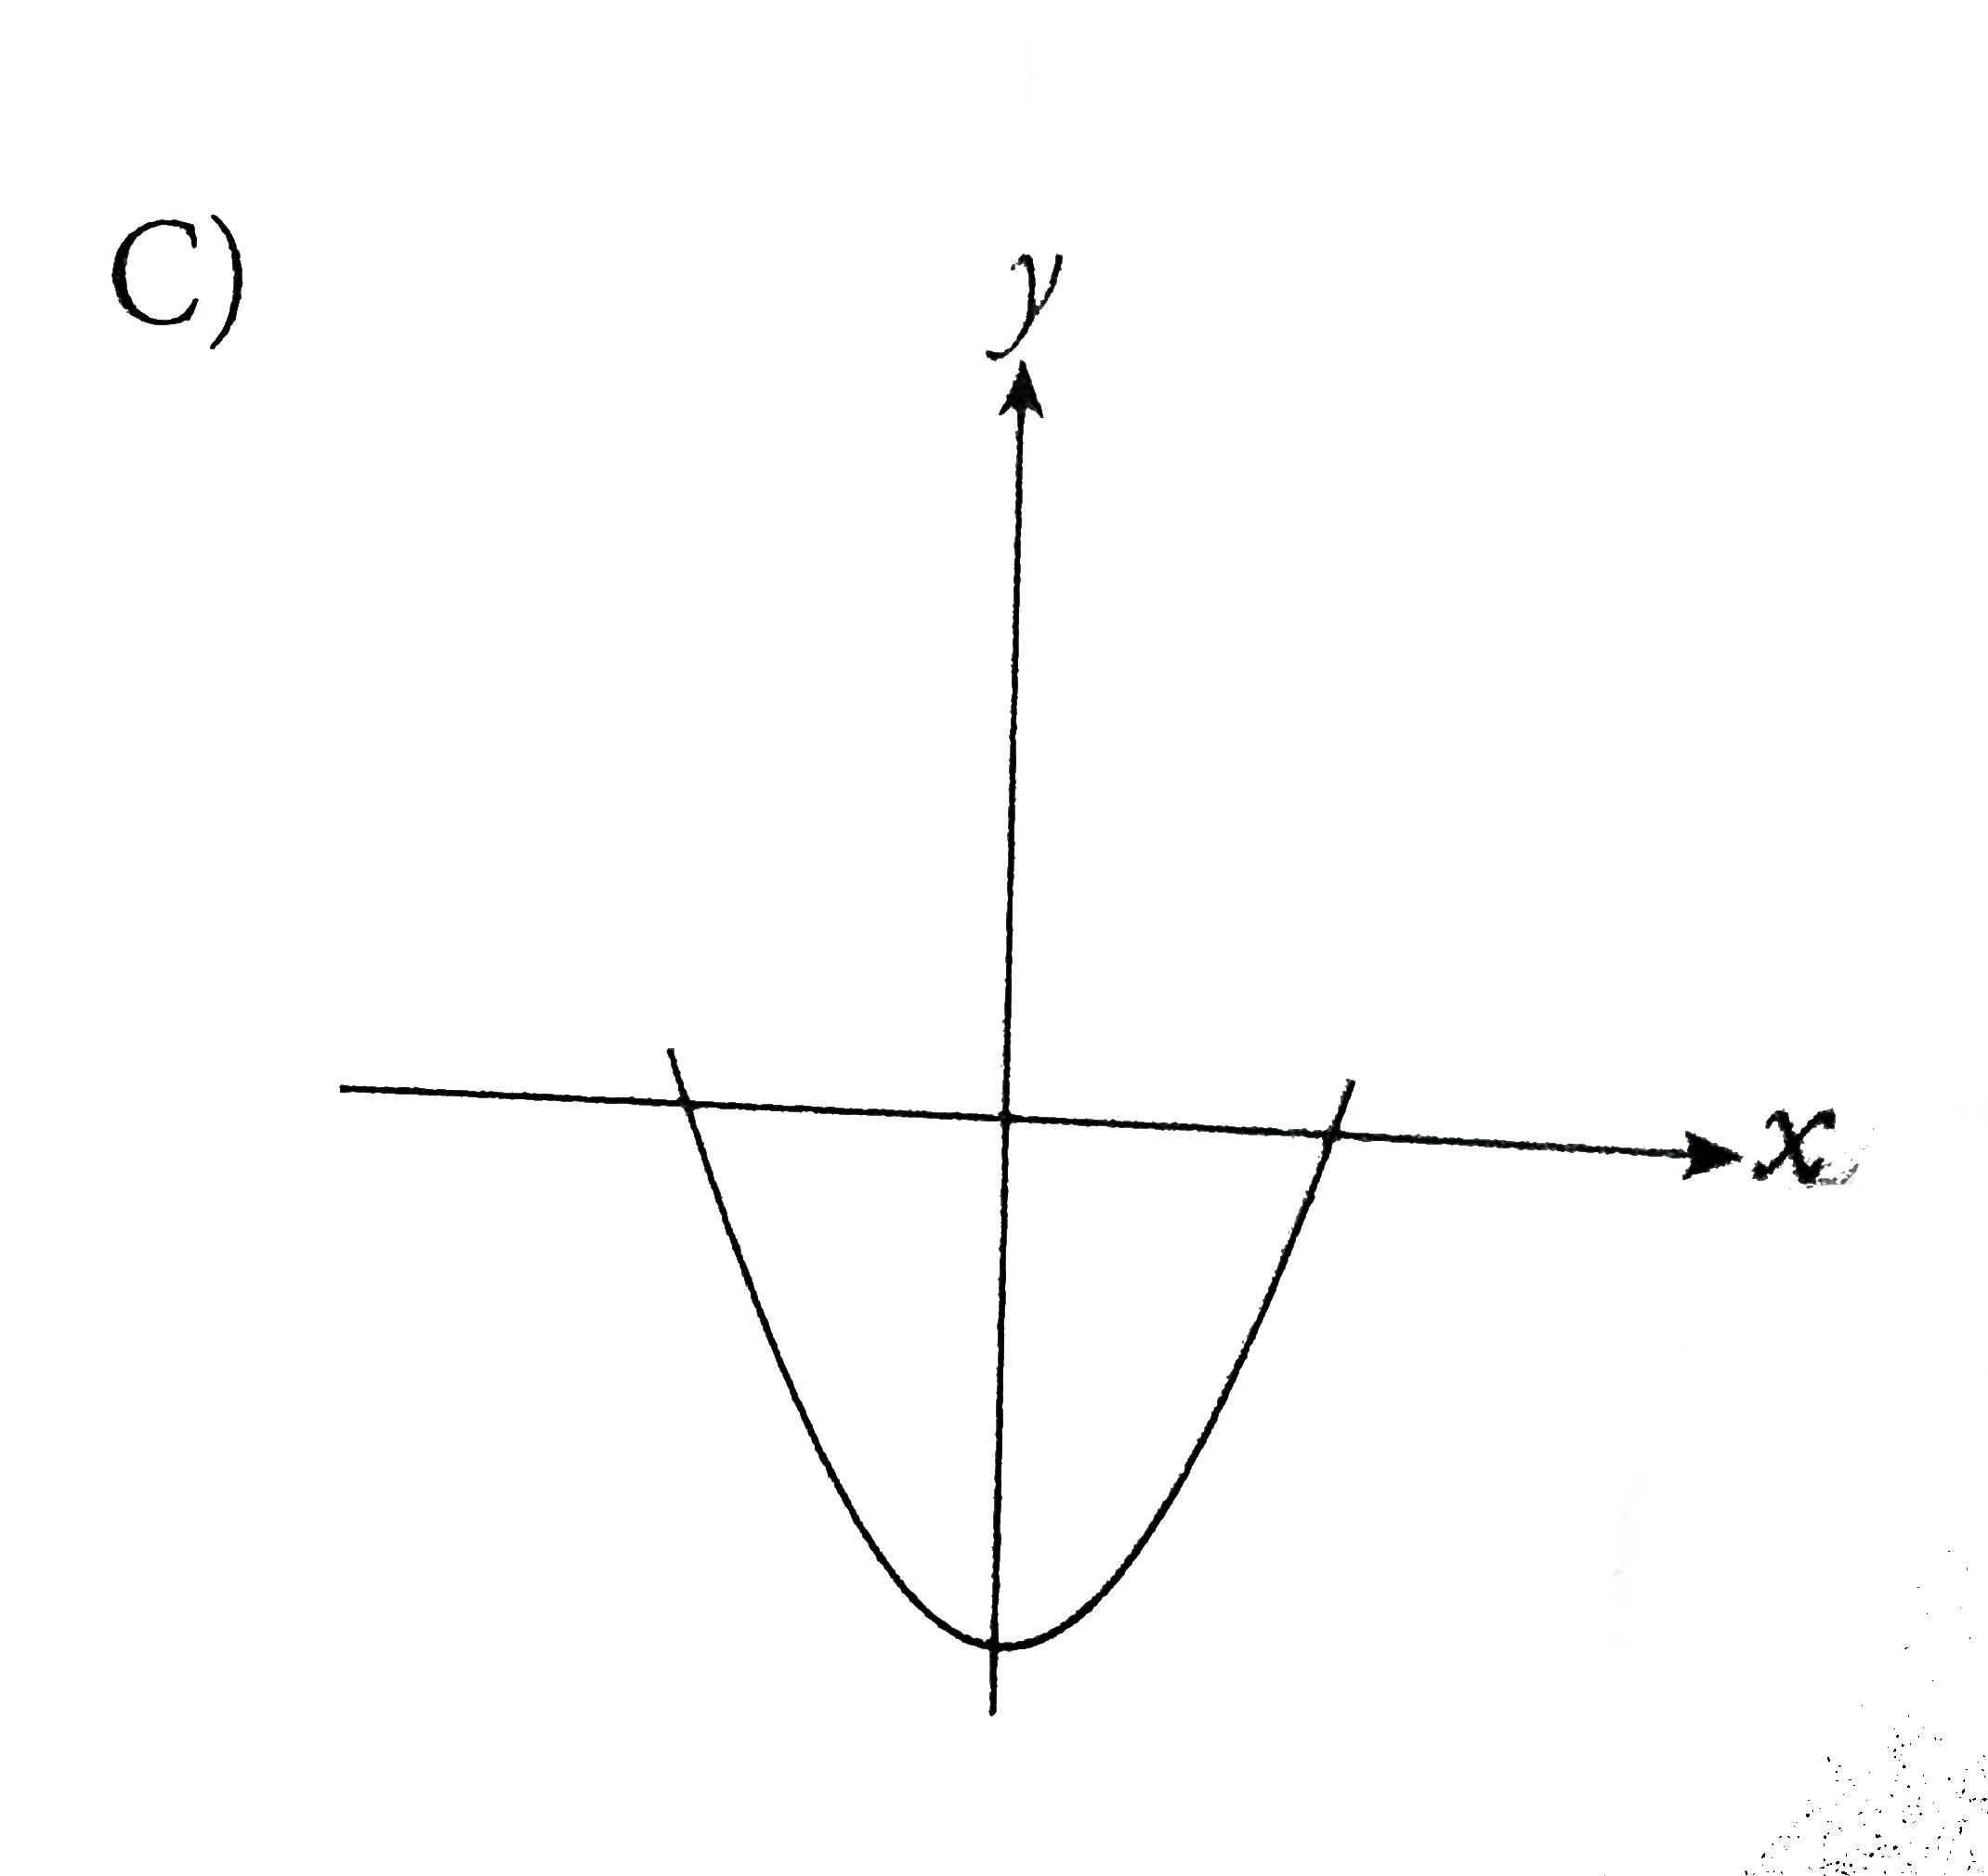 D
D
Which of the following graphs are graphs of a function?
View SolutionWhich of the following graph represents uniform motion
View SolutionWhich of the following graph represents uniform motion
View SolutionWhich of the following graph represents Boyle's law ?
View SolutionWhich of the following graphs represents exothermic reaction ?
View Solution
