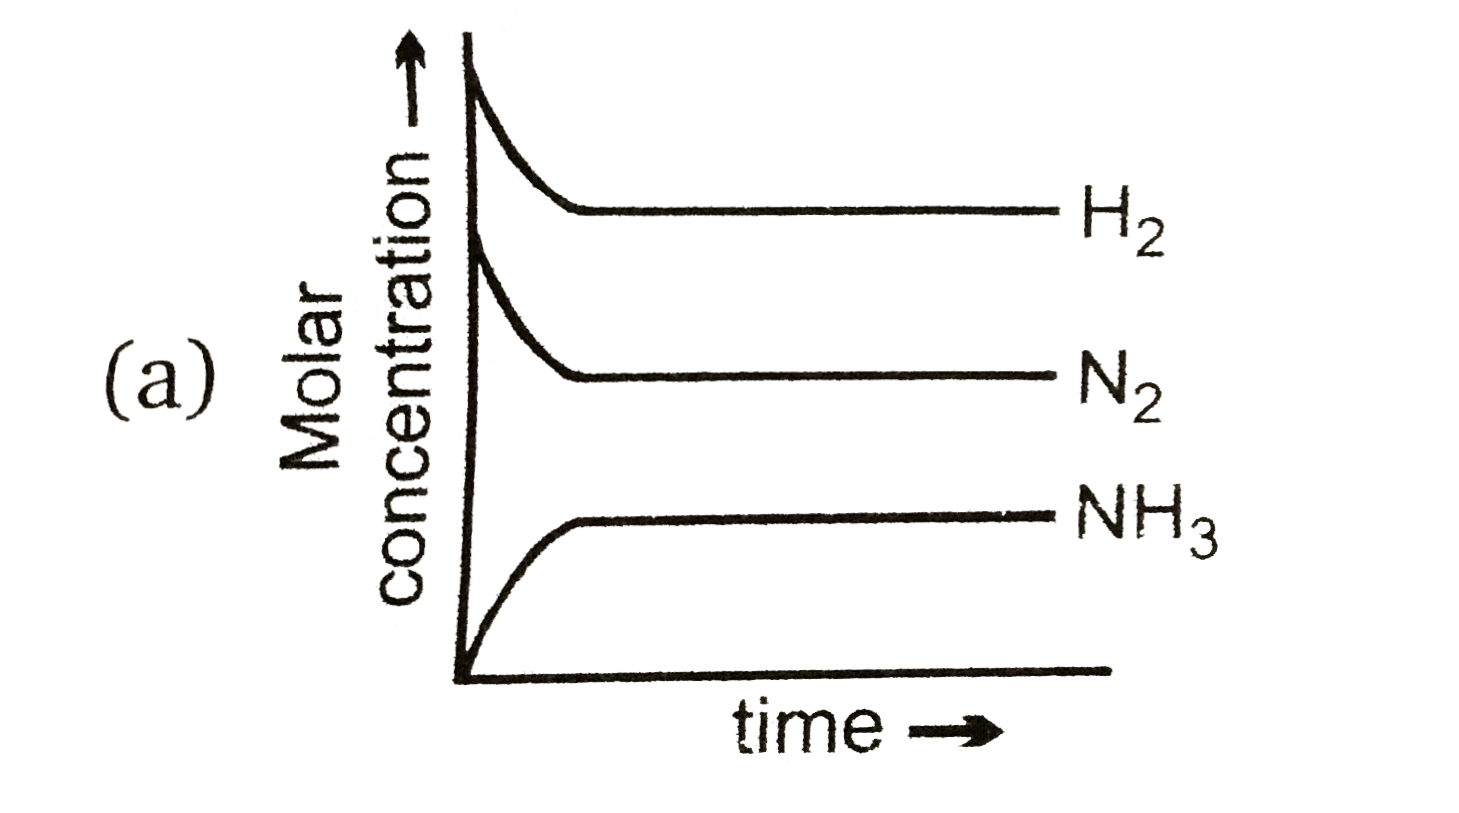
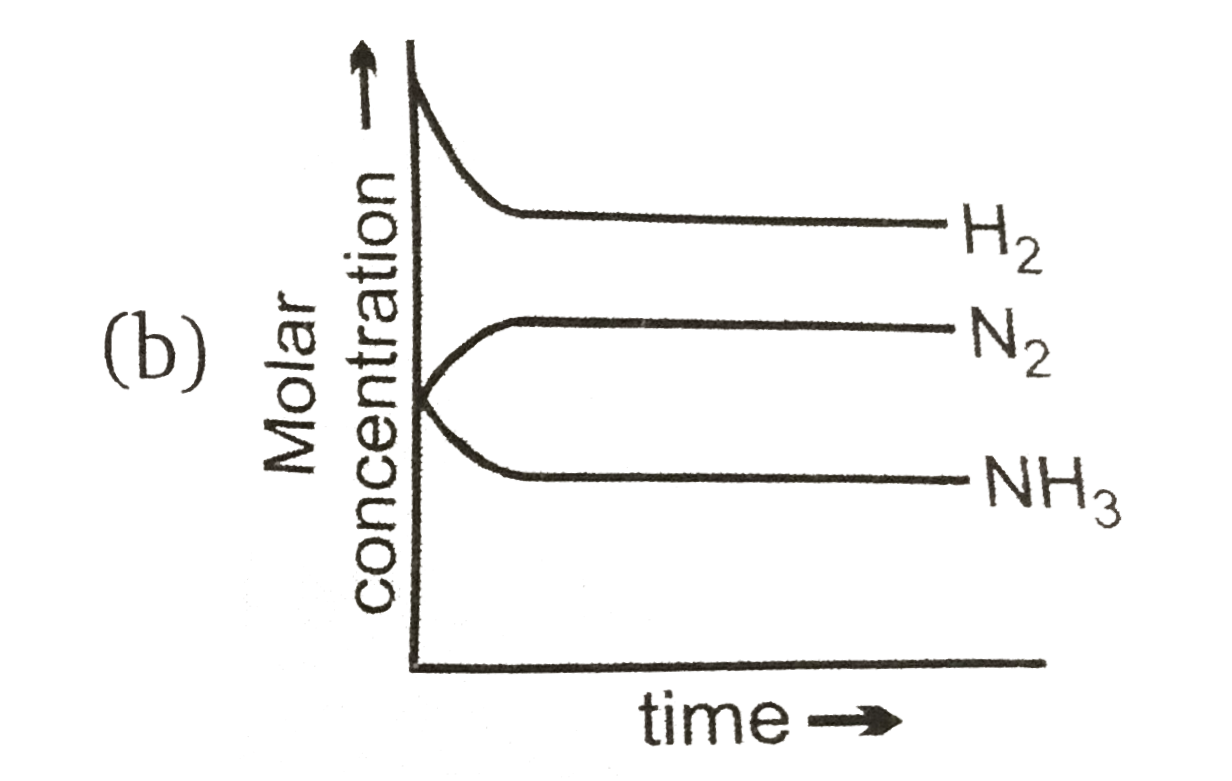
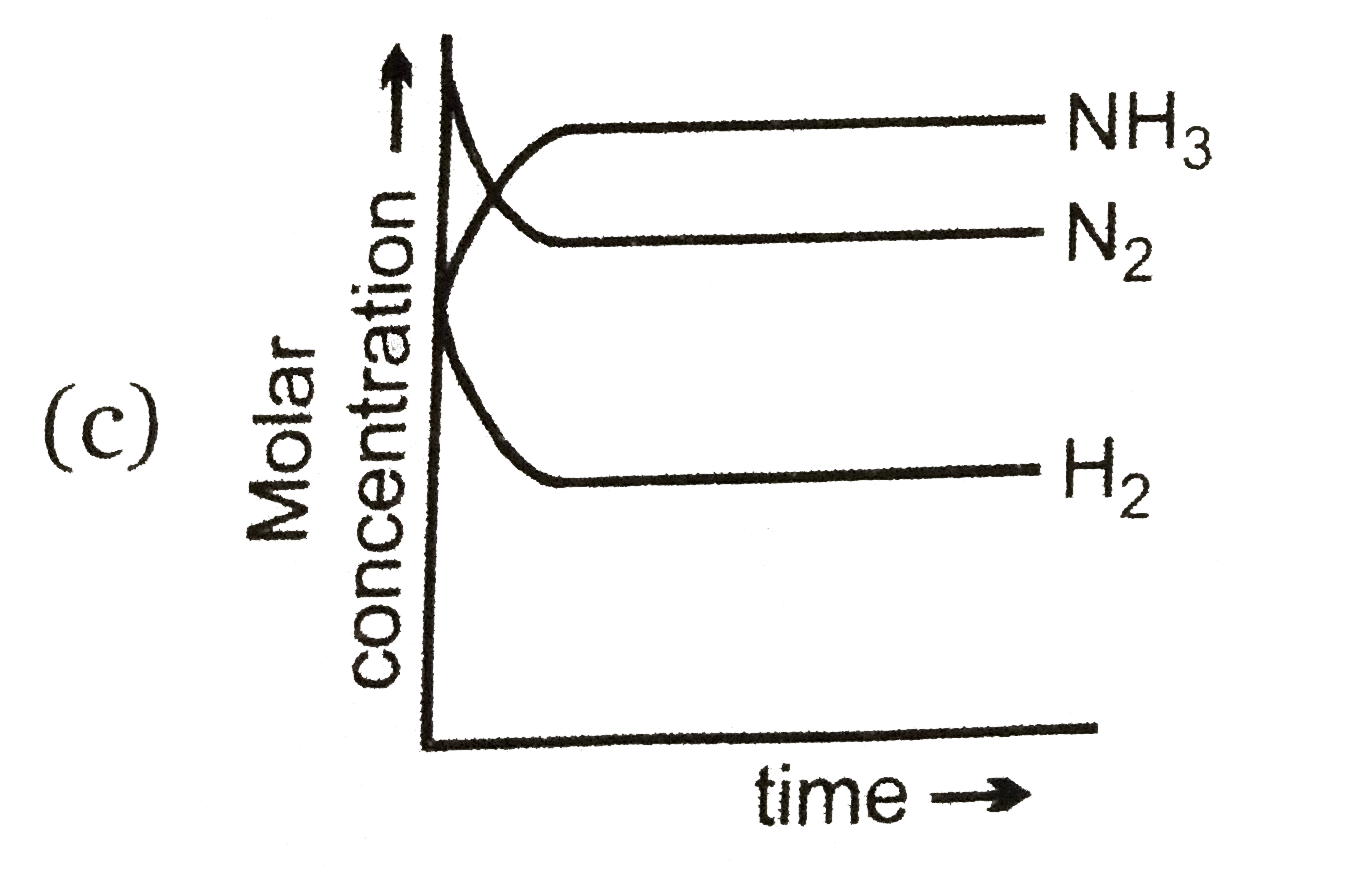
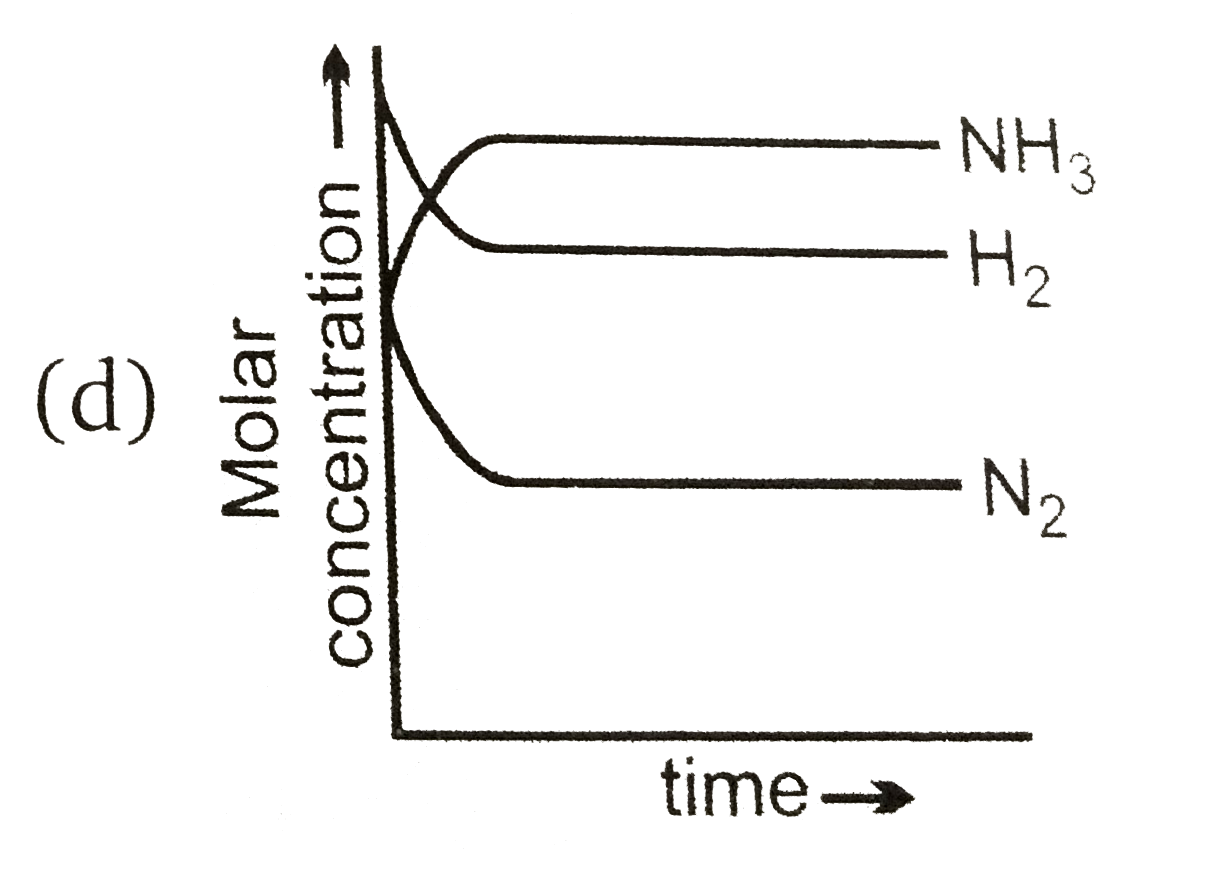
For the synthesis of ammonia by the reaction N2+3H2⇔2NH3 in the Haber's process ,the attainment of equilibrium is correctly predicated bt the curve


The correct Answer is:a
To solve the question regarding the synthesis of ammonia in the Haber process and the correct prediction of equilibrium by a graph, we can follow these steps:
1. Understand the Reaction: The reaction for the synthesis of ammonia is given by:
N2+3H2⇌2NH3
This indicates that one mole of nitrogen reacts with three moles of hydrogen to produce two moles of ammonia.
2. Initial Concentrations: At the start of the reaction (time t0), only the reactants (nitrogen and hydrogen) are present. Therefore:
- Concentration of N2 = AV (where A is the initial moles of N2)
- Concentration of H2 = BV (where B is the initial moles of H2)
- Concentration of NH3 = 0
3. Change in Concentrations at Equilibrium: As the reaction proceeds towards equilibrium, some of the reactants will be converted into products. Let x be the amount of N2 that reacts:
- Concentration of N2 at equilibrium = A−xV
- Concentration of H2 at equilibrium = B−3xV
- Concentration of NH3 at equilibrium = 2xV
4. Graph Analysis: The question asks which graph correctly represents the attainment of equilibrium:
- At t0, the concentration of NH3 should be zero.
- As the reaction progresses, the concentration of NH3 will increase, while the concentrations of N2 and H2 will decrease.
- At equilibrium, the concentrations of all species will remain constant.
5. Identifying the Correct Graph: The correct graph should show:
- NH3 starting from zero and increasing until it reaches a constant value.
- N2 and H2 starting from their initial concentrations and decreasing until they reach constant values at equilibrium.
6. Conclusion: Based on the analysis, the graph that shows NH3 starting from zero and increasing, while N2 and H2 decrease and then stabilize, is the correct representation of the equilibrium state in the Haber process.
Final Answer:
The correct option is A, as it accurately depicts the changes in concentrations during the attainment of equilibrium in the Haber process.
---
N2+3H2⇌2NH3
This indicates that one mole of nitrogen reacts with three moles of hydrogen to produce two moles of ammonia.
- Concentration of N2 = AV (where A is the initial moles of N2)
- Concentration of H2 = BV (where B is the initial moles of H2)
- Concentration of NH3 = 0
- Concentration of N2 at equilibrium = A−xV
- Concentration of H2 at equilibrium = B−3xV
- Concentration of NH3 at equilibrium = 2xV
- At t0, the concentration of NH3 should be zero.
- As the reaction progresses, the concentration of NH3 will increase, while the concentrations of N2 and H2 will decrease.
- At equilibrium, the concentrations of all species will remain constant.
- NH3 starting from zero and increasing until it reaches a constant value.
- N2 and H2 starting from their initial concentrations and decreasing until they reach constant values at equilibrium.
The correct option is A, as it accurately depicts the changes in concentrations during the attainment of equilibrium in the Haber process.
Similar Questions
Knowledge Check
In the reaction,
N2(g)+3H2(g)⇔2NH3(g)
the value of the equilibrium constant depends onAvolume of the reaction vesselBtotal pressure of the systemCthe initial concentration of nitrogen and hydrogenDthe temperature
For the the manufacture of ammonia by the reaction N2+3H2⇔2NH3+21.9 Kcal. the favourable condition are
View SolutionIn a chemical reaction
N2+3H2⇔2NH3, at equilibrium point
View SolutionIn the reaction N2(g)+3H2(g)⇔2NH3(g), the value of the equlibrium constant depends on
View SolutionFor a reaction N2+3H2⇔2NH3, the value of KC does not depends upon:
View SolutionFor the reaction
N2(g)+3H2(g)⇔2NH3(g),ΔH=?
View Solution1 mol of N2 is mixed with 3 mol of H2 in a litre container. If 50% of N2 is converted into ammonia by the reaction N2(g)+3H2(g)⇔2NH3(g), then the total number of moles of gas at the equilibrium are
View SolutionFor the reaction : N2(g)+3H2(g)⇔2NH3(g), ΔH=−ve, the correct statement is :
View Solution
