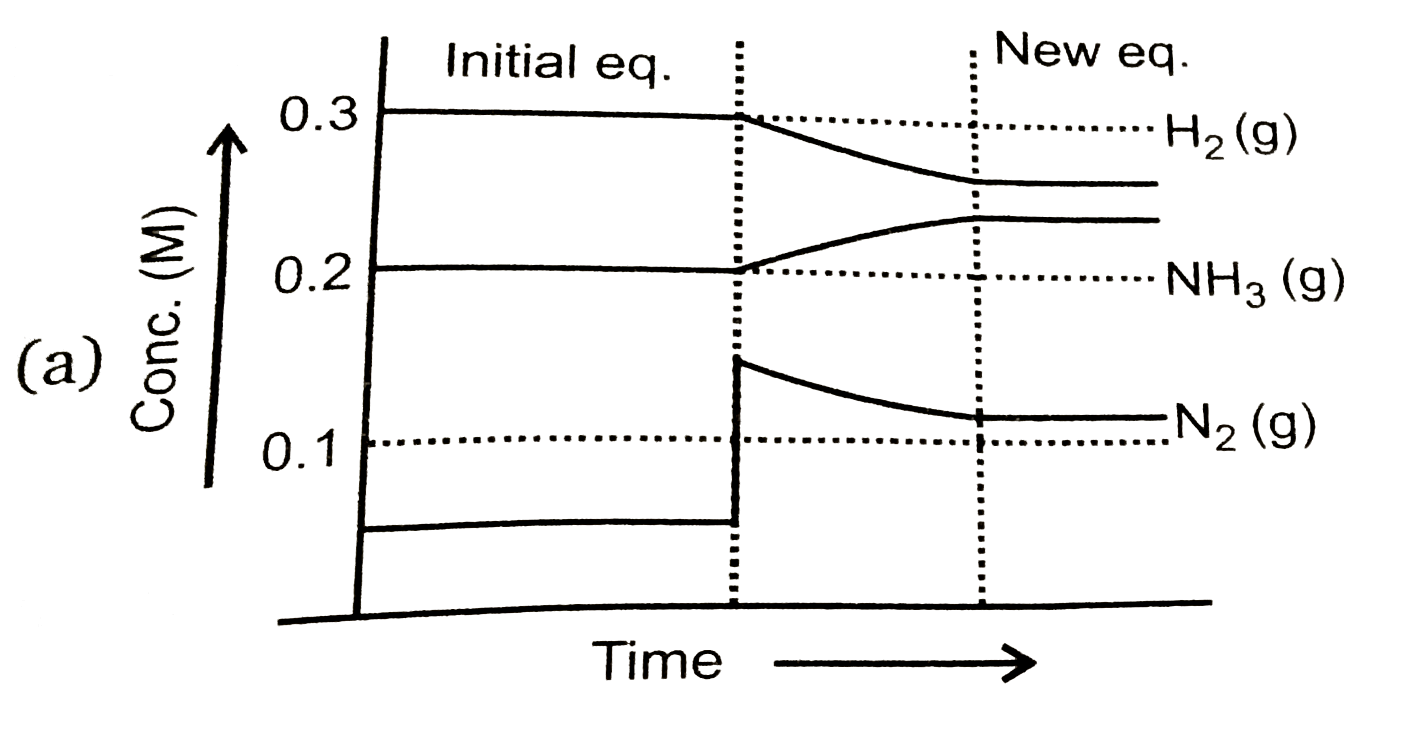
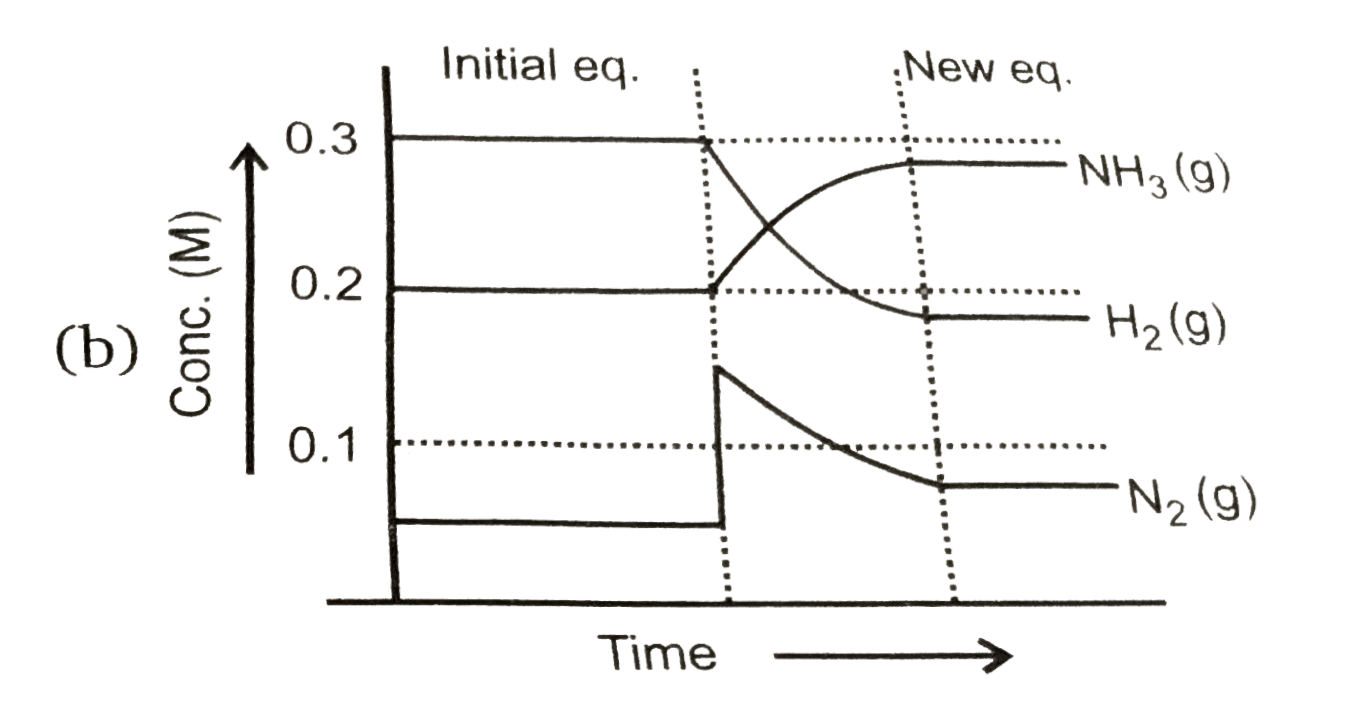
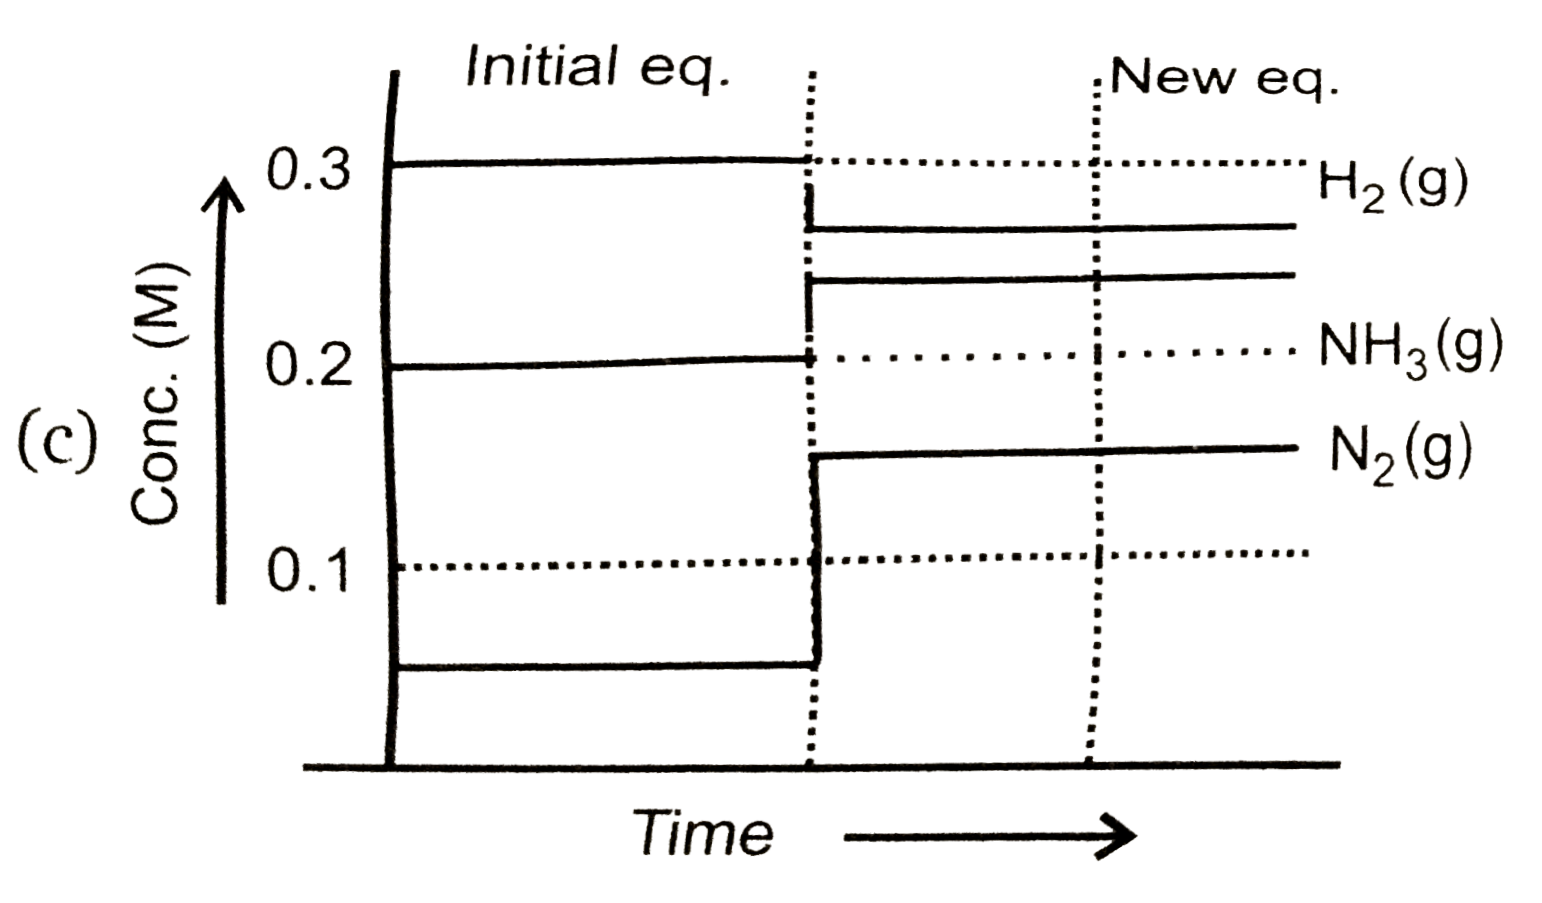
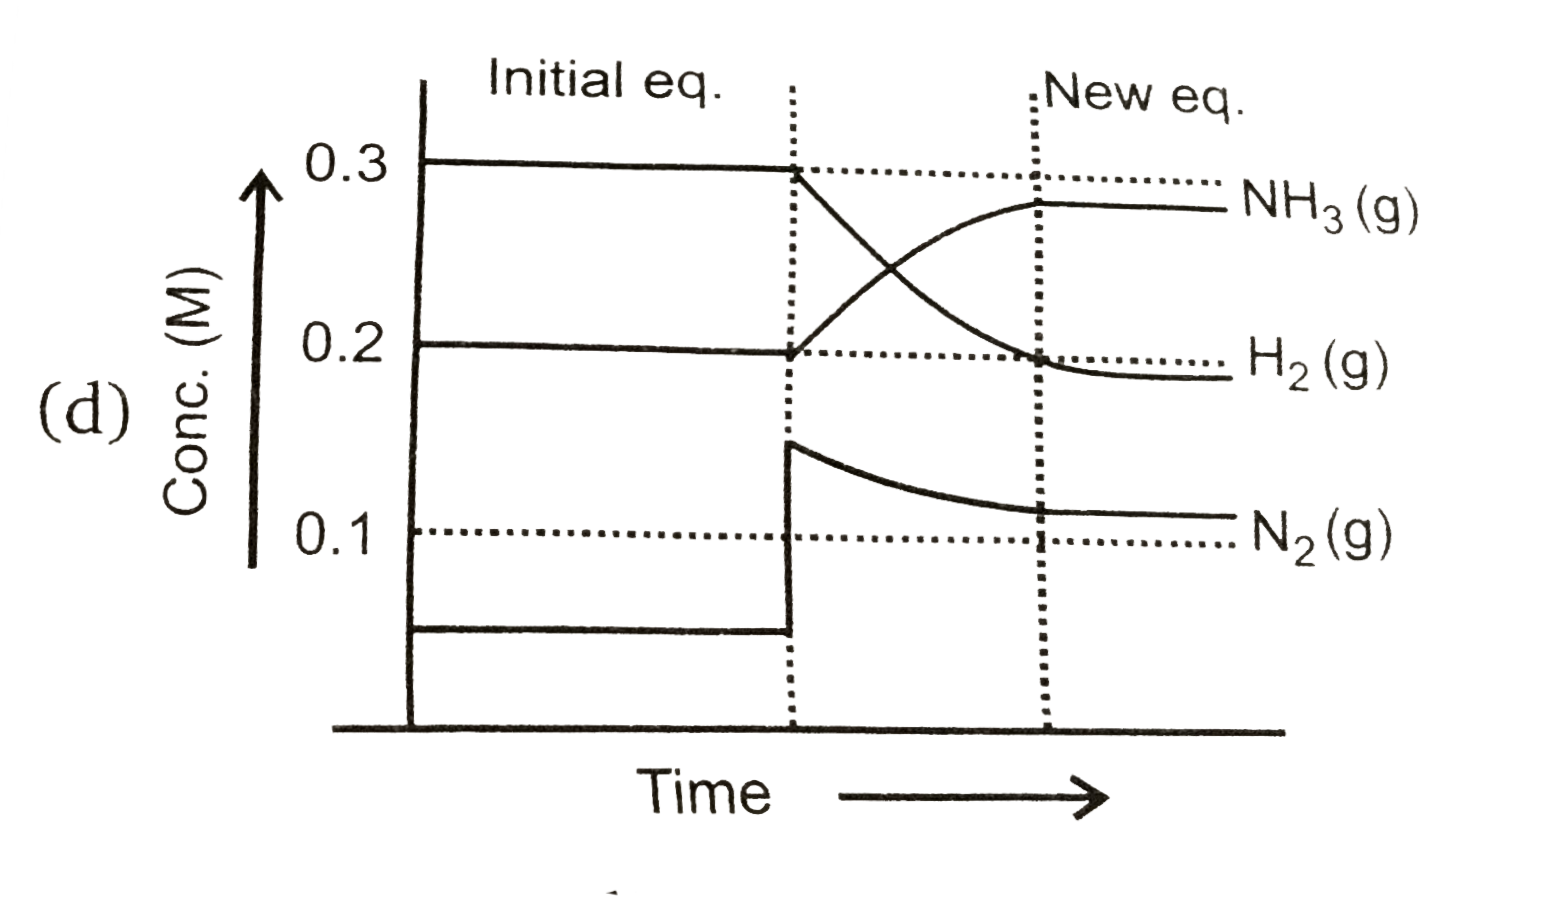
An equilibrium mixture at 700 K of 0.05M is present in a container .Now if this equilibrium is disturbed by adding (g) so that its concentration becomes 0.15M just after addition then which of the following graph represents the above situation more appropriately:


The correct Answer is:a
To solve the problem, we need to analyze the equilibrium reaction and the changes that occur when we add N2(g) to the system.
1. Identify the Initial Conditions:
- The initial concentrations before adding N2(g) are:
- (N2)=0.05M
- (NH3)=0.2M
2. Disturb the Equilibrium:
- After adding N2(g), the concentration becomes (N2)=0.15M.
3. Determine the Change in Concentration:
- The change in concentration of N2 is:
Δ(N2)=0.15M−0.05M=0.10M
4. Apply Le Chatelier's Principle:
- According to Le Chatelier's principle, if we increase the concentration of a reactant, the system will shift to the right to counteract the change, thereby producing more products.
5. Stoichiometry of the Reaction:
- The balanced reaction for the formation of ammonia from nitrogen and hydrogen is:
N2(g)+3H2(g)⇌2NH3(g)
- From the stoichiometry of the reaction:
- For every 1 mole of N2 that reacts, 3 moles of H2 are consumed and 2 moles of NH3 are produced.
6. Calculate Changes in Concentration:
- Since N2 increases by 0.10M:
- The decrease in H2 will be 3×0.10M=0.30M.
- The increase in NH3 will be 2×0.10M=0.20M.
7. Final Concentrations:
- After the changes, the new concentrations will be:
- (N2)=0.15M
- (H2)=0.2M−0.30M=−0.10M (impossible, indicating that the reaction will not proceed further)
- (NH3)=0.2M+0.20M=0.4M
8. Graph Representation:
- The graph that represents this situation will show a decrease in H2 concentration, an increase in NH3 concentration, and a slight change in N2 concentration.
Conclusion:
The correct graph that represents the changes in concentrations of N2, H2, and NH3 after the addition of N2(g) is option D, as it matches the stoichiometric changes predicted by the equilibrium shift.
- The initial concentrations before adding N2(g) are:
- (N2)=0.05M
- (NH3)=0.2M
- After adding N2(g), the concentration becomes (N2)=0.15M.
- The change in concentration of N2 is:
Δ(N2)=0.15M−0.05M=0.10M
- According to Le Chatelier's principle, if we increase the concentration of a reactant, the system will shift to the right to counteract the change, thereby producing more products.
- The balanced reaction for the formation of ammonia from nitrogen and hydrogen is:
N2(g)+3H2(g)⇌2NH3(g)
- From the stoichiometry of the reaction:
- For every 1 mole of N2 that reacts, 3 moles of H2 are consumed and 2 moles of NH3 are produced.
- Since N2 increases by 0.10M:
- The decrease in H2 will be 3×0.10M=0.30M.
- The increase in NH3 will be 2×0.10M=0.20M.
- After the changes, the new concentrations will be:
- (N2)=0.15M
- (H2)=0.2M−0.30M=−0.10M (impossible, indicating that the reaction will not proceed further)
- (NH3)=0.2M+0.20M=0.4M
- The graph that represents this situation will show a decrease in H2 concentration, an increase in NH3 concentration, and a slight change in N2 concentration.
The correct graph that represents the changes in concentrations of N2, H2, and NH3 after the addition of N2(g) is option D, as it matches the stoichiometric changes predicted by the equilibrium shift.
Similar Questions
For the equilibrium at 2.0 bar N2(g)+3H2(g)↔2NH3(g) , what happens to the equillibrium when pressure increased
View SolutionGiven the following reaction at equilibrium N2(g)+3H2(g)⇔2NH3(g). Some inert gas at constant pressure is added to the system. Predict the following facts:
View SolutionFor the reaction H2(g)+I2(g)⇔2HI(g) at 721 K the value of equilibrium constant (Kc) is 50. When the equilibrium concentration of both is 0.5 M, the value of Kp under the same condtions will be
View SolutionDecomposition of ammonium chloride is an endothermic reaction. The equilibrium may be represented as:
NH4Cl(s)⇔NH3(g)+HCl(g)
A 6.250g sample of NH4Cl os placed in an evaculated 4.0L container at 27∘C. After equilibrium the total pressure inside the container is 0.820 bar and some solid remains in the container. Answer the followings
The amount of solid NH4Cl left behind in the container at equilibrium is
View SolutionFor the reaction N2(g)+3H2(g)⇔2NH3(g),ΔH=−93.6kJmol−1. The concentration of H2 at equilibrium will increase if
View SolutionN2(g)+3H2(g)⇔2NH3(g). If some HCl gas is passed into the reaction mixture at the equilibrium of this R reaction,
View Solution4gH2 &127gI2 are mixed & heated in 10 lit closed vessel until equilibrium is reached. If the equilibrium concentration of HI is 0.05 M, total number of moles present at cquilibrium is
View Solution40% of a mixture of 0.2 mol of N2 and 0.6 mol of H2 reacts to give NH3 according to the equation:
N2(g)+3H2(g)⇔2NH3(g)
at constant temperature and pressure. Then the ratio of the final volume to the initial volume of gases are
View SolutionWhen He(g) is added in the following equilibrium at constant volume
N2(g)+3H2(g)⇔2NH3(g)
Then select the correct statement.
View SolutionThe density of an equilibrium mixture of N2O4 and NO2 at 1 atm and 373.5K is 2.0 g/L.
Calculate KC for the reaction N2O2(g)⇔2NO2(g)
View Solution
