An exothermic reaction is represented by the graph :
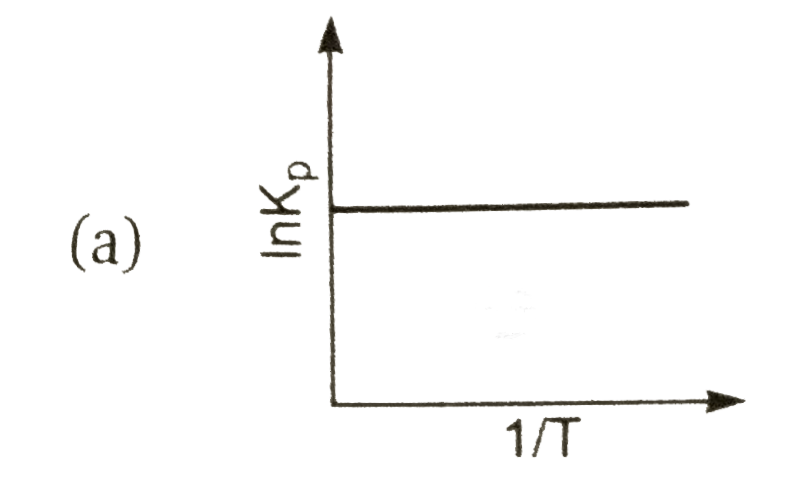
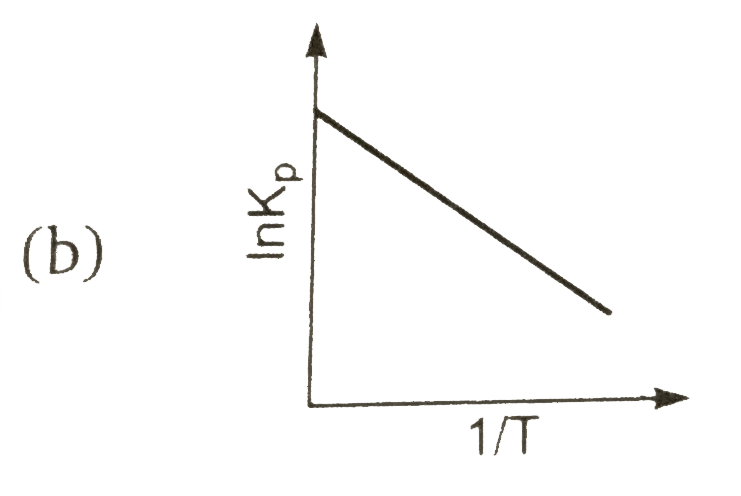
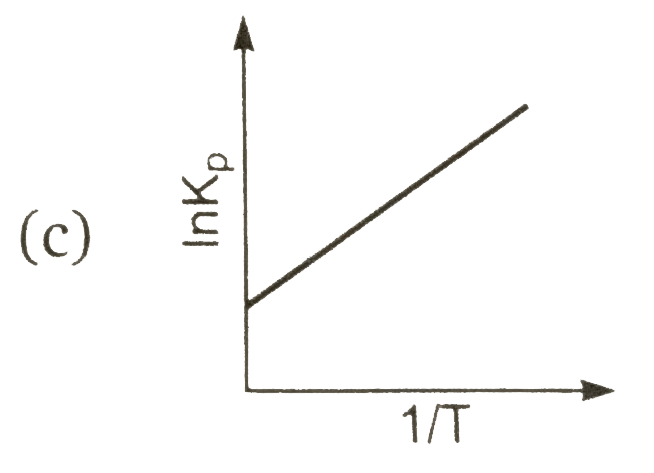
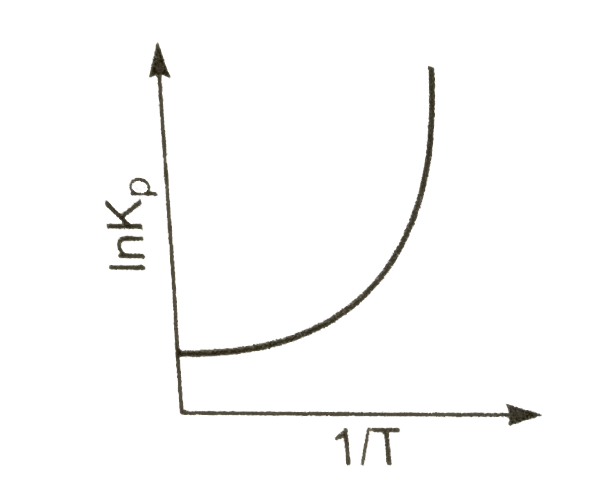
The correct Answer is:c
To solve the question regarding the graph representing an exothermic reaction, we can follow these steps:
Step 1: Understand the Relationship Between ΔG, ΔH, and ΔS
The Gibbs free energy change (ΔG) is related to the enthalpy change (ΔH) and entropy change (ΔS) by the equation:
ΔG0=ΔH0−TΔS0
Step 2: Relate ΔG to the Equilibrium Constant (Kp)
The standard Gibbs free energy change is also related to the equilibrium constant (Kp) by the equation:
ΔG0=−RTlnKp
Step 3: Combine the Two Equations
We can substitute the second equation into the first:
−RTlnKp=ΔH0−TΔS0
Step 4: Rearrange the Equation
Now, divide both sides by −RT:
lnKp=−ΔH0R⋅1T+ΔS0R
Step 5: Identify the Linear Relationship
This equation can be compared to the linear equation y=mx+c, where:
- y=lnKp
- x=1T
- The slope m=−ΔH0R
- The intercept c=ΔS0R
Step 6: Determine the Sign of the Slope for an Exothermic Reaction
For an exothermic reaction, ΔH^0 is negative. Therefore, the slope m becomes:
m=−ΔH0R(where ΔH^0 < 0)
This means that the slope will be positive since a negative divided by a negative is positive.
Step 7: Identify the Correct Graph
Since the slope is positive and there is an intercept, the graph that represents this relationship will be a straight line with a positive slope. Therefore, the correct graph will show a positive slope with an intercept.
Conclusion
The graph representing an exothermic reaction, based on the analysis above, will be the one with a positive slope and an intercept.
---
The Gibbs free energy change (ΔG) is related to the enthalpy change (ΔH) and entropy change (ΔS) by the equation:
ΔG0=ΔH0−TΔS0
The standard Gibbs free energy change is also related to the equilibrium constant (Kp) by the equation:
ΔG0=−RTlnKp
We can substitute the second equation into the first:
−RTlnKp=ΔH0−TΔS0
Now, divide both sides by −RT:
lnKp=−ΔH0R⋅1T+ΔS0R
This equation can be compared to the linear equation y=mx+c, where:
- y=lnKp
- x=1T
- The slope m=−ΔH0R
- The intercept c=ΔS0R
For an exothermic reaction, ΔH^0 is negative. Therefore, the slope m becomes:
m=−ΔH0R(where ΔH^0 < 0)
This means that the slope will be positive since a negative divided by a negative is positive.
Since the slope is positive and there is an intercept, the graph that represents this relationship will be a straight line with a positive slope. Therefore, the correct graph will show a positive slope with an intercept.
The graph representing an exothermic reaction, based on the analysis above, will be the one with a positive slope and an intercept.
Similar Questions
Knowledge Check
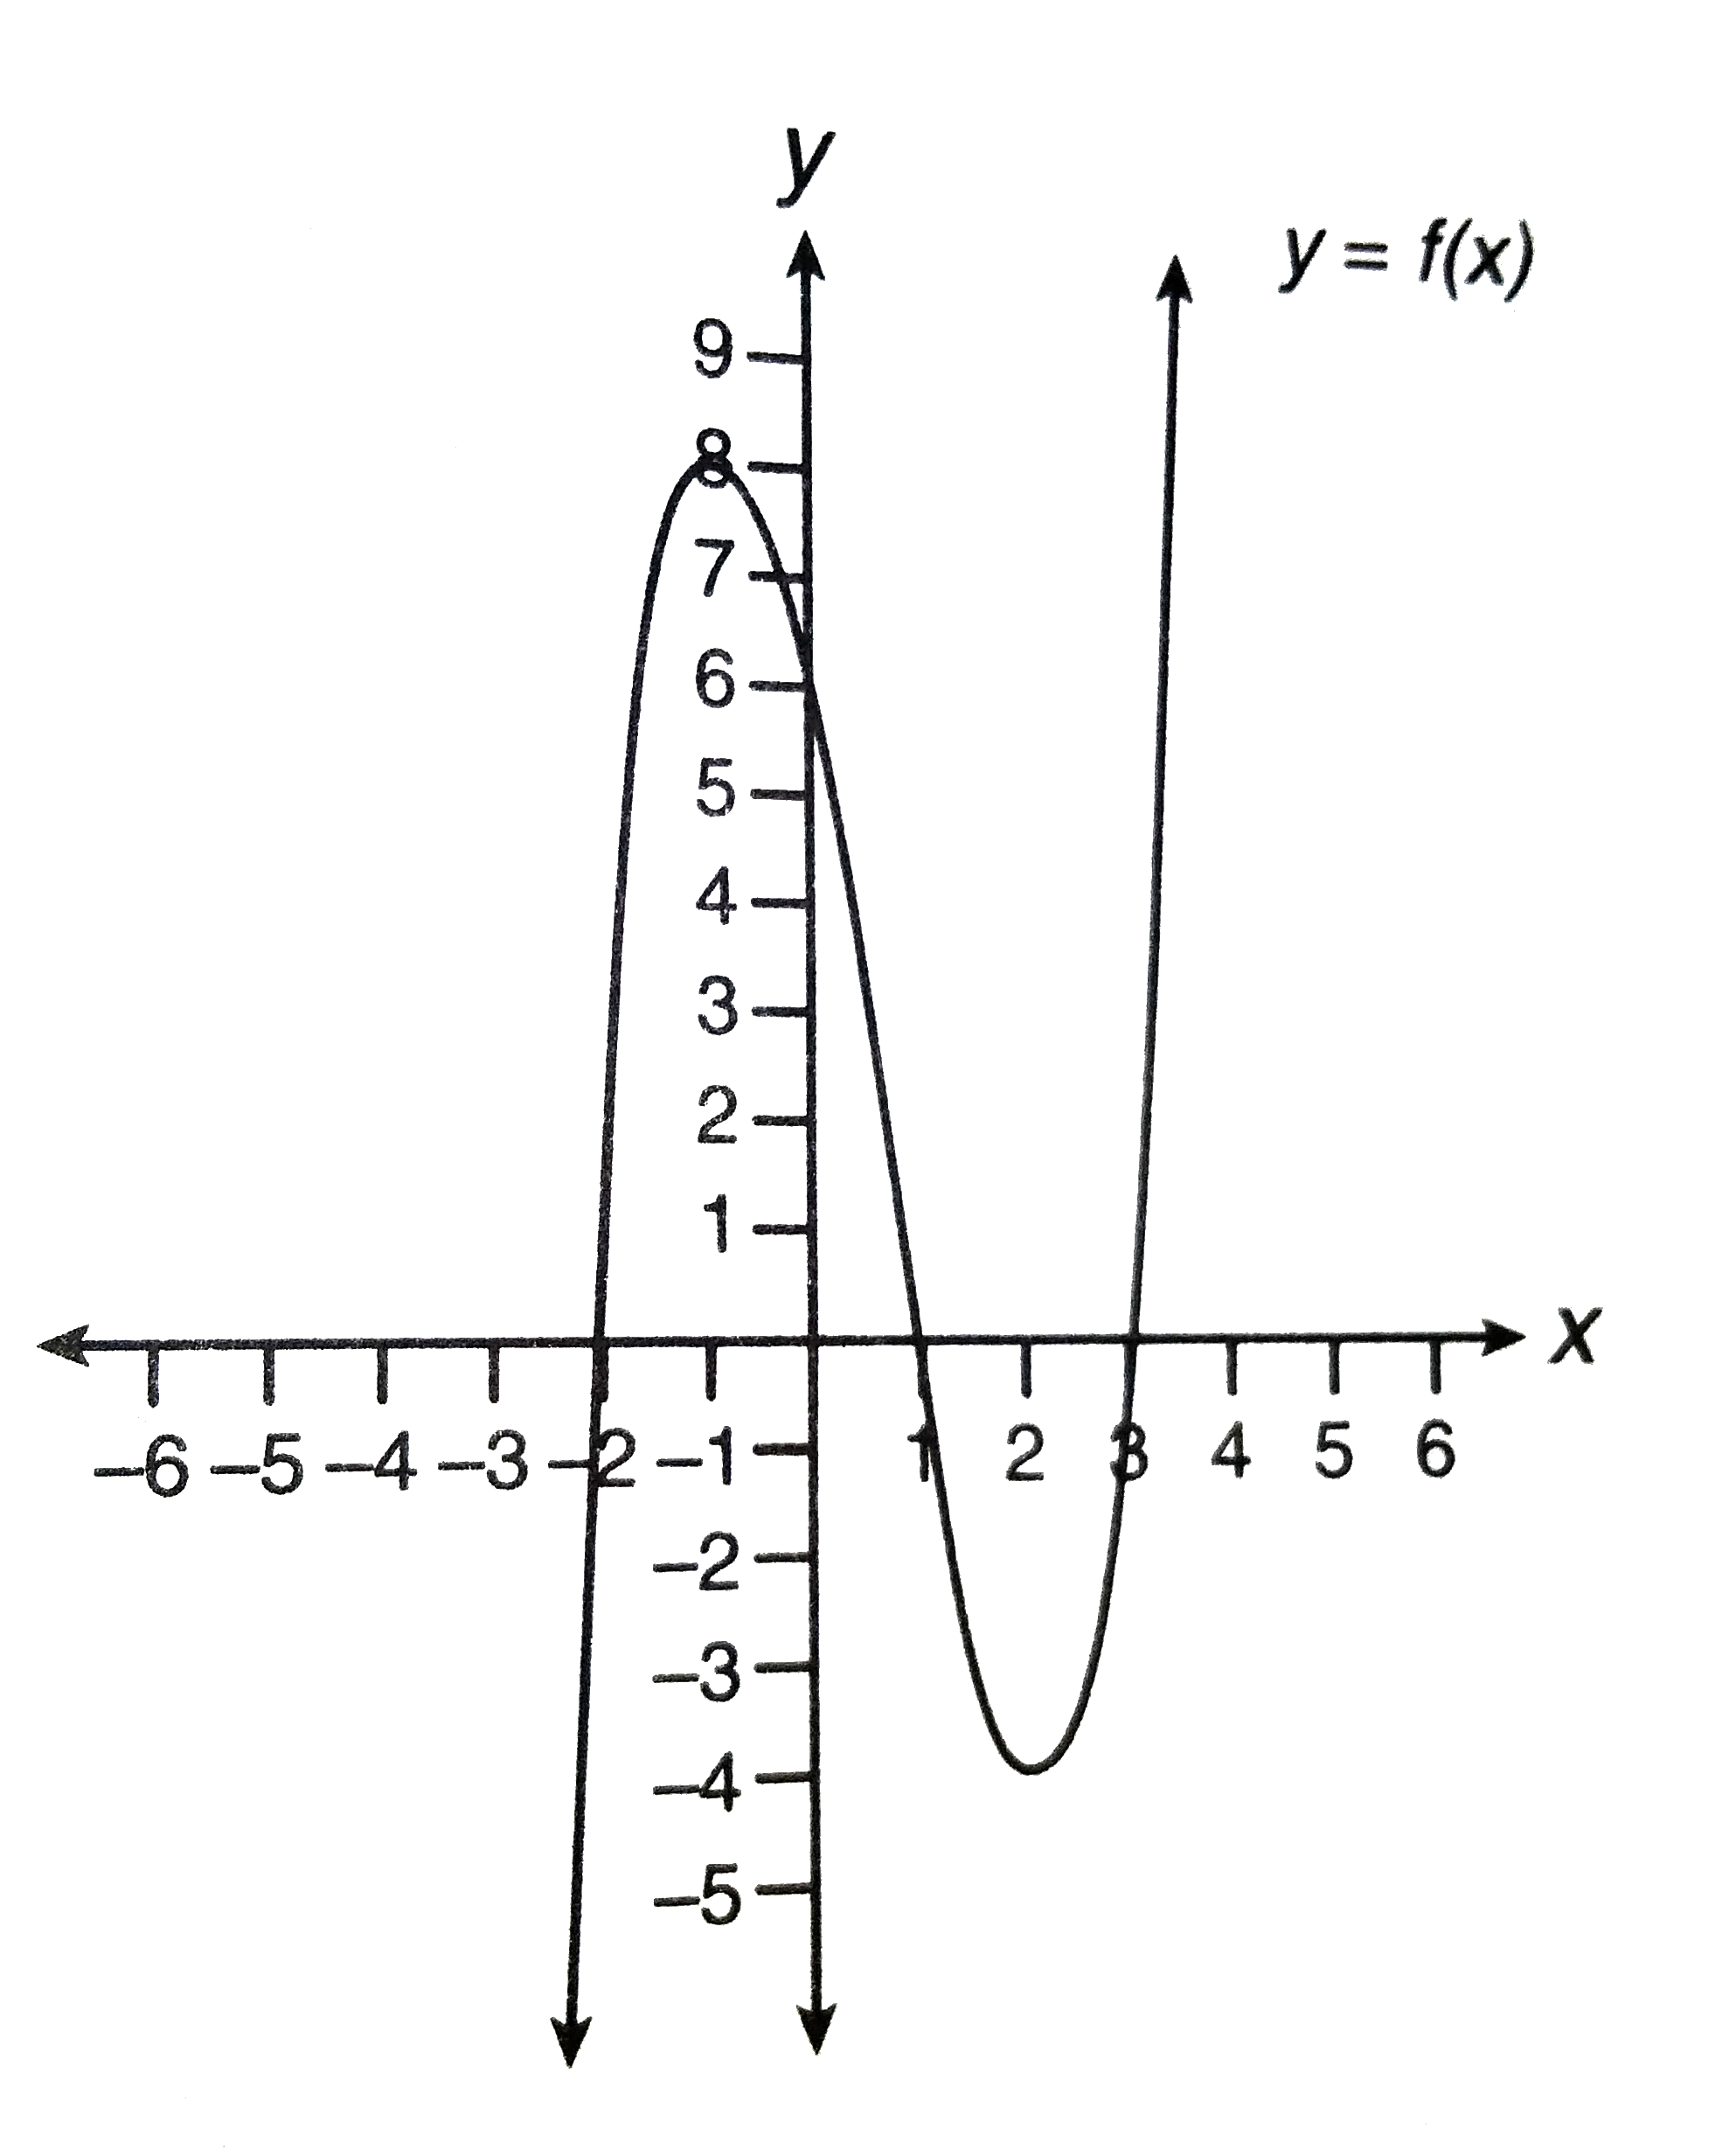
Which function could represents the graph above?Af(x)=(x−6)(x2−4x+3)Bf(x)=(x−3)(x2+x−2)Cf(x)=(x−1)(x2−5x−6)Df(x)=(x+2)(x2−4x−12)
An exothermic reaction is one in which the reacting substances :
View SolutionAn exothermic reaction involves a decrease in the entropy of the system. Will the process be spontaneous ?
View SolutionIn exothermic reactions, the energy content of the product is that of the substrate.
View SolutionThe motion of a body is represented by the following displacement-time graph.
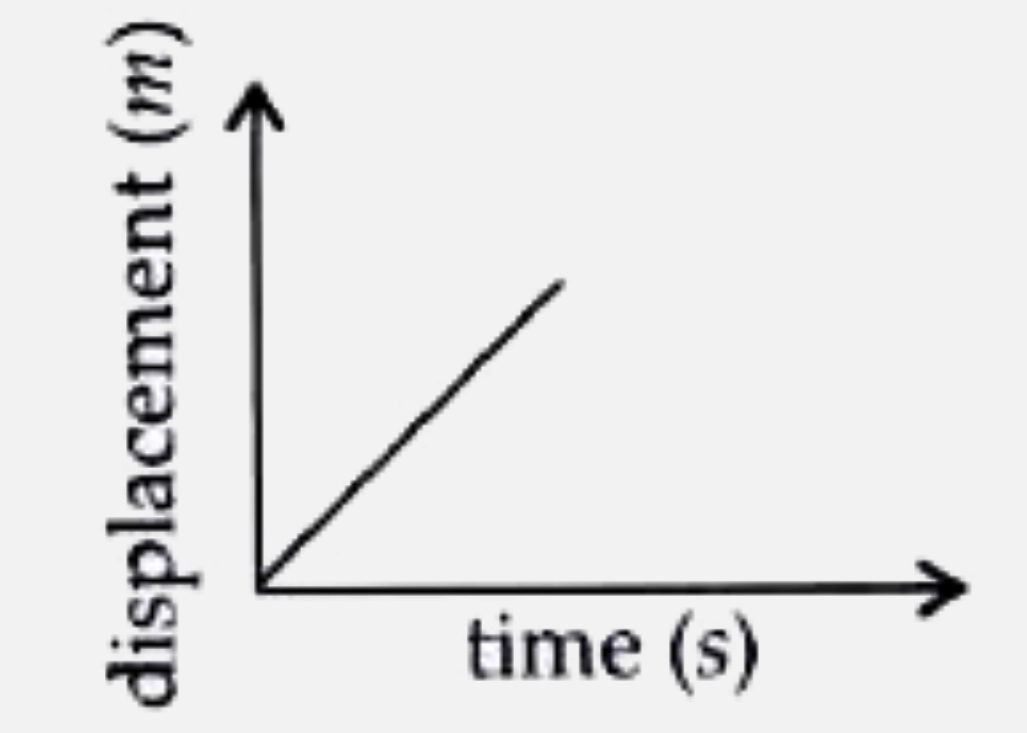
State the type of motion represented in the graph.
View SolutionThe rate of an exothermic reactions increases with increase in temperature.
View SolutionStatement-1: A reaction which is spontaneous and accompained by decrease of randomness must be exothermic.
Statement -2: All exothermic reaction that are accomained by decrease of randomness.
View SolutionIn an exothermic reaction heat is evolved and system loses heat to the surrounding. For such system
View Solution
