In a saturated solution of AgCl, NaCl is added gradually. The concentration of Ag+ is plotted against the concentration of Cl−. The graph appears as :
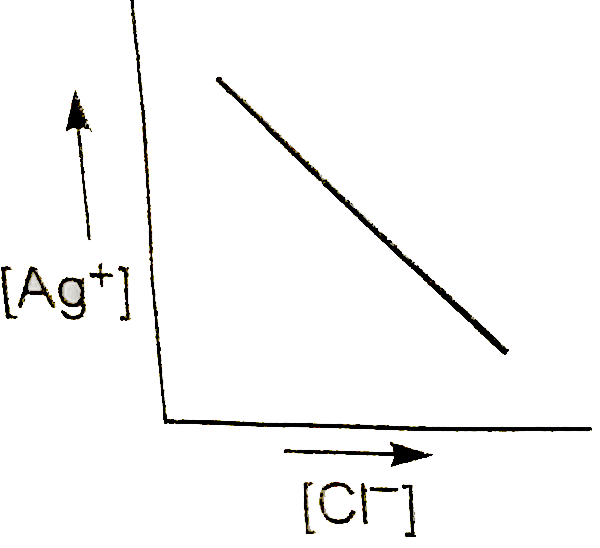
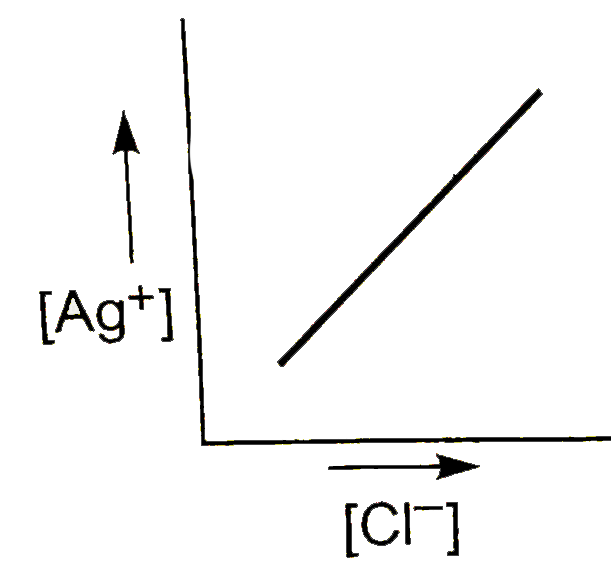
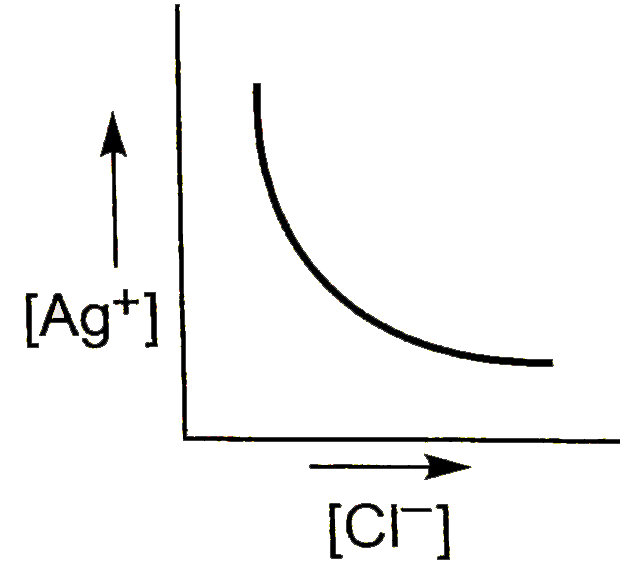
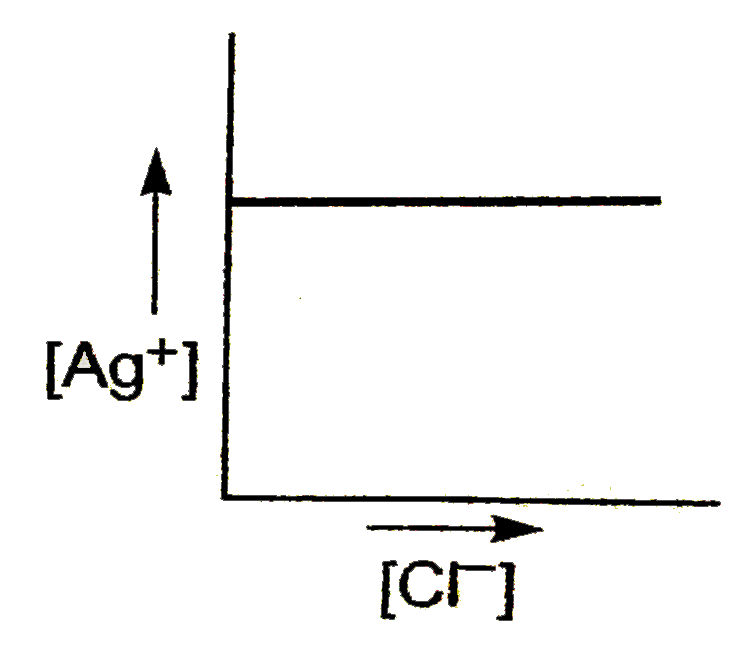
The correct Answer is:C
To solve the problem of how the concentration of Ag+ changes as NaCl is added to a saturated solution of AgCl, we can follow these steps:
Step 1: Understand the Dissociation of AgCl
The dissociation of silver chloride (AgCl) in water can be represented as:
AgCl (s)⇌Ag+(aq)+Cl−(aq)
In a saturated solution of AgCl, the concentrations of Ag+ and Cl− are in equilibrium.
Step 2: Adding NaCl
When NaCl is added to the solution, it dissociates completely into Na+ and Cl−:
NaCl (s)⇌Na+(aq)+Cl−(aq)
This increases the concentration of Cl− ions in the solution.
Step 3: Apply the Common Ion Effect
The increase in Cl− concentration due to the addition of NaCl will shift the equilibrium of the AgCl dissociation reaction to the left, according to Le Chatelier's principle. This results in a decrease in the concentration of Ag+:
Ag++Cl−⇌AgCl (s)
Thus, as (Cl−) increases, (Ag+) decreases.
Step 4: Relationship Between Concentrations
The solubility product constant (Ksp) for AgCl is given by:
Ksp=(Ag+)(Cl−)
If we let s be the solubility of AgCl, then:
Ksp=s2
As (Cl−) increases (due to the addition of NaCl), (Ag+) must decrease to maintain the constant Ksp.
Step 5: Graphical Representation
When plotting (Ag+) against (Cl−):
- Initially, as (Cl−) increases, (Ag+) decreases.
- The graph will show a downward trend, which can be represented as a curve that approaches the x-axis but does not touch it, indicating that (Ag+) approaches zero as (Cl−) increases.
Conclusion
The graph of (Ag+) versus (Cl−) will appear as a downward curve, indicating the inverse relationship due to the common ion effect.
---
The dissociation of silver chloride (AgCl) in water can be represented as:
AgCl (s)⇌Ag+(aq)+Cl−(aq)
In a saturated solution of AgCl, the concentrations of Ag+ and Cl− are in equilibrium.
When NaCl is added to the solution, it dissociates completely into Na+ and Cl−:
NaCl (s)⇌Na+(aq)+Cl−(aq)
This increases the concentration of Cl− ions in the solution.
The increase in Cl− concentration due to the addition of NaCl will shift the equilibrium of the AgCl dissociation reaction to the left, according to Le Chatelier's principle. This results in a decrease in the concentration of Ag+:
Ag++Cl−⇌AgCl (s)
Thus, as (Cl−) increases, (Ag+) decreases.
The solubility product constant (Ksp) for AgCl is given by:
Ksp=(Ag+)(Cl−)
If we let s be the solubility of AgCl, then:
Ksp=s2
As (Cl−) increases (due to the addition of NaCl), (Ag+) must decrease to maintain the constant Ksp.
When plotting (Ag+) against (Cl−):
- Initially, as (Cl−) increases, (Ag+) decreases.
- The graph will show a downward trend, which can be represented as a curve that approaches the x-axis but does not touch it, indicating that (Ag+) approaches zero as (Cl−) increases.
The graph of (Ag+) versus (Cl−) will appear as a downward curve, indicating the inverse relationship due to the common ion effect.
Topper's Solved these Questions
- BOOK - NARENDRA AWASTHI ENGLISHCHAPTER - IONIC EEQUILIBRIUMEXERCISE - Level- 235videos
IONIC EEQUILIBRIUM
- BOOK - NARENDRA AWASTHI ENGLISHCHAPTER - IONIC EEQUILIBRIUMEXERCISE - Level- 319videos
IONIC EEQUILIBRIUM
- BOOK - NARENDRA AWASTHI ENGLISHCHAPTER - GASEOUS STATEEXERCISE - Subjective problems15videos
GASEOUS STATE
- BOOK - NARENDRA AWASTHI ENGLISHCHAPTER - SOLID STATEEXERCISE - Subjective Problems13videos
SOLID STATE
Similar Questions
How much the concentration of Ag⊕ions in a saturated solution of AgCI diminish if such an amount of HCI is added to it that the concentration of CIΘ ions in the solution becomes equal to 0.03M? Also find the amount of AgCI precipitated at the given concentration. Ksp of AgCI=1.8×10⁻¹⁰.
View SolutionNaCl solution is added to a saturated solution of PbCl2. What will happen to the concentration of Pb+2 ions?
View SolutionNaCI solution is added to a saturated solution of PbCI2 . What will happen to the concentration of Pb+2 ions ?
View SolutionThe shape of the curve obtained when substrate concentration is plotted against velocity of reaction
View SolutionIn a saturated aqueous solution of AgBr, concentration of Ag+ ion is 1×10⁻⁶ mol L−1 it Ksp for AgBr is 4×10⁻¹³, then concentration of Br− in solution is
View SolutionIf a thin slice of sugar beet is placed in concentrated solution of NaCl, then
View SolutionIn 0.1M HCl solution, 0.1M NaOH solution is added gradually then identify the correct graph in this titration
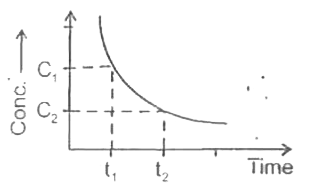
View SolutionThe graph plotted between concentration versus time
 View Solution
The product of the concentration of the ions of an electrolyte raised to power of their coefficients in the balanced chemical equation in the solution at any concentration . Its value is not constant and varies with change in concentration . Its value is not constant and varies with change in concentration . Its value is not constant and varies with change in concentration . Ionic product of the saturated solution is called solubility product Ksp
(i) When Kip=Ksp , the solution is just saturated and no precipitation takes place .
(ii) When Kip<Ksp the solution is unsaturated and precipitation will not take place .
When Kip>KsP the solution is supersaturated and precipitation takes place .
The concentration of Ag+ ions in a given saturated solution of AgCl at 25∘C is 1.06×10⁻⁵ g ion per litre . The solubility product of AgCl is :View SolutionThe solubility proudct of AgCl at 25∘C is 1×10⁻¹⁰ A solution of Ag+ at a concentration 4×10⁻³ M just fails to yield a prenciitate of AgCl with concentration of 1×10⁻³MCl− when the concentration of NH3 in the solution is 2×10⁻²M. Calculate the equlibrium constant for [Ag(NH3)2)⇔Ag++2NH3
View Solution

