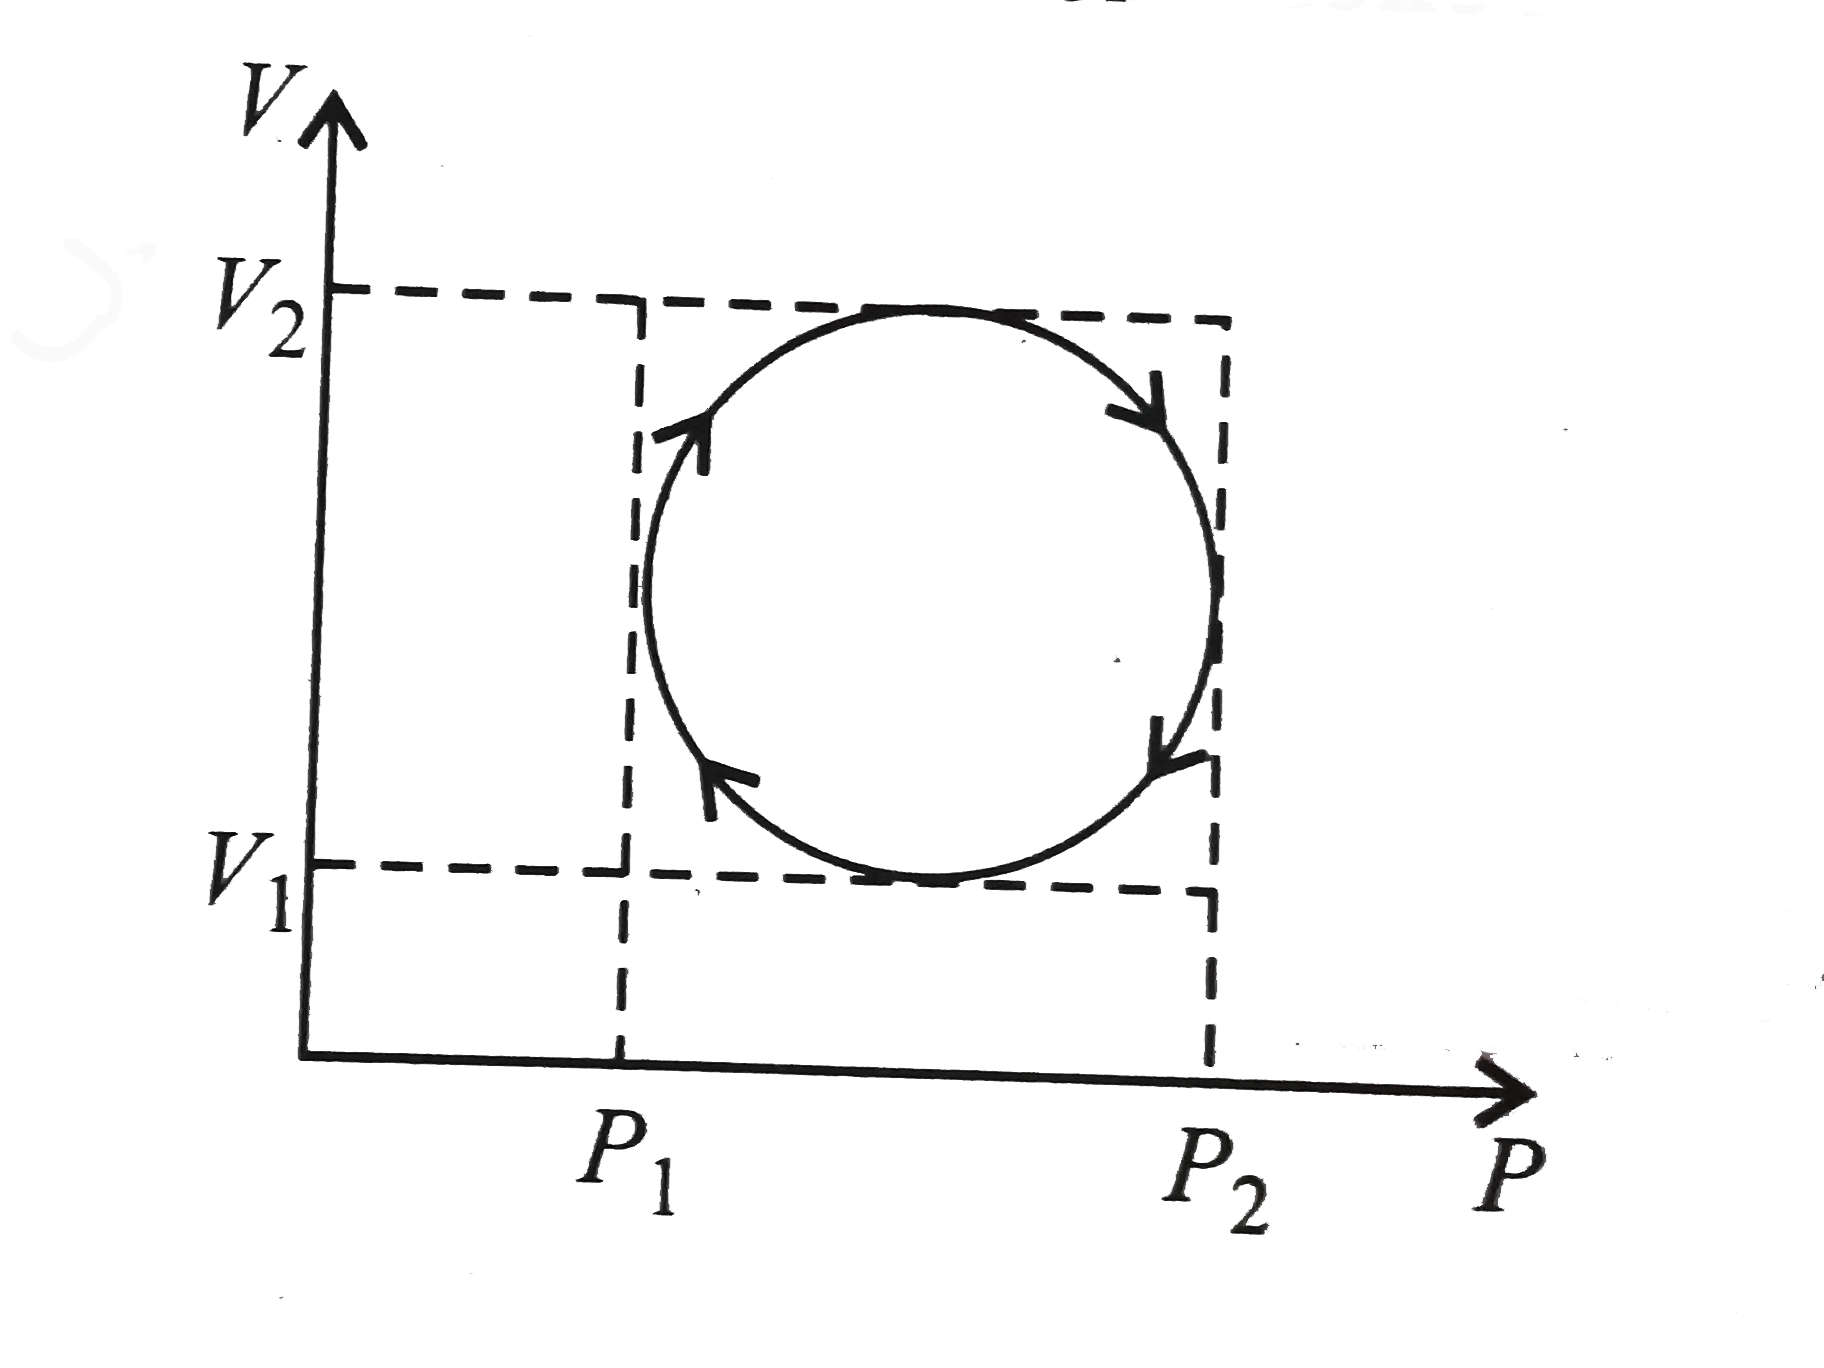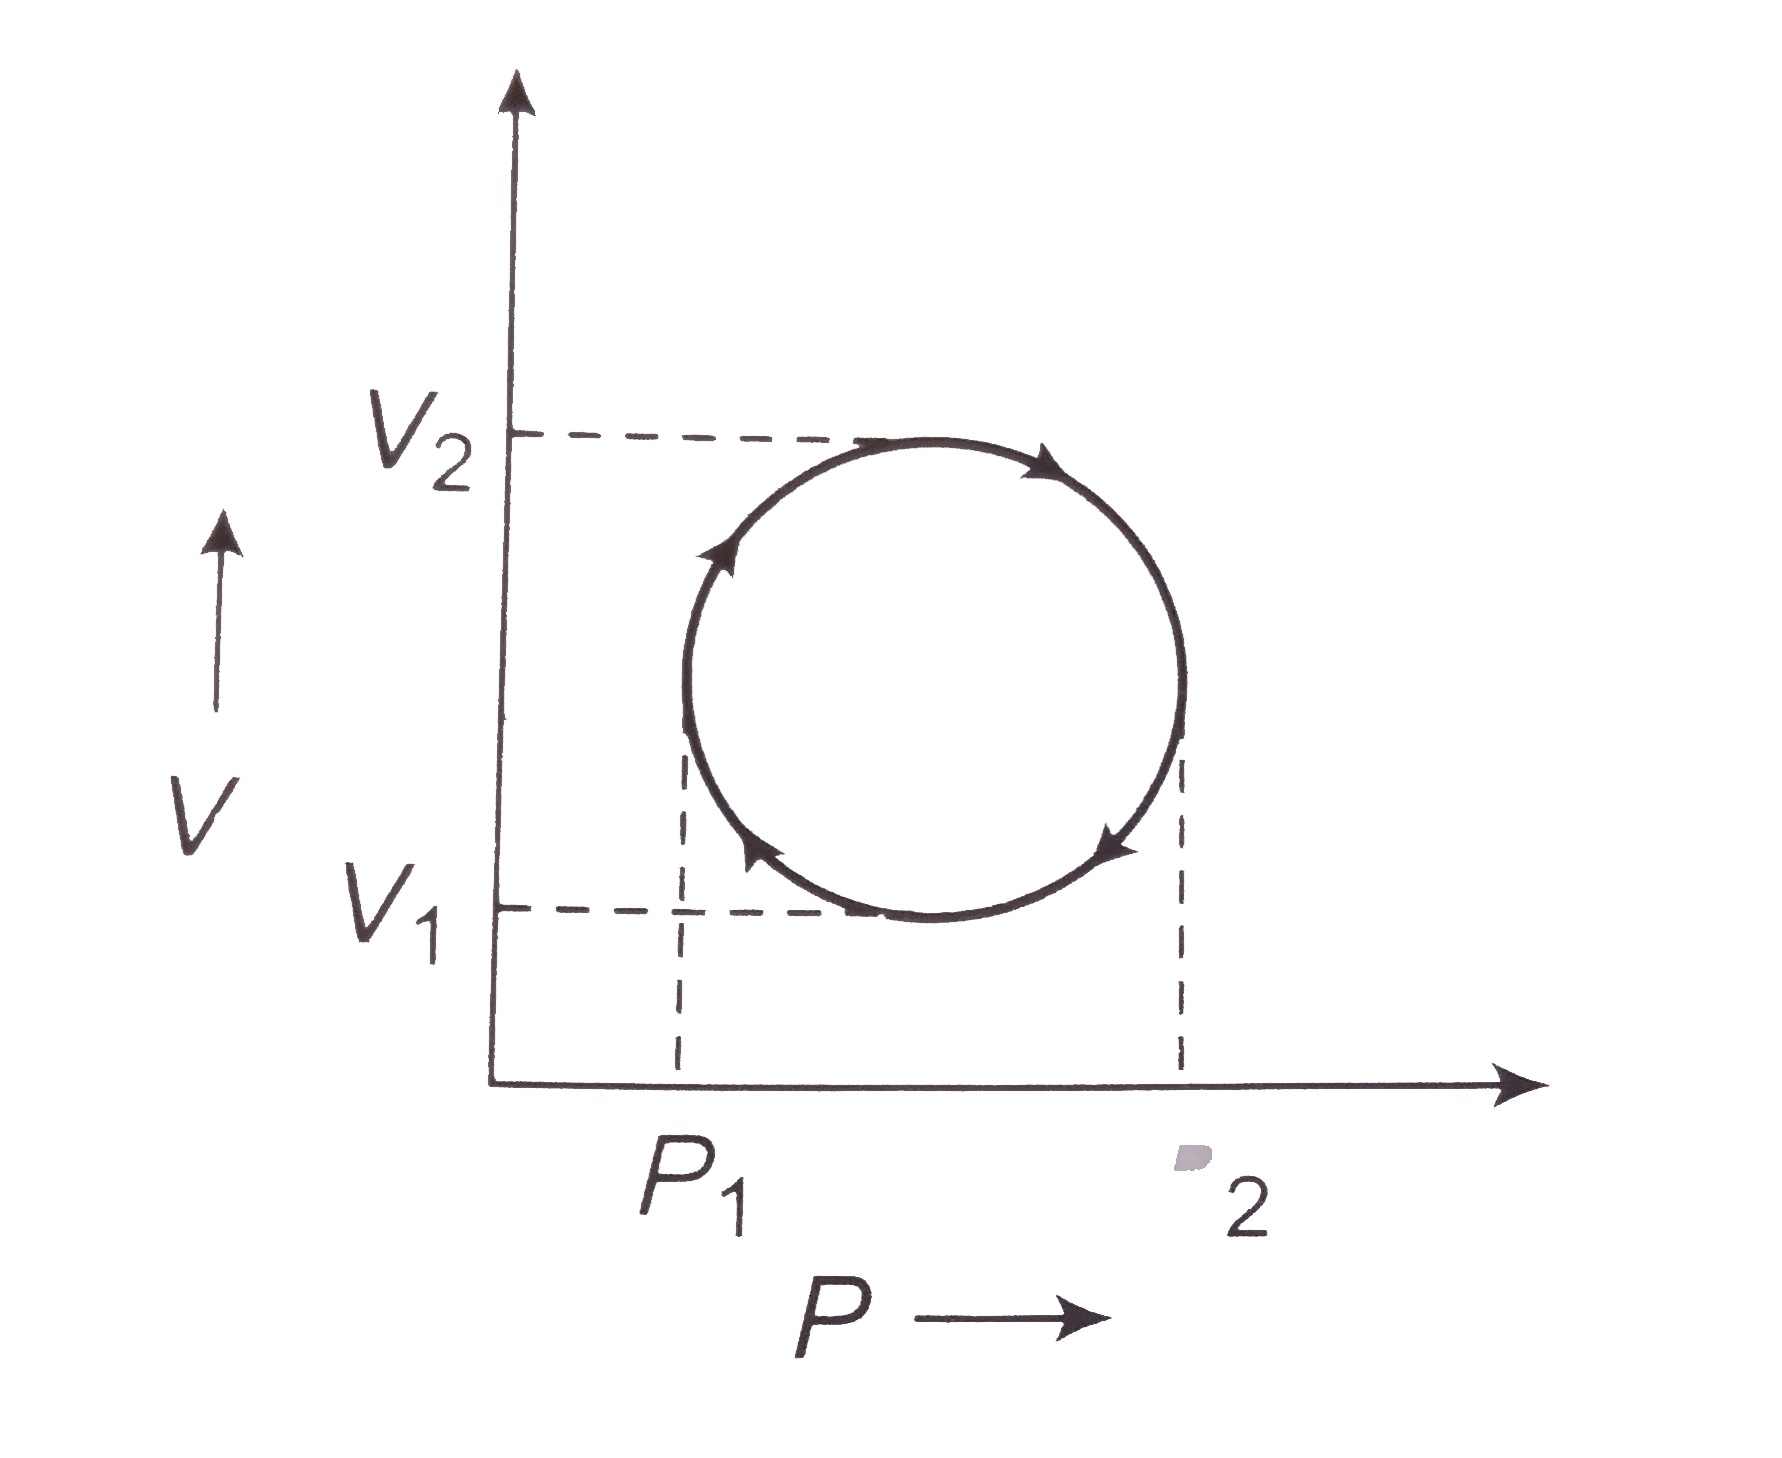
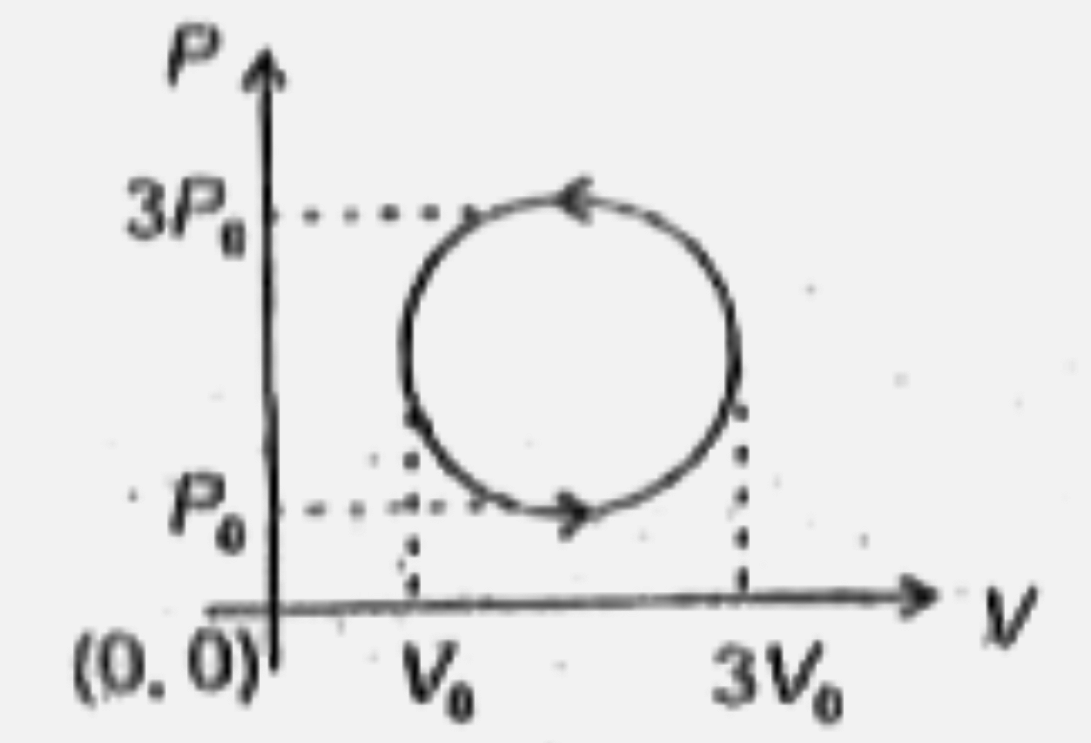
In the cyclic process shown in the V−P diagram the magnitude of the work is done is
A
π(P2−P12)2
B
π(V2−V12)2
C
π4(P2−P1)(V2−V1)
D
π(V2−V1)2
Video Solution
Text Solution
The correct Answer is:C
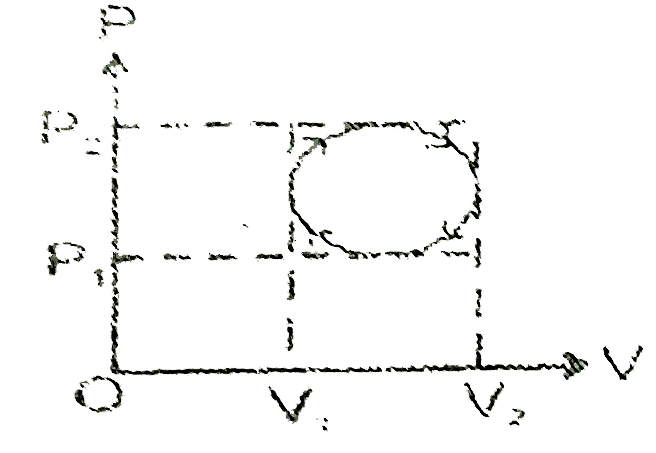
Process direction in V-P diagram is clockwise so process direction in P-V diagram is anti-clockwise.
Net work done by system = Area
=π×(P2−P1)2.(V2−V1)2
|
Updated on:21/07/2023
Topper's Solved these Questions
Similar Questions
Knowledge Check
- Question 1 - Select One
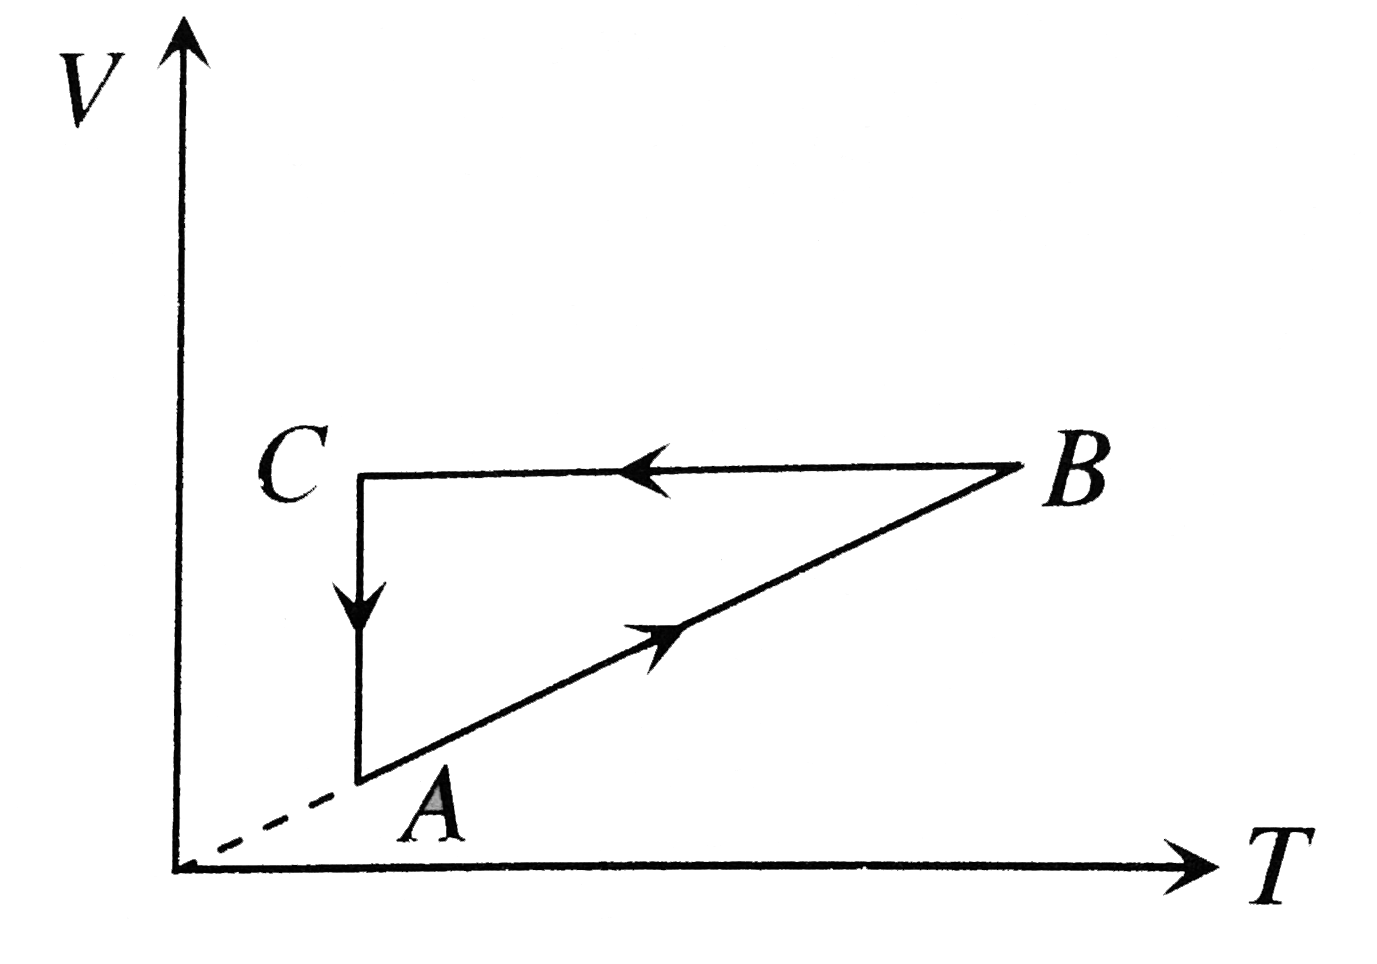
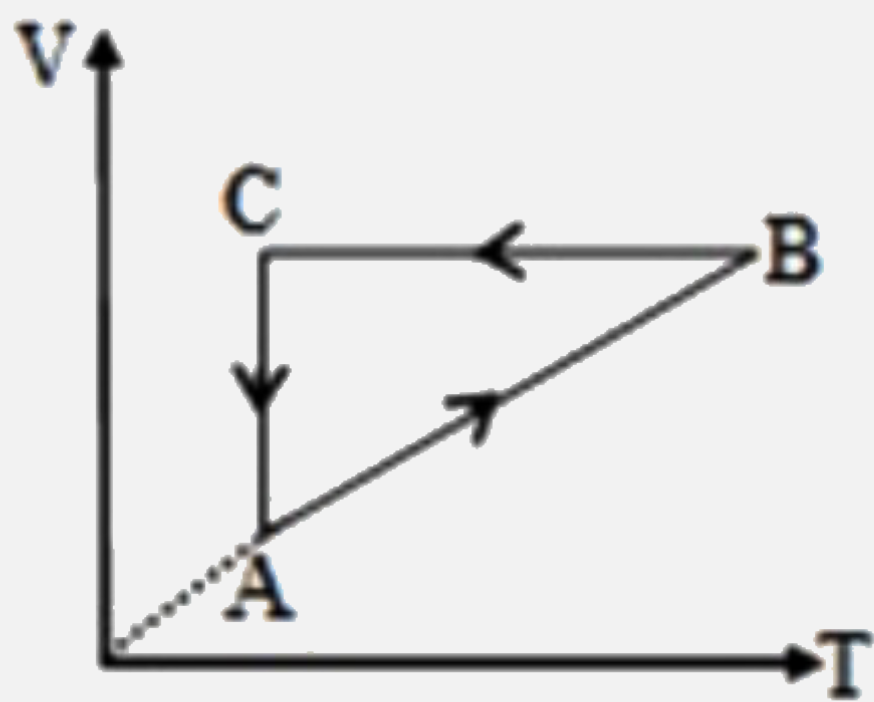
A cyclic process ABCA is shown in the V−T diagram process on the P−V
 A
A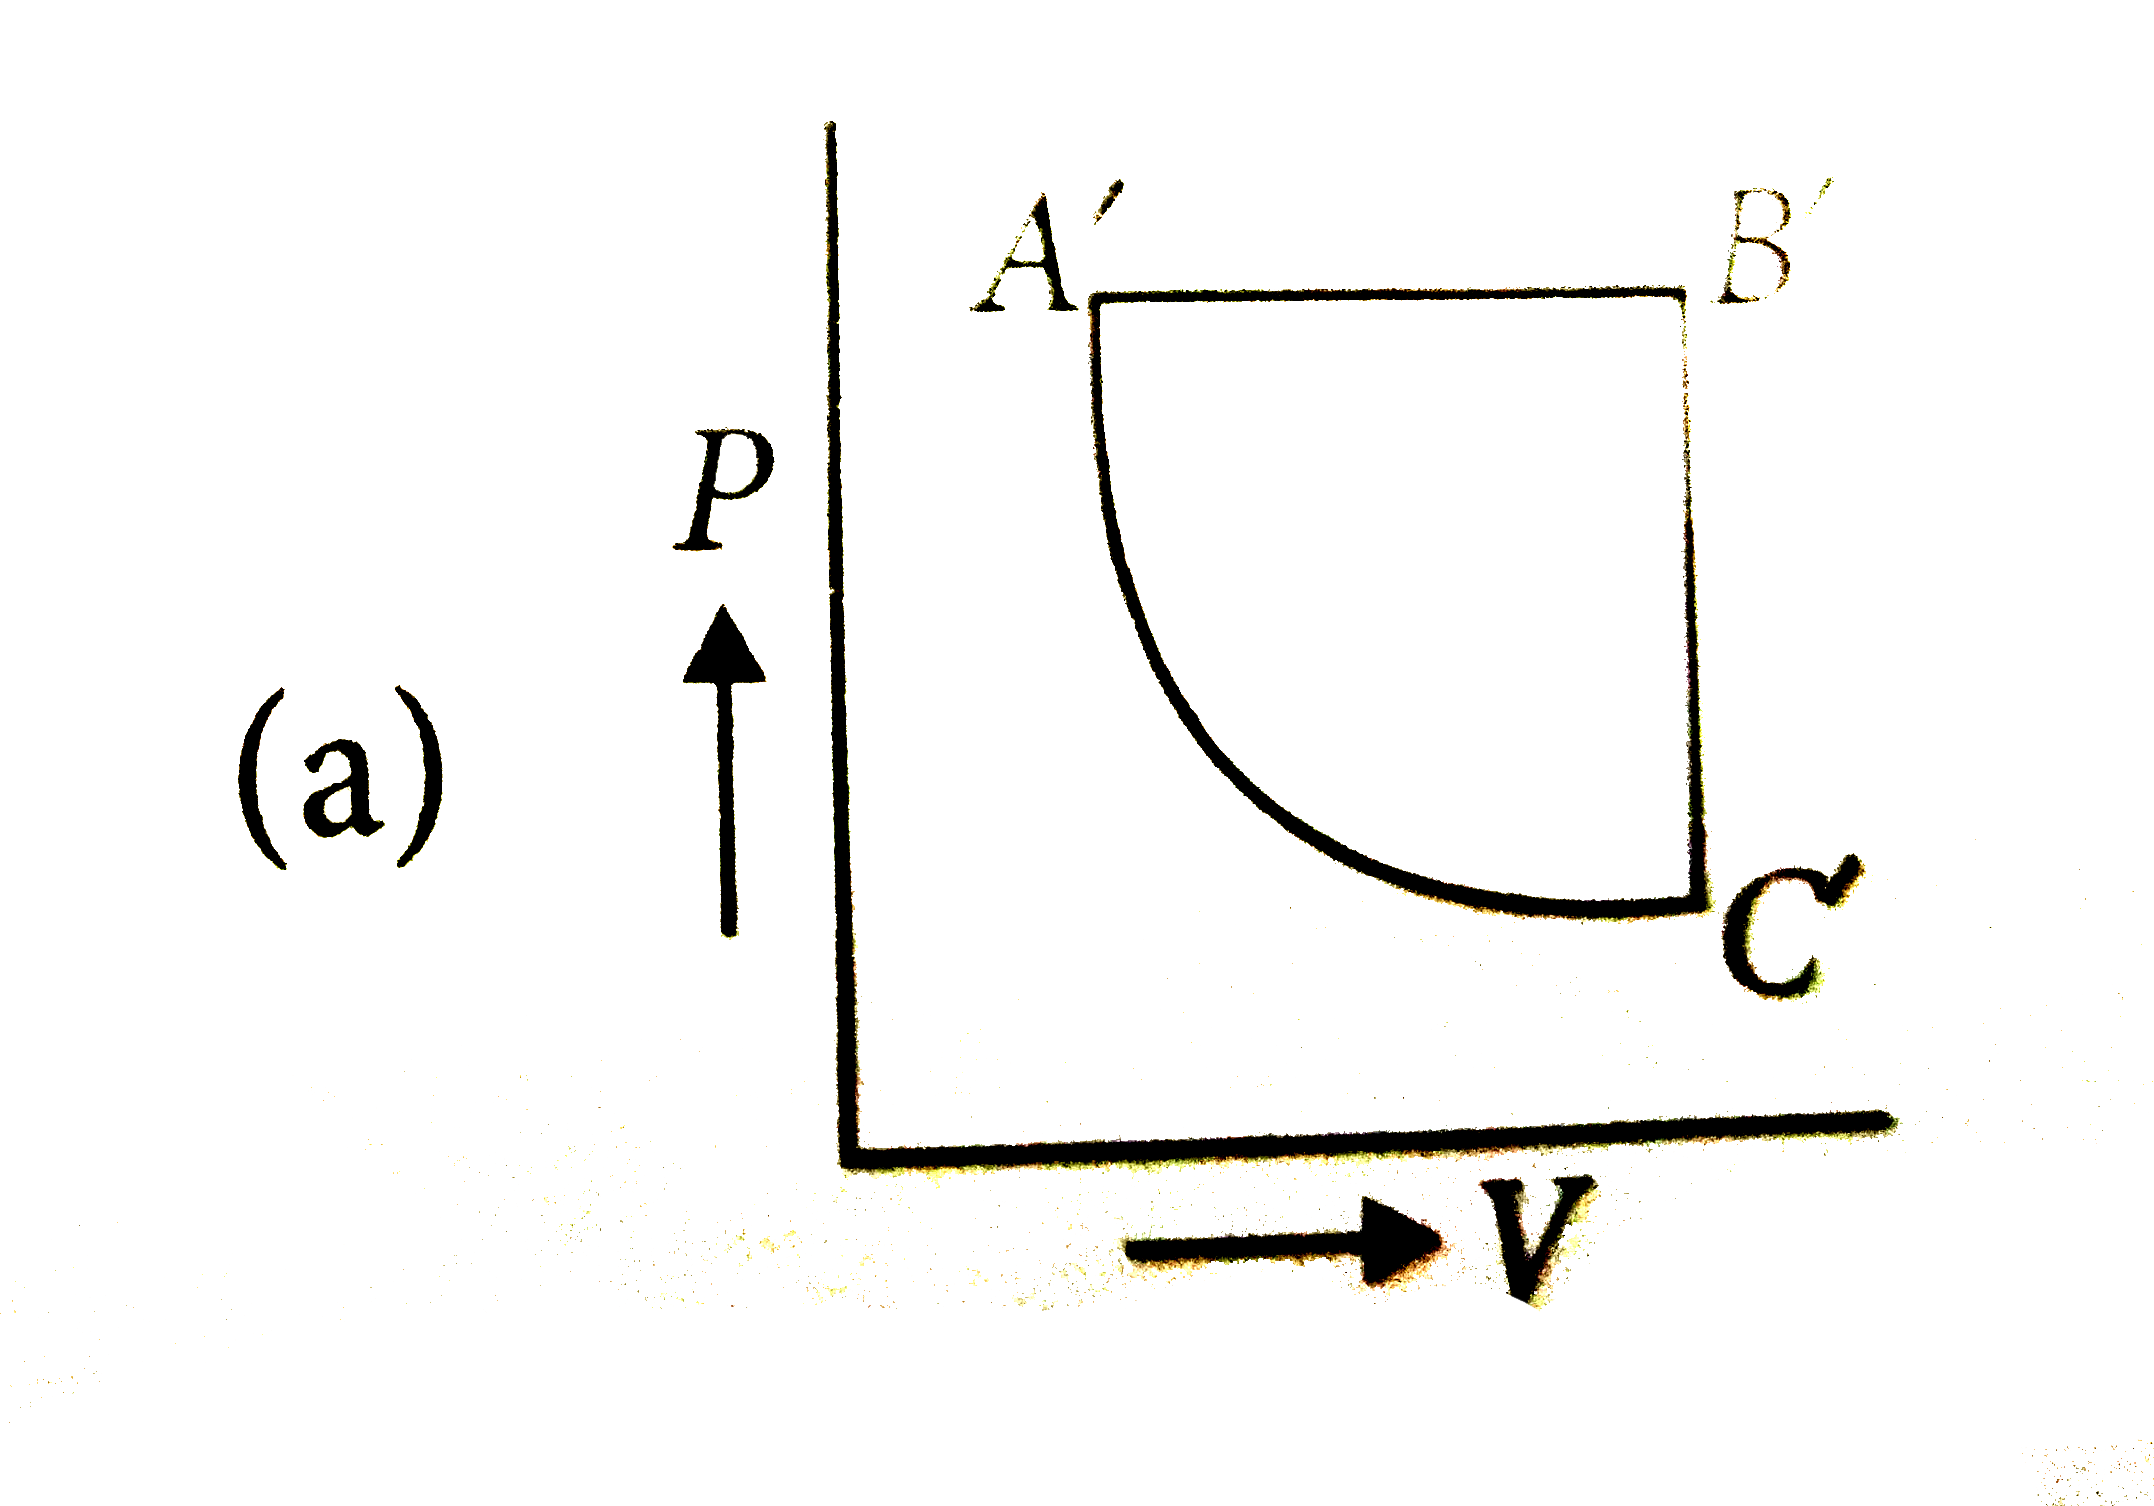 B
B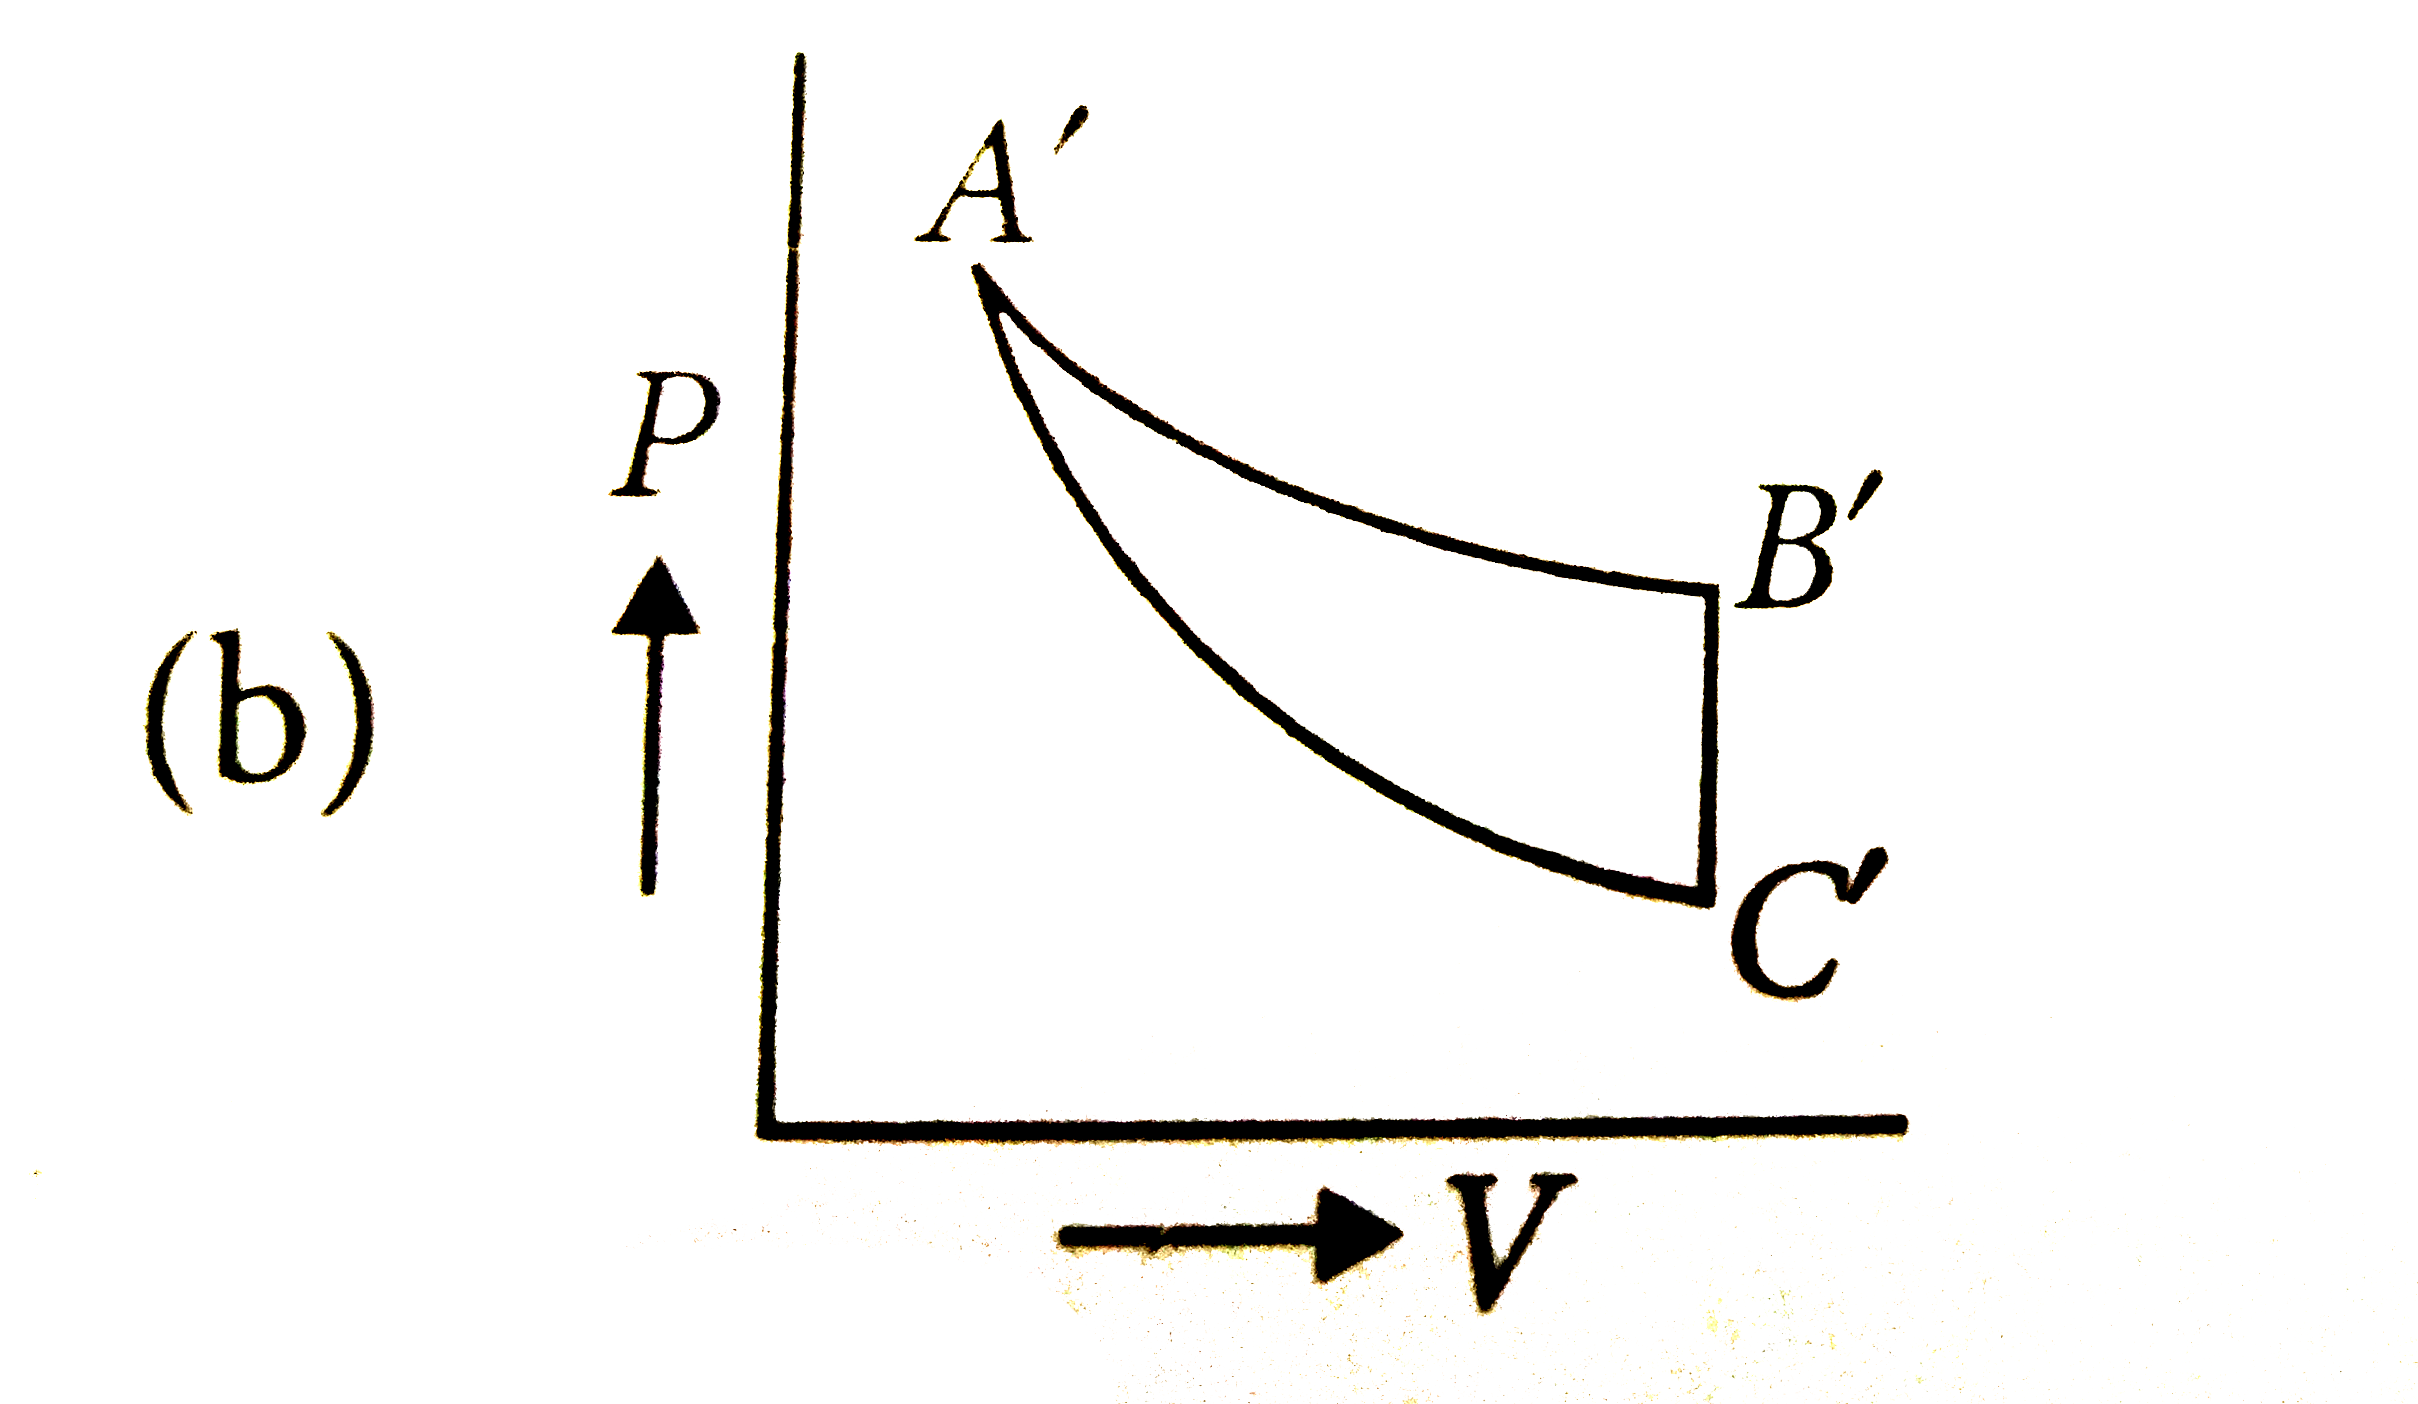 C
C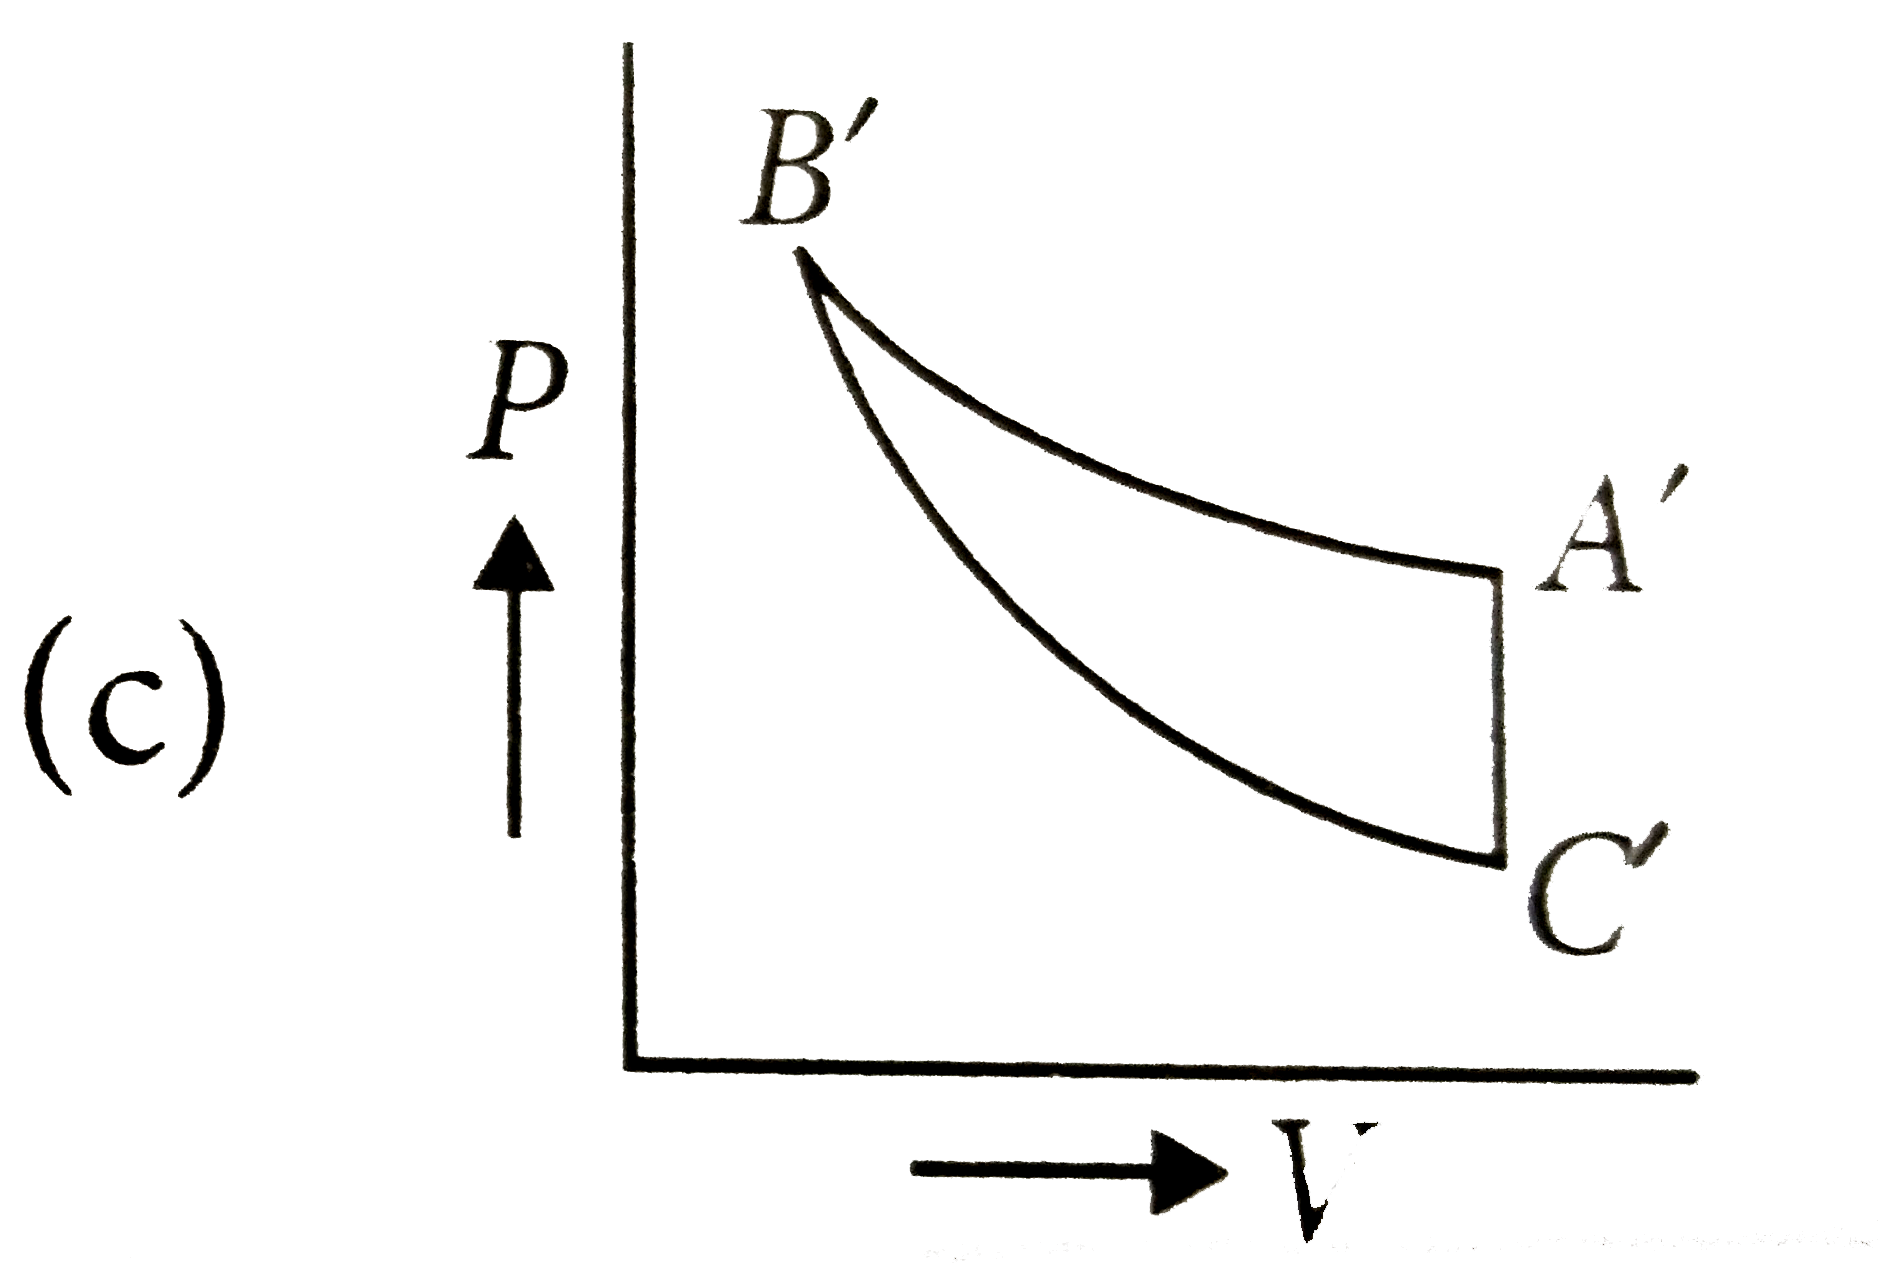 D
D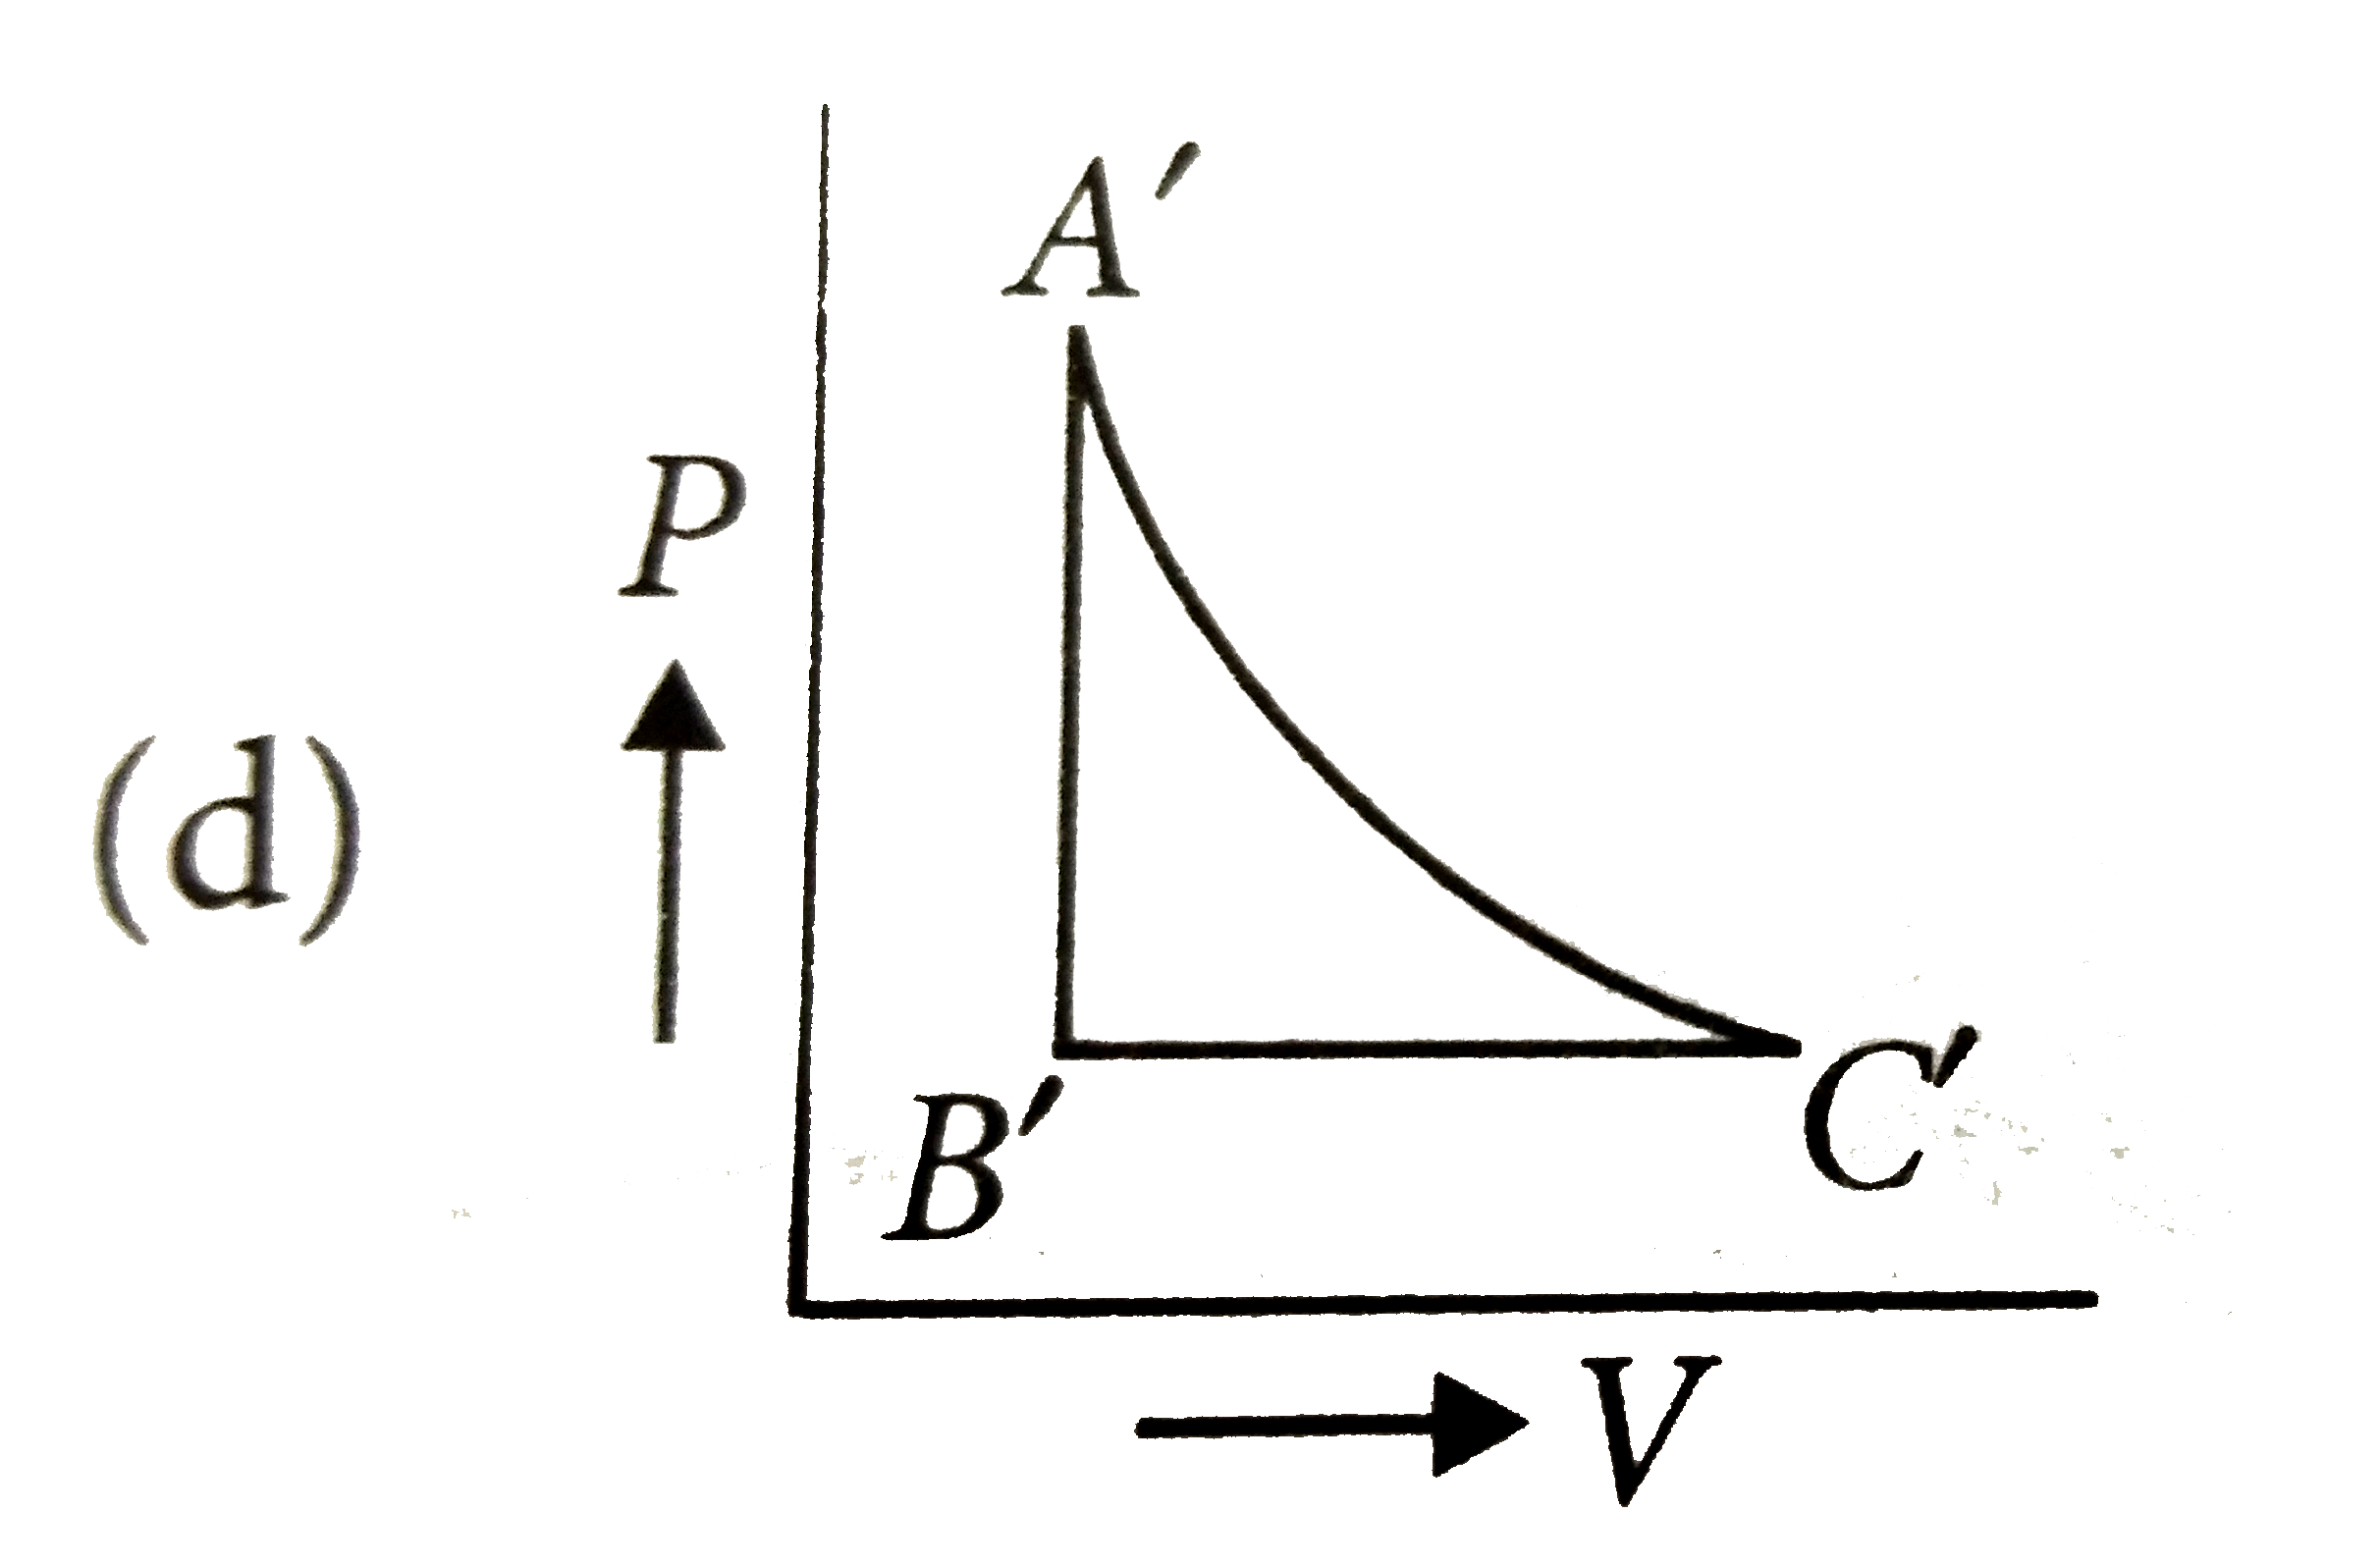
- Question 2 - Select One
An ideal gas undergoes cyclic process ABCDA as shown in given p−V diagram. The amount of work done by the gas is
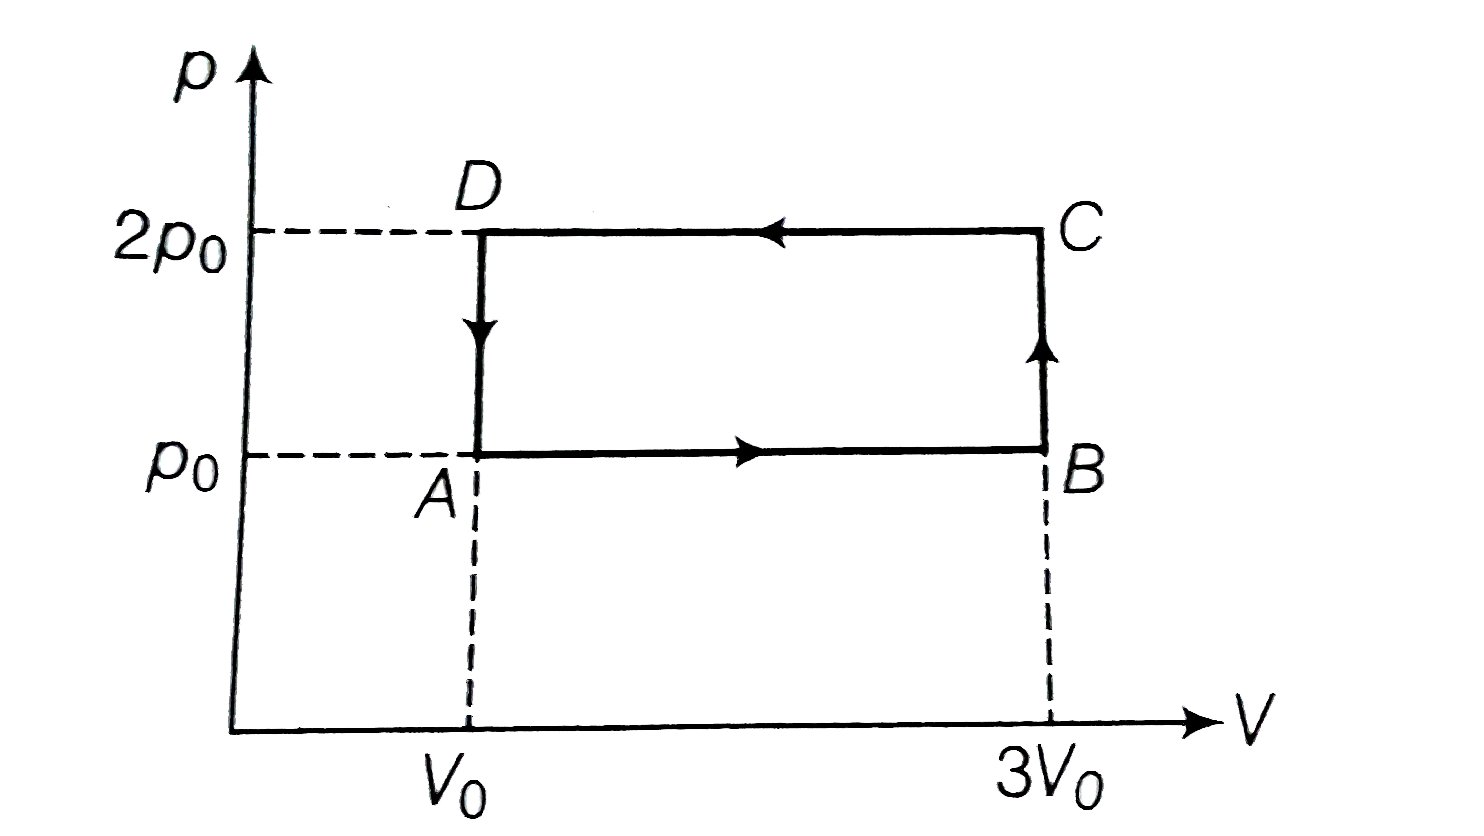 A6P0V0B−2P0V0C+2P0V0D+4P0V0
 - Question 3 - Select One
One mole of an ideal gas undergoes a cyclic process ABCDA as shown in the P-V diagram, The net work done in the process is
(1 atm=10^(6) dyne cm^(-2))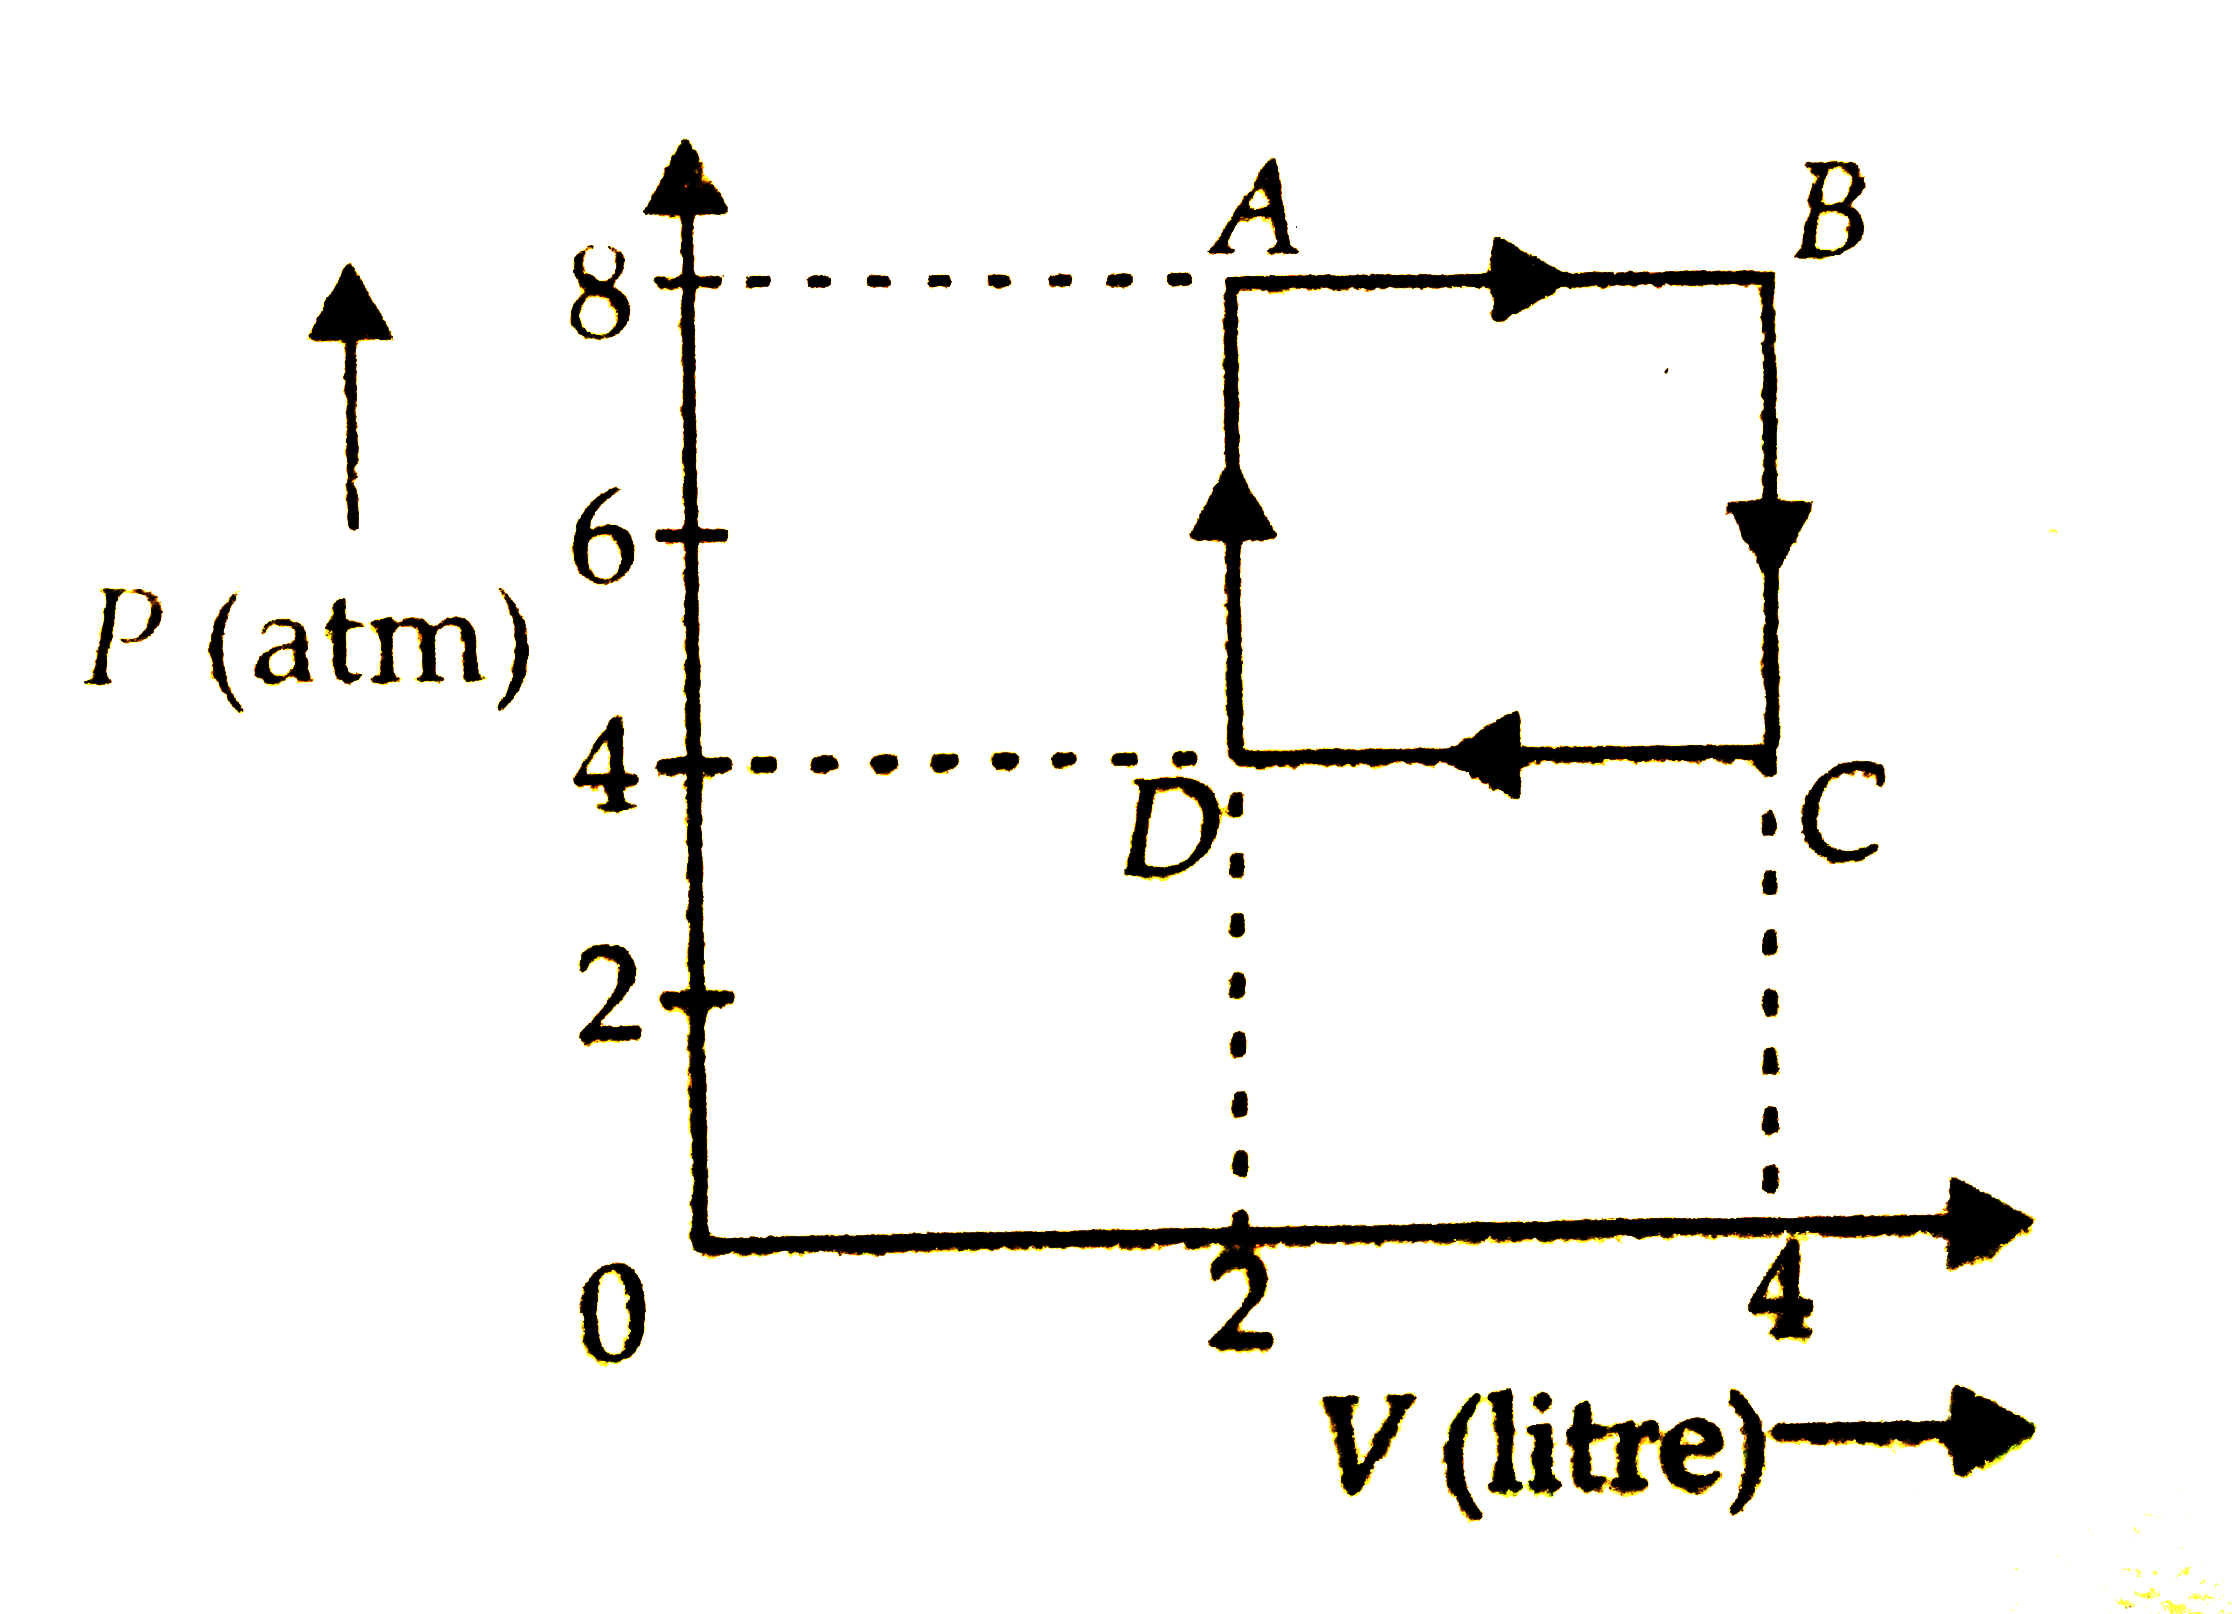 A500 JB700 JC800 JD900 J
Work done in the cyclic process shown in figure is
 View Solution
An ideal gas undergoes cyclic process ABCDA as shown in givend p−V diagram. The amount of work done by the gas is
 View Solution
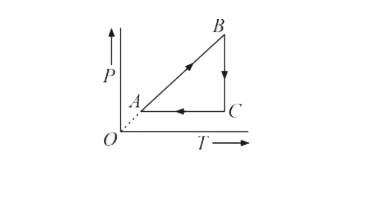
A cyclic process ABCA is shown in the V - T diagram . Process on the P – V diagram is
 View Solution
A cyclic process is shown in the P−T diagram.
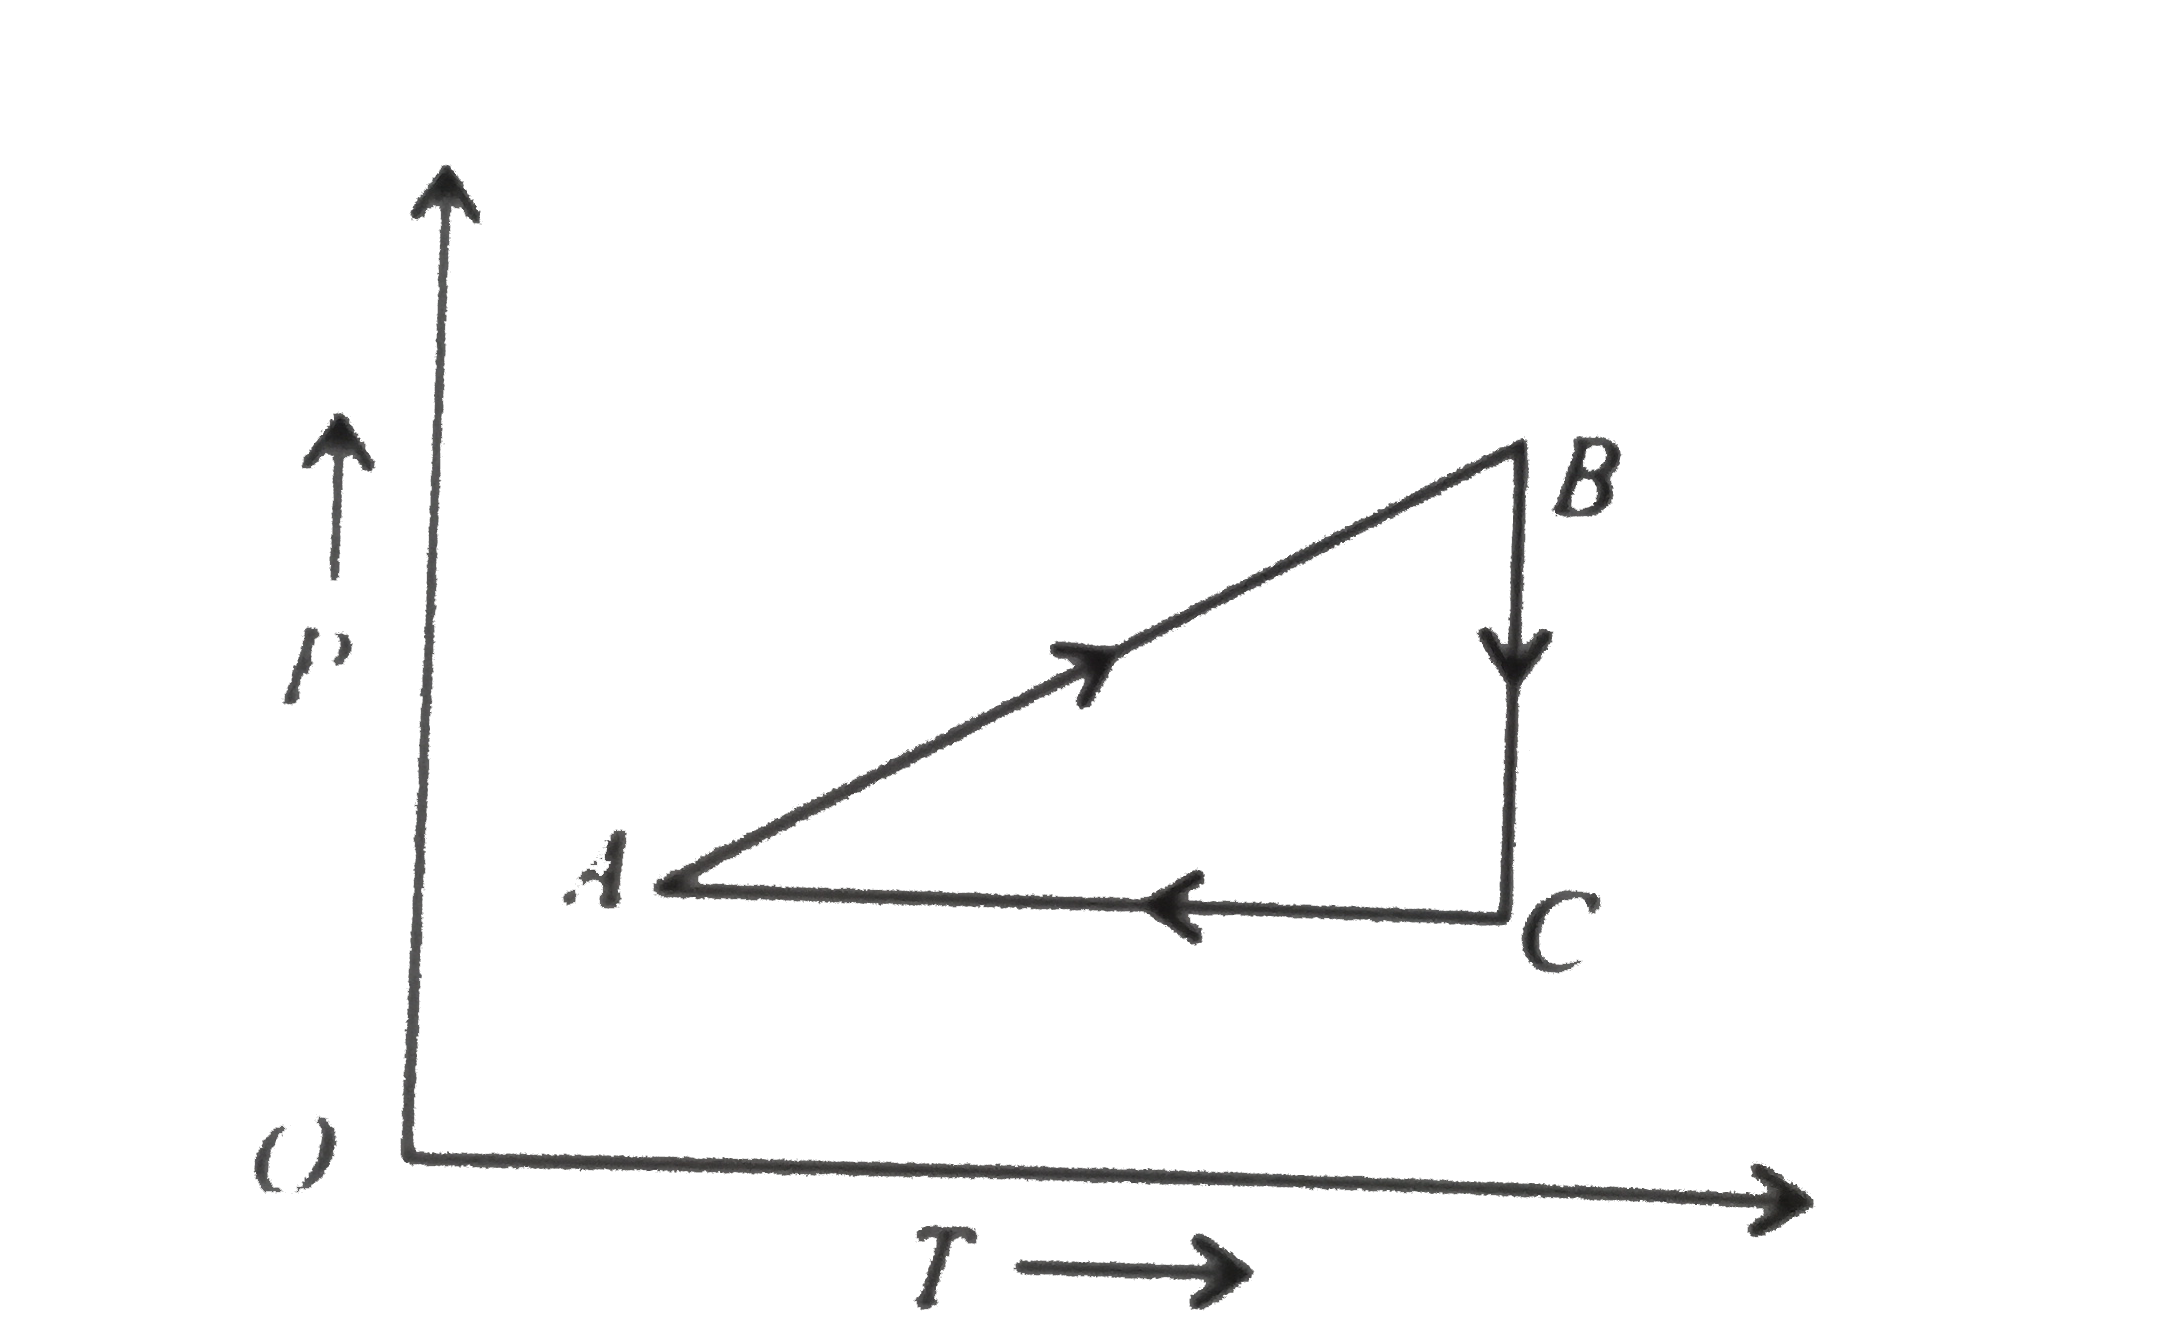
Which of the curve shows the same process on a V−T diagram?View SolutionA cyclic process is shown in theP–T diagram. Which of the curves show the same process on a V–T diagram?
 View Solution


