Two sound sources of frequency 9Hz and 11Hz are sounded together then which plot is correct after superposition of sound waves.
_2019_CBT6_E01_052_O01.png)
_2019_CBT6_E01_052_O02.png)
_2019_CBT6_E01_052_O03.png)
_2019_CBT6_E01_052_O04.png)
The correct Answer is:B
To solve the problem of determining the correct plot after the superposition of sound waves from two sources with frequencies of 9 Hz and 11 Hz, we can follow these steps:
Step 1: Identify the Frequencies
We have two sound sources:
- Frequency f1=9Hz
- Frequency f2=11Hz
Step 2: Calculate the Beat Frequency
The beat frequency fb can be calculated using the formula:
fb=|f2−f1|
Substituting the values:
fb=|11Hz−9Hz|=2Hz
Step 3: Calculate the Time Period of the Beats
The time period Tb of the beats is given by the reciprocal of the beat frequency:
Tb=1fb
Substituting the value of fb:
Tb=12Hz=0.5seconds
Step 4: Analyze the Graphs
We need to find a graph that shows one beat occurring in 0.5 seconds. This means that in one complete cycle of the beat, we should observe a rise and fall in amplitude corresponding to the beat frequency.
Step 5: Determine the Correct Plot
- In the correct plot, we should observe that within a time span of 0.5 seconds, there is one complete cycle (one beat).
- If we check the options, we will find that the plot that shows one complete cycle in 0.5 seconds is the correct one.
Conclusion
Thus, the correct answer is the plot that shows one beat occurring in 0.5 seconds.
---
We have two sound sources:
- Frequency f1=9Hz
- Frequency f2=11Hz
The beat frequency fb can be calculated using the formula:
fb=|f2−f1|
Substituting the values:
fb=|11Hz−9Hz|=2Hz
The time period Tb of the beats is given by the reciprocal of the beat frequency:
Tb=1fb
Substituting the value of fb:
Tb=12Hz=0.5seconds
We need to find a graph that shows one beat occurring in 0.5 seconds. This means that in one complete cycle of the beat, we should observe a rise and fall in amplitude corresponding to the beat frequency.
- In the correct plot, we should observe that within a time span of 0.5 seconds, there is one complete cycle (one beat).
- If we check the options, we will find that the plot that shows one complete cycle in 0.5 seconds is the correct one.
Thus, the correct answer is the plot that shows one beat occurring in 0.5 seconds.
Topper's Solved these Questions
- JEE MAINSBook:JEE MAINS PREVIOUS YEAR ENGLISHChapter:JEE MAINSExercise:Chemistry
Explore 1 Video
- JEE MAINBook:JEE MAINS PREVIOUS YEAR ENGLISHChapter:JEE MAINExercise:All Questions
Explore 452 Videos
- JEE MAINS 2020Book:JEE MAINS PREVIOUS YEAR ENGLISHChapter:JEE MAINS 2020Exercise:PHYSICS
Explore 250 Videos
Similar Questions
Four tuning forks of frequencies 200,201,204 and 206 Hz are sounded together. The beat frequency will be
View SolutionTwo tuning forks have frequencies 380 and 384 Hz respectively. When they are sounded together they
produce 4 beats. After hearing the maximum sound how long will it take to hear the minimum sound
View Solution[Q. Nos. 7-8] You have three forks A, B, and C Fork B has a frequency of 440 What A and B are sounded together a frequency of 3 Hz is heard. When B and C sounded together, the beat frequency is 4 Hz. The possible frequencies of C are: a) 437 Hz and 443 Hz b) 436 Hz and 444 Hz c) 436 Hz and 445 Hz d) 437 Hz and 444 Hz
View SolutionTwo sounds of very close frequencies, say 256 Hz and 260 Hz are produced simultaneously. What is the frequency of resultant sound and also write the number of beats heard in one second?
View SolutionTwo open pipes A and B are sounded together such that beats are heard between the first overtone of A and second overtone of B. If the fundamental frequency of A and B is 256Hz and 170Hz respectively , then the beat frequency heard is
View SolutionA whistle producing sound waves of frequencies 9500Hz and above is approaching a stationary person with speed vms−1. The velocity of sound in air is 300ms−1. If the person can hear frequencies upto a maximum of 10,000Hz.The maximum value of v upto which he can hear whistle is
View Solutionif three sources of sound of equal intensities and having frequencies 300 Hz , 301 Hz and 302 Hz are sounded together, the number of beats heard is
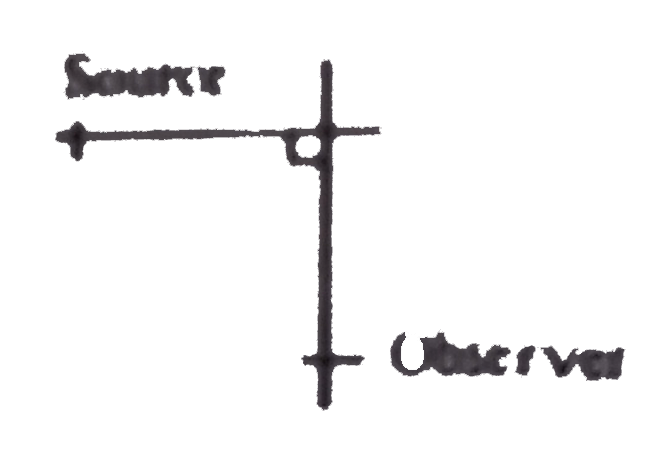
View SolutionA source and an observer are situated on two perpendicular tracks as shown in the figure the observer is at rest and source is moving with a speed 50m/s the source emits sound waves of frequency 90Hz which travel in the medium with velocity 200m/s the frequency of sound heard by observer when the source crosses the origin is

View SolutionCalculate the beat frequency heard when two sound sources of wavelength 35cm and 35.2 cm are sounded together. The speed of sound in air is 330 ms−1
View SolutionHow is sound produced? Name two sources of sound.
View Solution
