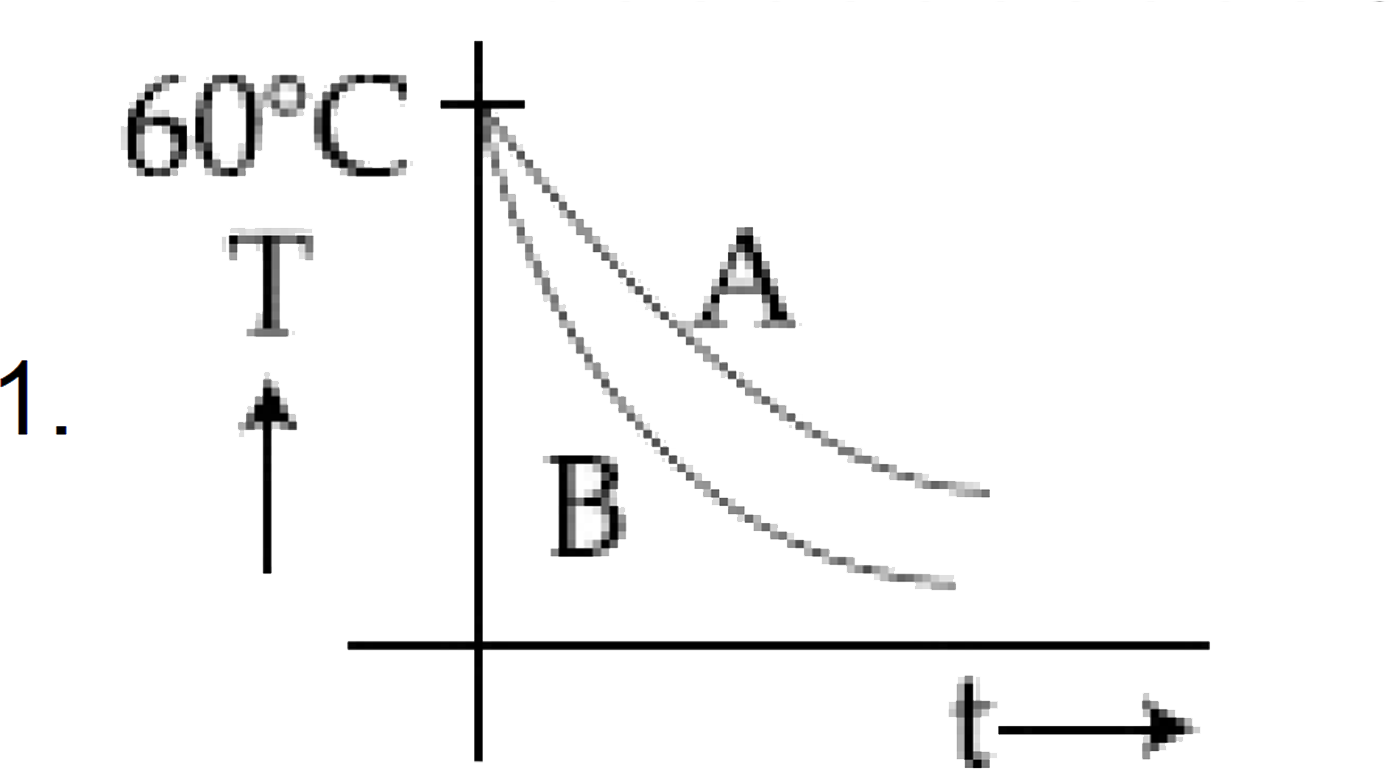
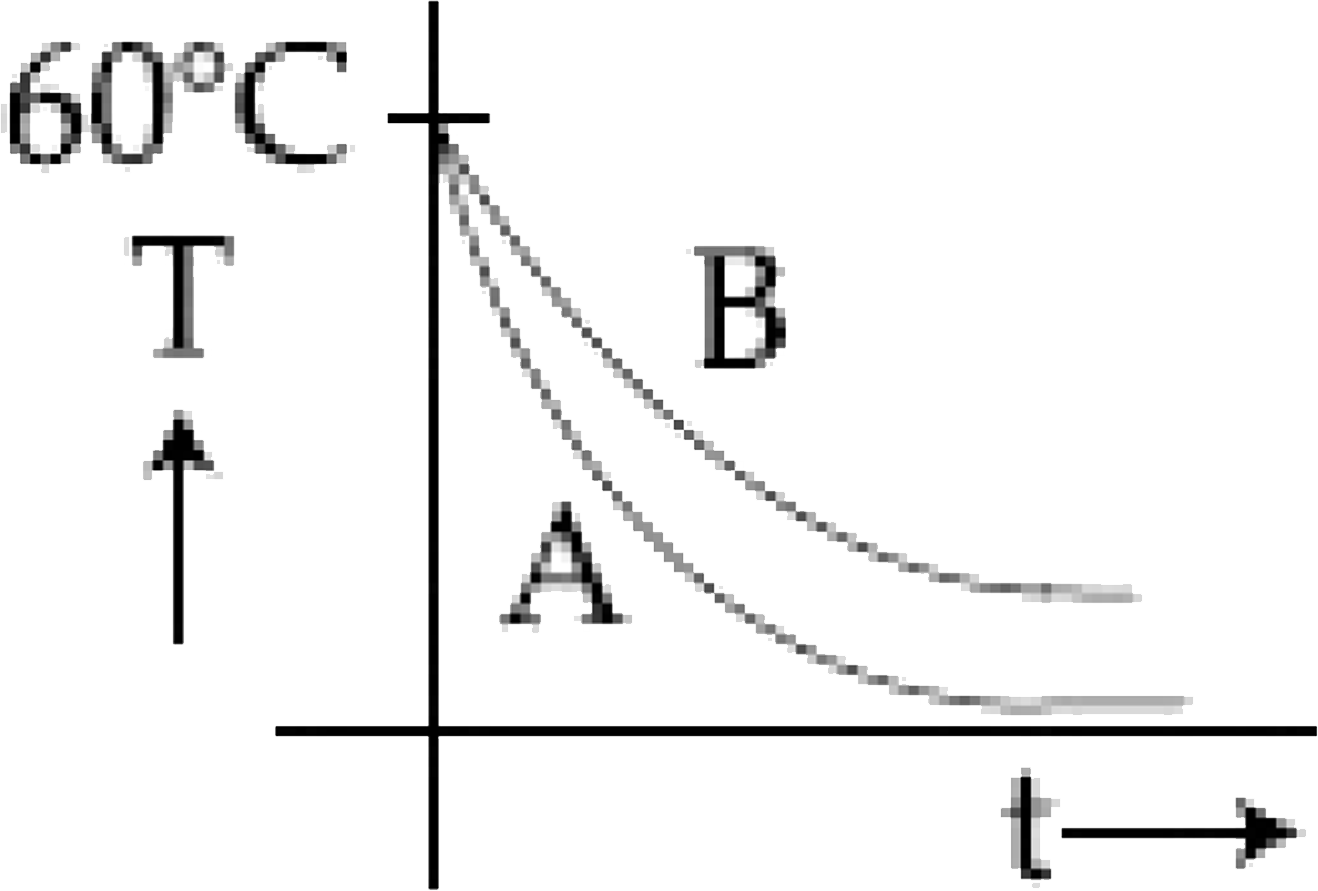
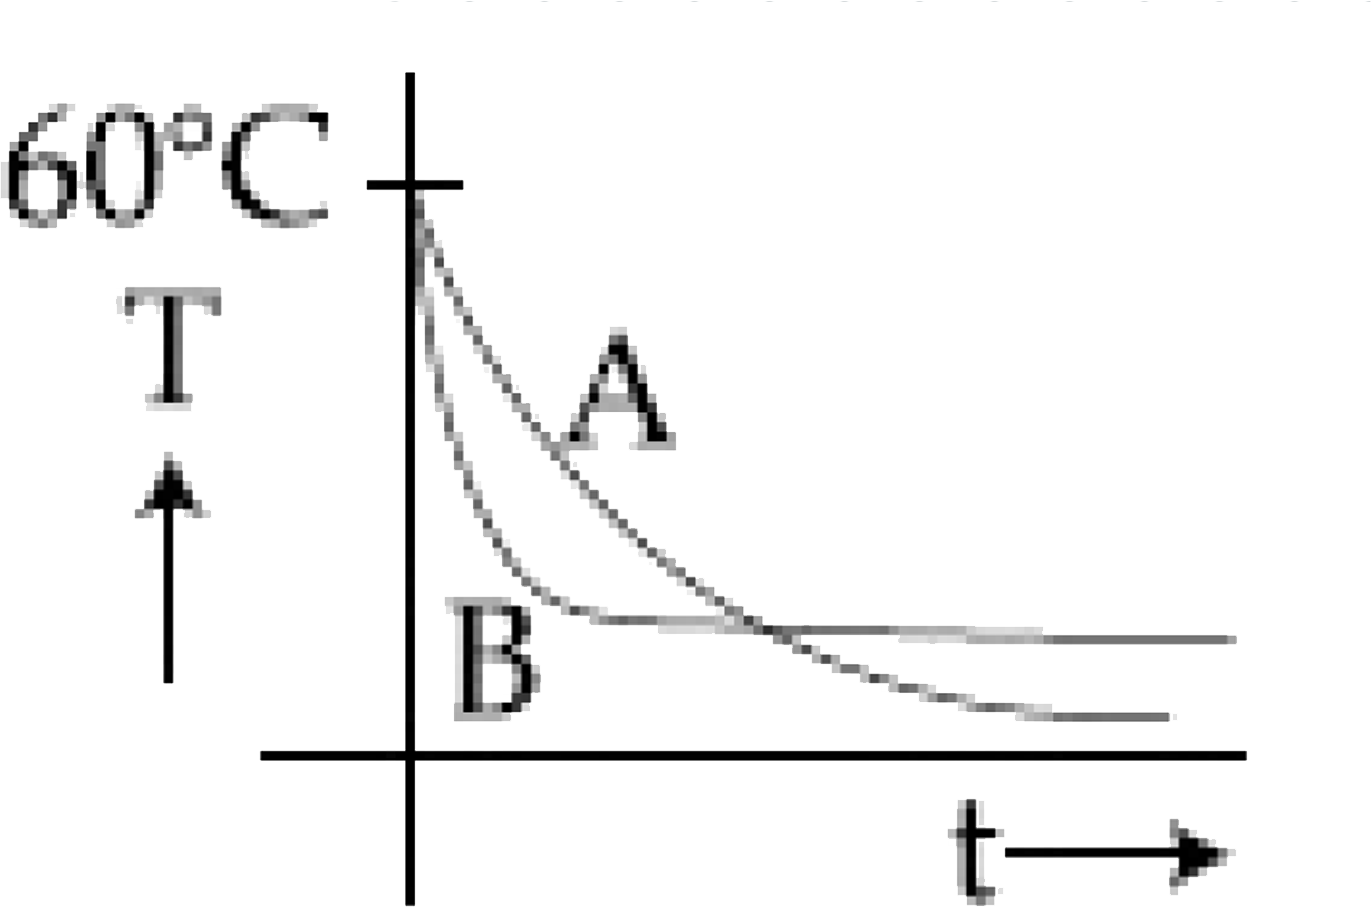
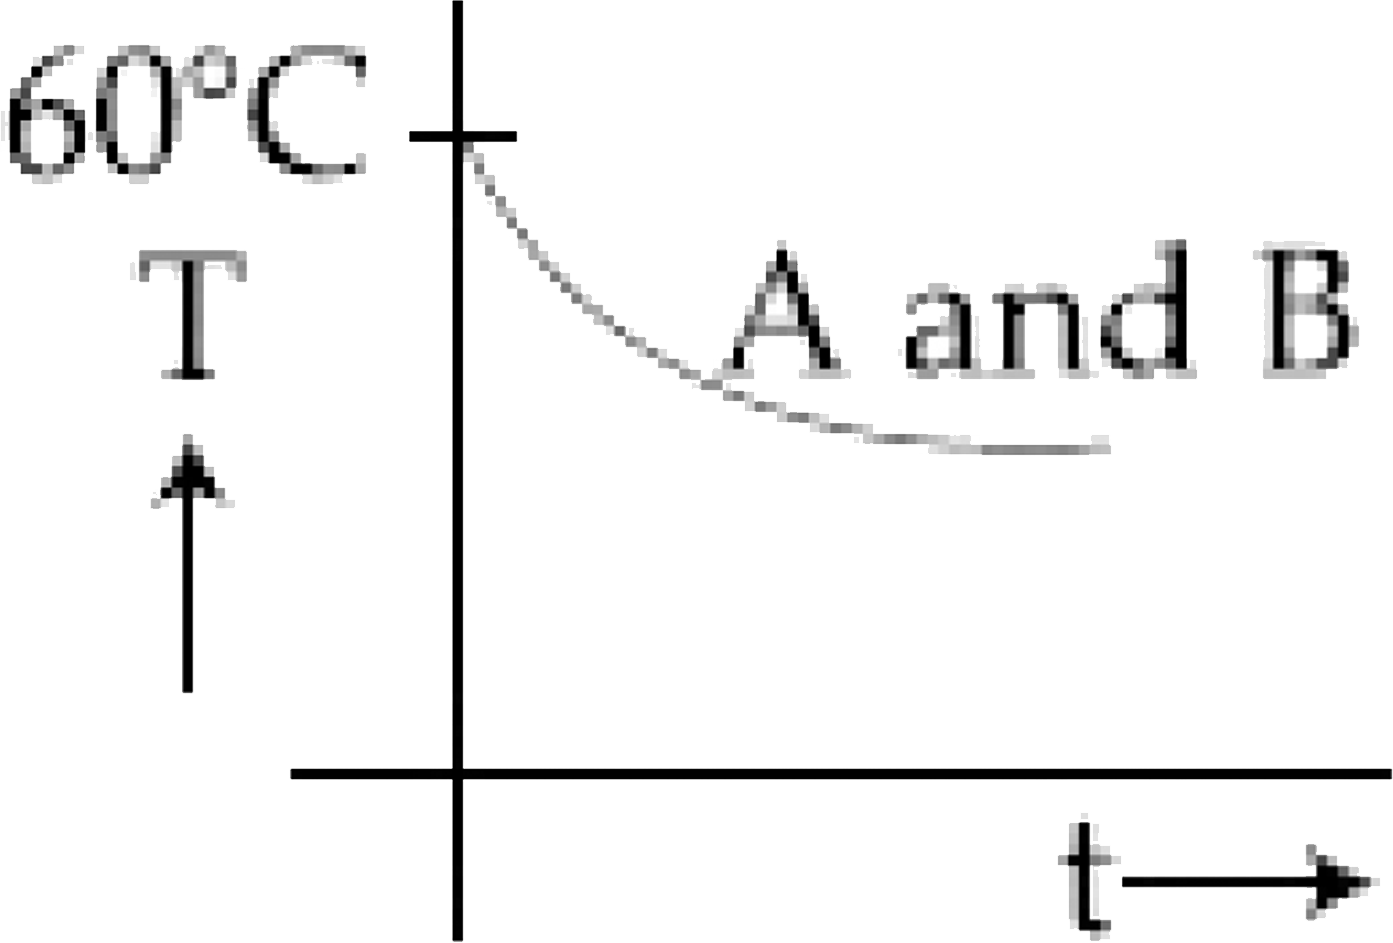
Two identical beakers A and B contain equal volumes of two different liquids at 60∘C each and left to cool down. Liquid in A has density of 8×10²kg/m2 and specific heat of 2000Jkg−1K−1 while liquid in B has density of 103kgm−3 and specific heat of 400Jkg−1K−1. Which of the following best describes their temperature versus time graph schematically? (assume the emissivity of both the beakers to be the same)


The correct Answer is:B
To solve the problem, we need to analyze the cooling rates of the two liquids in beakers A and B based on their mass and specific heat capacities. We will use Newton's law of cooling to derive the temperature versus time graph.
1. Identify the Given Data:
- Beaker A:
- Density, ρA=8×10²kg/m3
- Specific heat, cA=2000J/(kg K)
- Beaker B:
- Density, ρB=103kg/m3
- Specific heat, cB=400J/(kg K)
- Both liquids start at T0=60∘C.
2. Calculate the Mass of Liquids:
- Let the volume of each liquid be V.
- Mass of liquid in beaker A:
mA=ρA⋅V=(8×10²)⋅V=800Vkg
- Mass of liquid in beaker B:
mB=ρB⋅V=(103)⋅V=1000Vkg
3. Calculate the Heat Capacity (m*c) for Each Liquid:
- Heat capacity for liquid A:
mA⋅cA=(800V)⋅(2000)=1.6×10⁶VJ/K
- Heat capacity for liquid B:
mB⋅cB=(1000V)⋅(400)=4.0×10⁵VJ/K
4. Determine the Cooling Rate Using Newton's Law of Cooling:
- According to Newton's law of cooling, the rate of change of temperature is proportional to the temperature difference:
dTdt∝(T−Tambient)
- The proportionality constant is inversely related to the heat capacity:
dTdt=−k⋅1m⋅c⋅(T−Tambient)
- Therefore, the cooling rate for each liquid can be expressed as:
dTAdt=−kA⋅(TA−Tambient)anddTBdt=−kB⋅(TB−Tambient)
- Where kA and kB are constants depending on the heat capacity.
5. Compare the Cooling Rates:
- Since mA⋅cA=1.6×10⁶V and mB⋅cB=4.0×10⁵V, we see that:
mA⋅cA>mB⋅cB
- This implies that the cooling rate for liquid A is slower than that for liquid B:
∣∣∣dTAdt∣∣∣<∣∣∣dTBdt∣∣∣
6. Conclusion on Temperature vs. Time Graph:
- Since liquid A cools more slowly than liquid B, the temperature vs. time graph will show that the temperature of liquid A decreases less steeply compared to liquid B.
- Thus, the graph for liquid A will be above that of liquid B for the same time interval.
Final Answer:
The best schematic representation of the temperature versus time graph is option B, where the slope for liquid A is less than that for liquid B.
- Beaker A:
- Density, ρA=8×10²kg/m3
- Specific heat, cA=2000J/(kg K)
- Beaker B:
- Density, ρB=103kg/m3
- Specific heat, cB=400J/(kg K)
- Both liquids start at T0=60∘C.
- Let the volume of each liquid be V.
- Mass of liquid in beaker A:
mA=ρA⋅V=(8×10²)⋅V=800Vkg
- Mass of liquid in beaker B:
mB=ρB⋅V=(103)⋅V=1000Vkg
- Heat capacity for liquid A:
mA⋅cA=(800V)⋅(2000)=1.6×10⁶VJ/K
- Heat capacity for liquid B:
mB⋅cB=(1000V)⋅(400)=4.0×10⁵VJ/K
- According to Newton's law of cooling, the rate of change of temperature is proportional to the temperature difference:
dTdt∝(T−Tambient)
- The proportionality constant is inversely related to the heat capacity:
dTdt=−k⋅1m⋅c⋅(T−Tambient)
- Therefore, the cooling rate for each liquid can be expressed as:
dTAdt=−kA⋅(TA−Tambient)anddTBdt=−kB⋅(TB−Tambient)
- Where kA and kB are constants depending on the heat capacity.
- Since mA⋅cA=1.6×10⁶V and mB⋅cB=4.0×10⁵V, we see that:
mA⋅cA>mB⋅cB
- This implies that the cooling rate for liquid A is slower than that for liquid B:
∣∣∣dTAdt∣∣∣<∣∣∣dTBdt∣∣∣
- Since liquid A cools more slowly than liquid B, the temperature vs. time graph will show that the temperature of liquid A decreases less steeply compared to liquid B.
- Thus, the graph for liquid A will be above that of liquid B for the same time interval.
The best schematic representation of the temperature versus time graph is option B, where the slope for liquid A is less than that for liquid B.
Topper's Solved these Questions
Similar Questions
A sample of 10gH2O is slowly heated from 27∘C→87∘C. Calculate the change in entropy during heating. (specific heat of water =4200Jkg−1K−1).
View SolutionFind the result of mixing 0.5 kg ice at 0∘C with 2 kg water at 30∘C. Given that latent heat of ice is L=3.36×10⁵J/kg and specific heat of water is 4200J/kg/K.
View SolutionCalculate the speed of longitudinal sound wave in a liquid. The bulk modulus for the liquid is 20×109N/m2 and its density is 9.5×10³kg/m3.
View SolutionCalculate the difference in temperature between the water at the top and bottom of a water fall 200 m high. Specific heat capacity of water 42000Jkg−1K−1.
View SolutionCalculate the increase in the internal energy of 10 g of water when it is heated from 00C→1000C and converted into steam at 100 kPa. The density of steam =0.6kgm−3 specific heat capacity of water =4200Jkg−10C−3 latent heat of vaporization of water =2.25×10⁶Jkg−1
View SolutionGold has a specific heat of 130Jkg⋅∘C and wood has a specific heat of 1,800Jkg⋅∘C. If a piece of gold and a piece of wood, each of mass 0.1 kg, both absorbs 2.340 J of heat, by how much will their temperatures rise?
View SolutionA cubical tank of side 1 m is filled with 800 kg of a liquid. Find the density of liquid in kg m−3
View SolutionA sample of 100 g water is slowly heated from 27oC to 87oC. Calculate the change in the entropy of the water. specific heat capacity of water =4200 j/kg k .
View SolutionA liquid of mass m and specific heat c is heated to a temperature 2T. Another liquid of mass m/2 and specific heat 2 c is heated to a temperature T. If these two liquids are mixed, the resulting temperature of the mixture is
View SolutionWrite the expression for the heat energy Q received by m kg of a substance of specific heat capacity c J kg−1K−1when it is heated through Δt∘C.
View Solution
