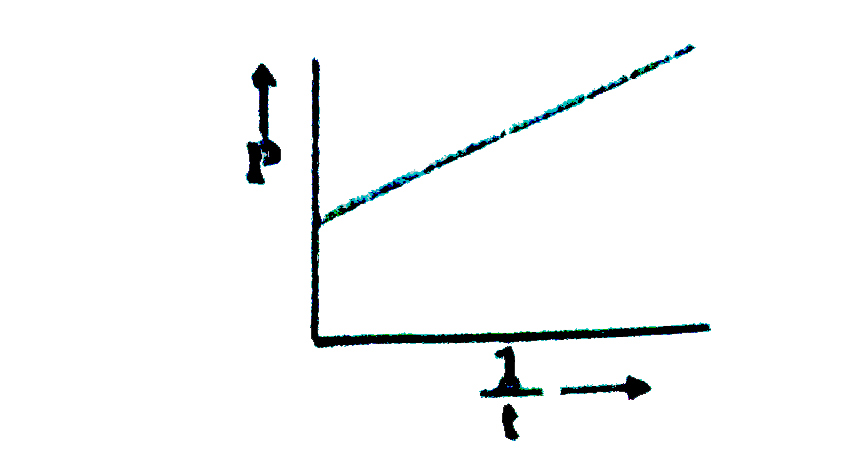
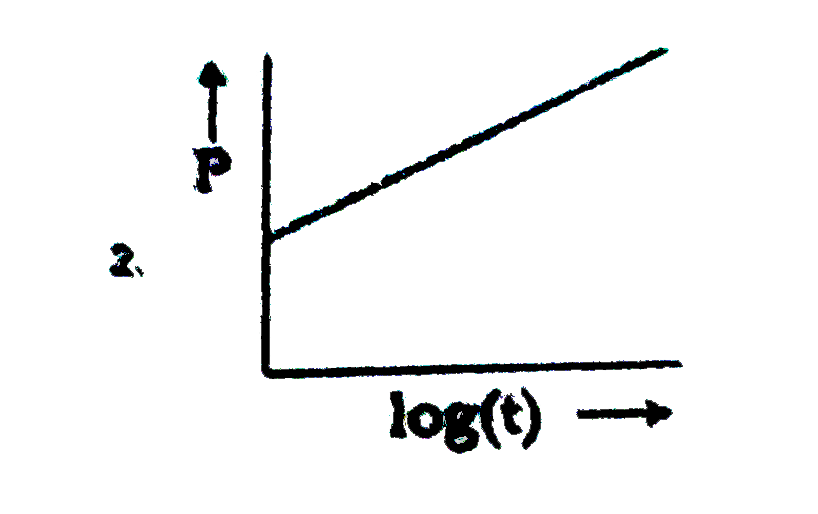
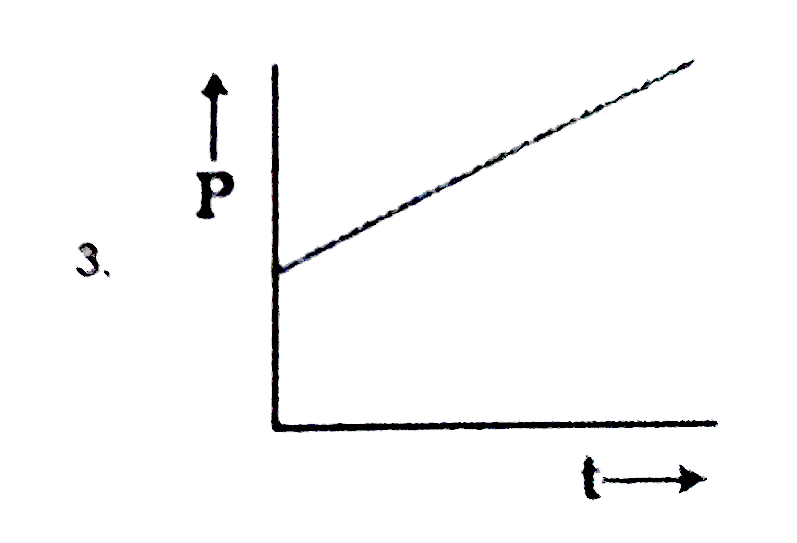
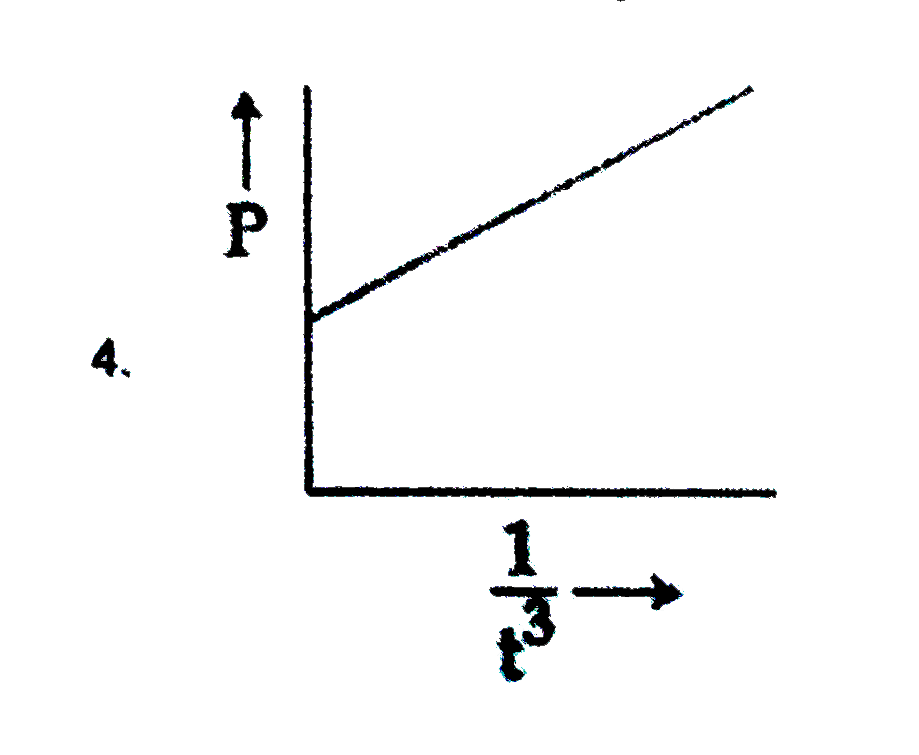
A soap bubble is blown with the help of mechanical pump at the mouth of a tube. The pump produces a cartain increase per minute in the volume of the bubble, irrespective of its internal pressure. The graph between the pressure inside the soap bubble and time t will be
The correct Answer is:A
To solve the problem, we need to analyze the relationship between the pressure inside a soap bubble and time as the bubble is inflated by a mechanical pump. Here’s a step-by-step solution:
Step 1: Understand the Pressure Inside the Soap Bubble
The pressure inside a soap bubble can be expressed using the formula:
P=P0+4TR
where:
- P is the pressure inside the bubble,
- P0 is the atmospheric pressure,
- T is the surface tension of the soap solution,
- R is the radius of the bubble.
Step 2: Relate Volume and Time
The volume V of a soap bubble is given by the formula:
V=43πR3
According to the problem, the volume of the bubble increases at a constant rate per minute, which means:
V∝t
Thus, we can write:
V=k⋅t
for some constant k.
Step 3: Express Radius in Terms of Time
From the volume equation, we can express the radius R in terms of time t:
43πR3=k⋅t
This implies:
R3=3k4πt
Taking the cube root:
R=(3k4π)1/3t1/3
Let’s denote the constant (3k4π)1/3 as C:
R=C⋅t1/3
Step 4: Substitute Radius Back into the Pressure Equation
Now, we substitute R back into the pressure equation:
P=P0+4TC⋅t1/3
This can be rewritten as:
P=P0+4TCt−1/3
Step 5: Analyze the Relationship
From the equation P=P0+4TCt−1/3, we can see that as time t increases, the term t−1/3 decreases. Therefore, the pressure P will approach P0 as t increases.
Step 6: Graphical Representation
The graph of P versus t will start from P0 and will decrease as t increases. The relationship is inversely proportional to t1/3, which means the graph will have a decreasing curve.
Conclusion
The correct graph between the pressure inside the soap bubble and time t will show a decreasing trend starting from P0 and approaching P0 as time increases.
The pressure inside a soap bubble can be expressed using the formula:
P=P0+4TR
where:
- P is the pressure inside the bubble,
- P0 is the atmospheric pressure,
- T is the surface tension of the soap solution,
- R is the radius of the bubble.
The volume V of a soap bubble is given by the formula:
V=43πR3
According to the problem, the volume of the bubble increases at a constant rate per minute, which means:
V∝t
Thus, we can write:
V=k⋅t
for some constant k.
From the volume equation, we can express the radius R in terms of time t:
43πR3=k⋅t
This implies:
R3=3k4πt
Taking the cube root:
R=(3k4π)1/3t1/3
Let’s denote the constant (3k4π)1/3 as C:
R=C⋅t1/3
Now, we substitute R back into the pressure equation:
P=P0+4TC⋅t1/3
This can be rewritten as:
P=P0+4TCt−1/3
From the equation P=P0+4TCt−1/3, we can see that as time t increases, the term t−1/3 decreases. Therefore, the pressure P will approach P0 as t increases.
The graph of P versus t will start from P0 and will decrease as t increases. The relationship is inversely proportional to t1/3, which means the graph will have a decreasing curve.
The correct graph between the pressure inside the soap bubble and time t will show a decreasing trend starting from P0 and approaching P0 as time increases.
Similar Questions
Knowledge Check
The soap bubble formed at the end of the tube is blown very slowly. Draw the graph between excess of pressure inside the bubble with time.
A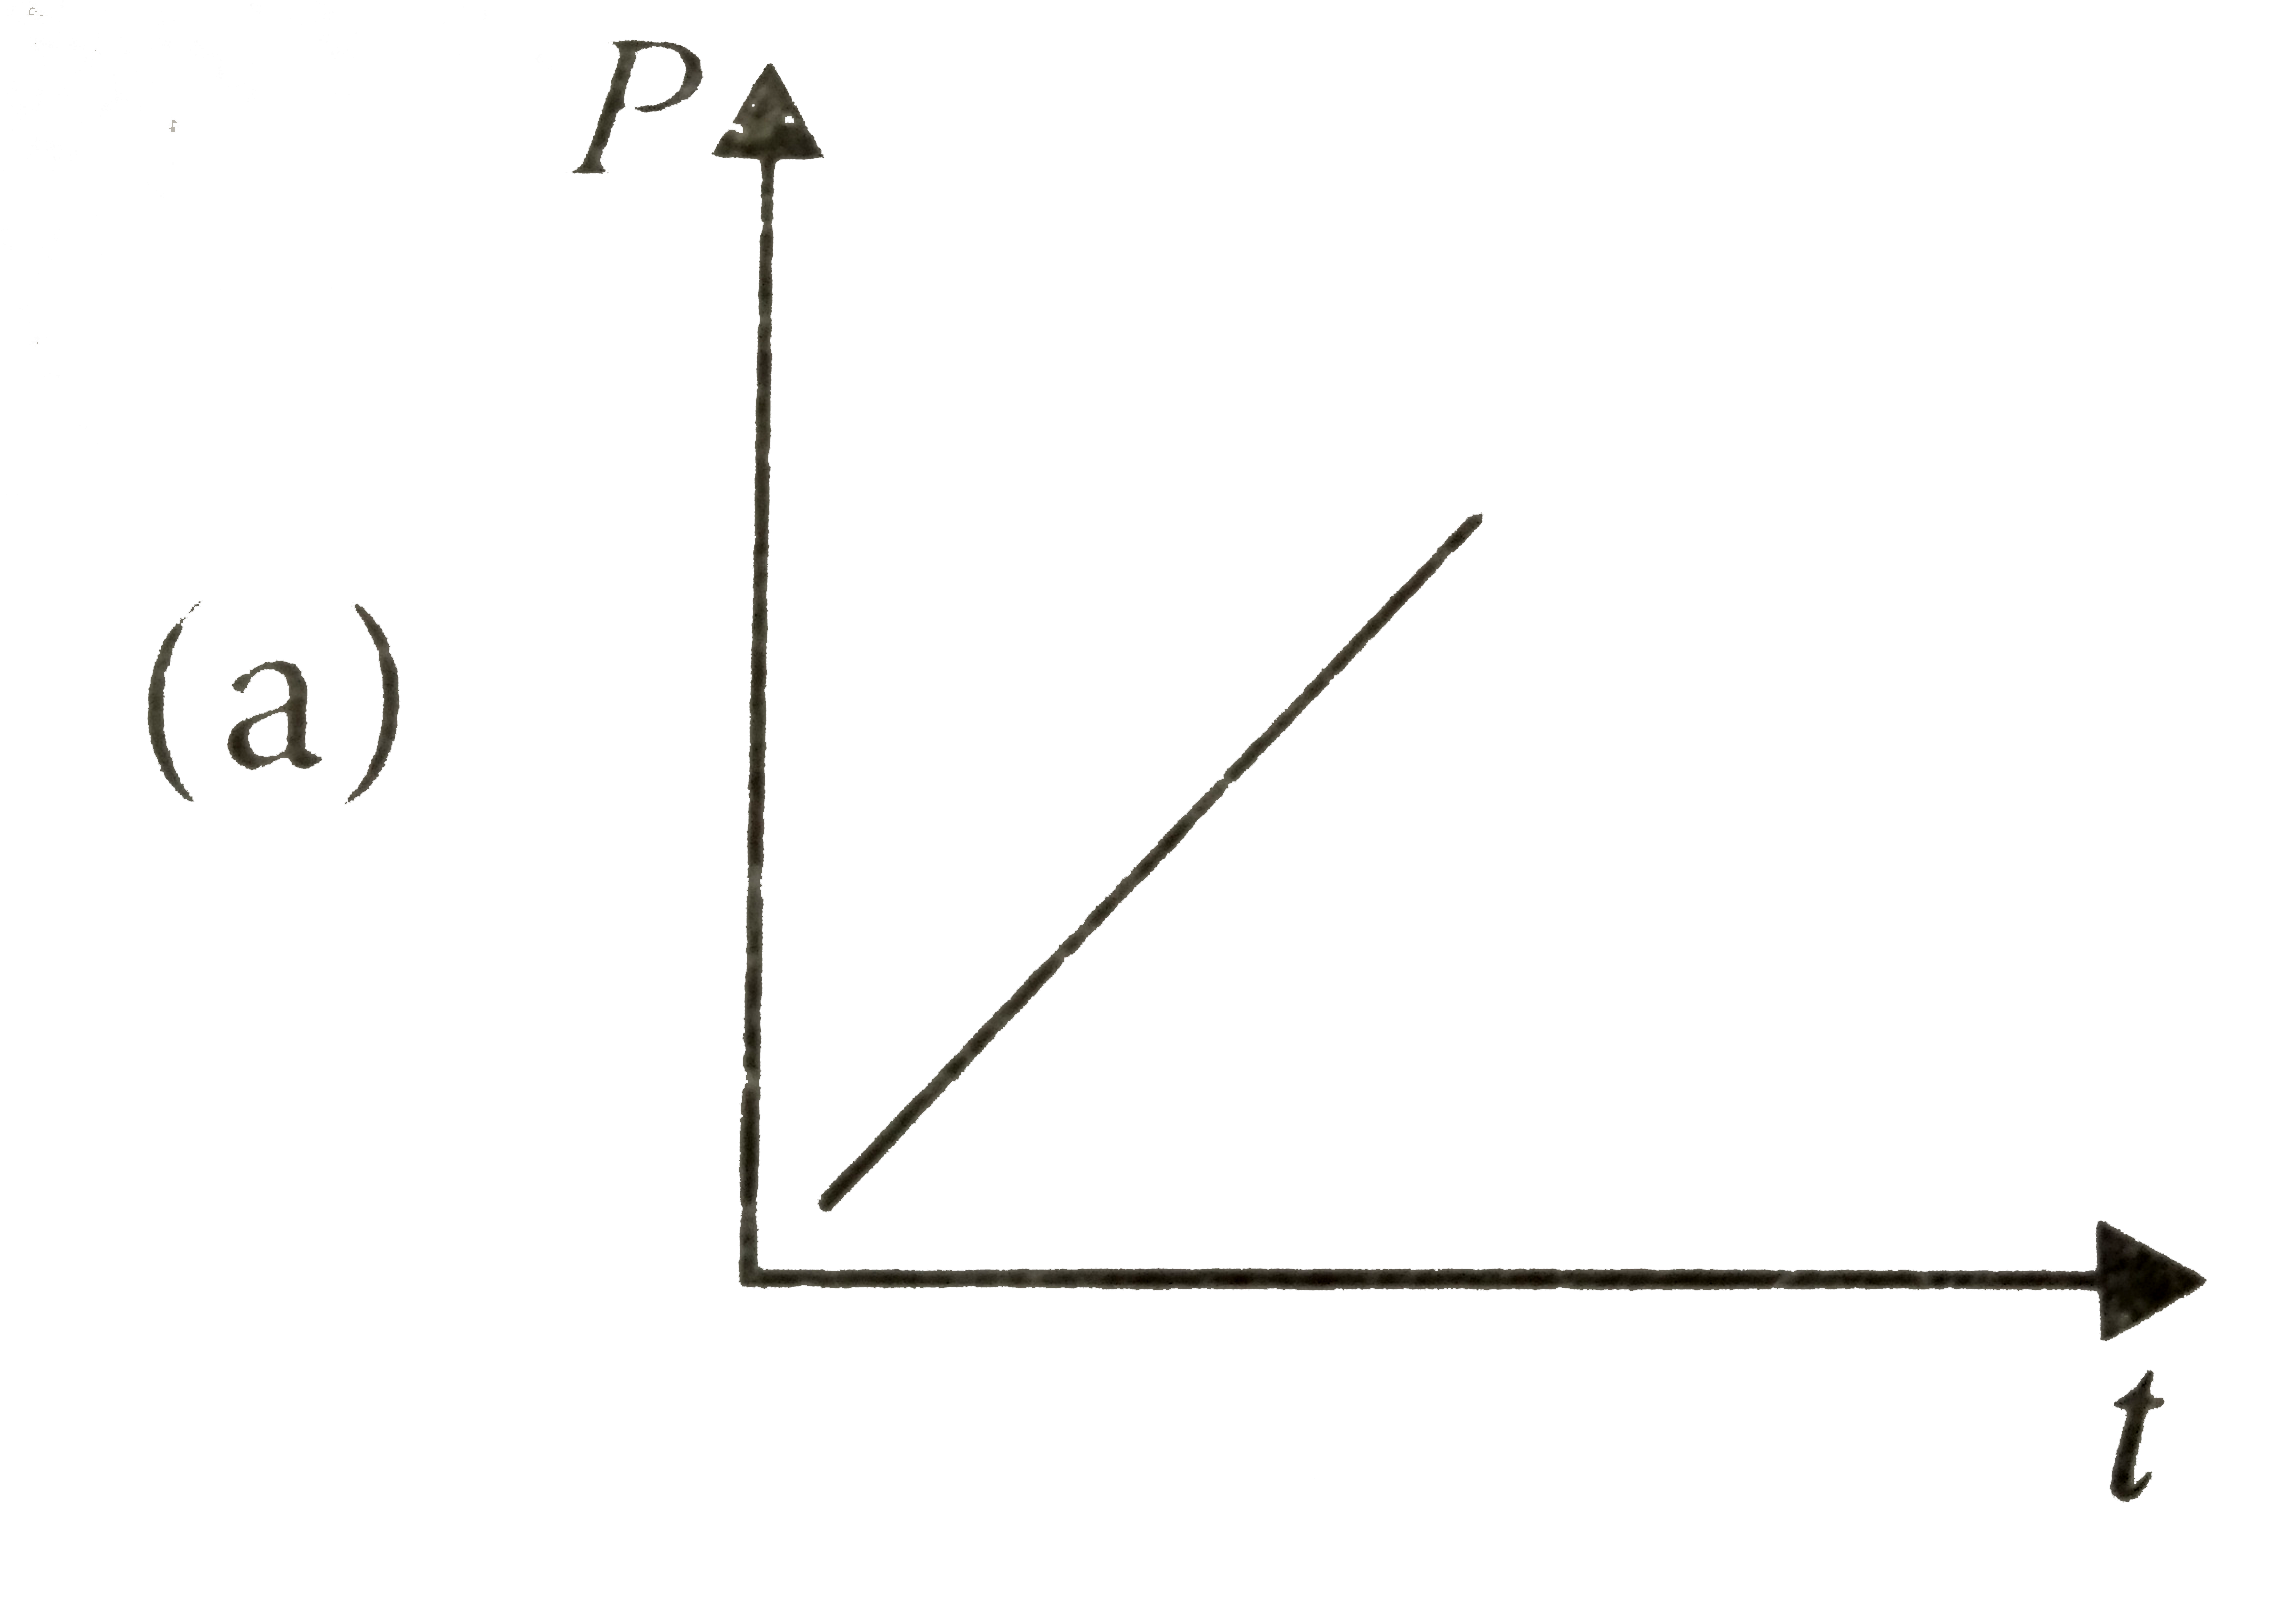 B
B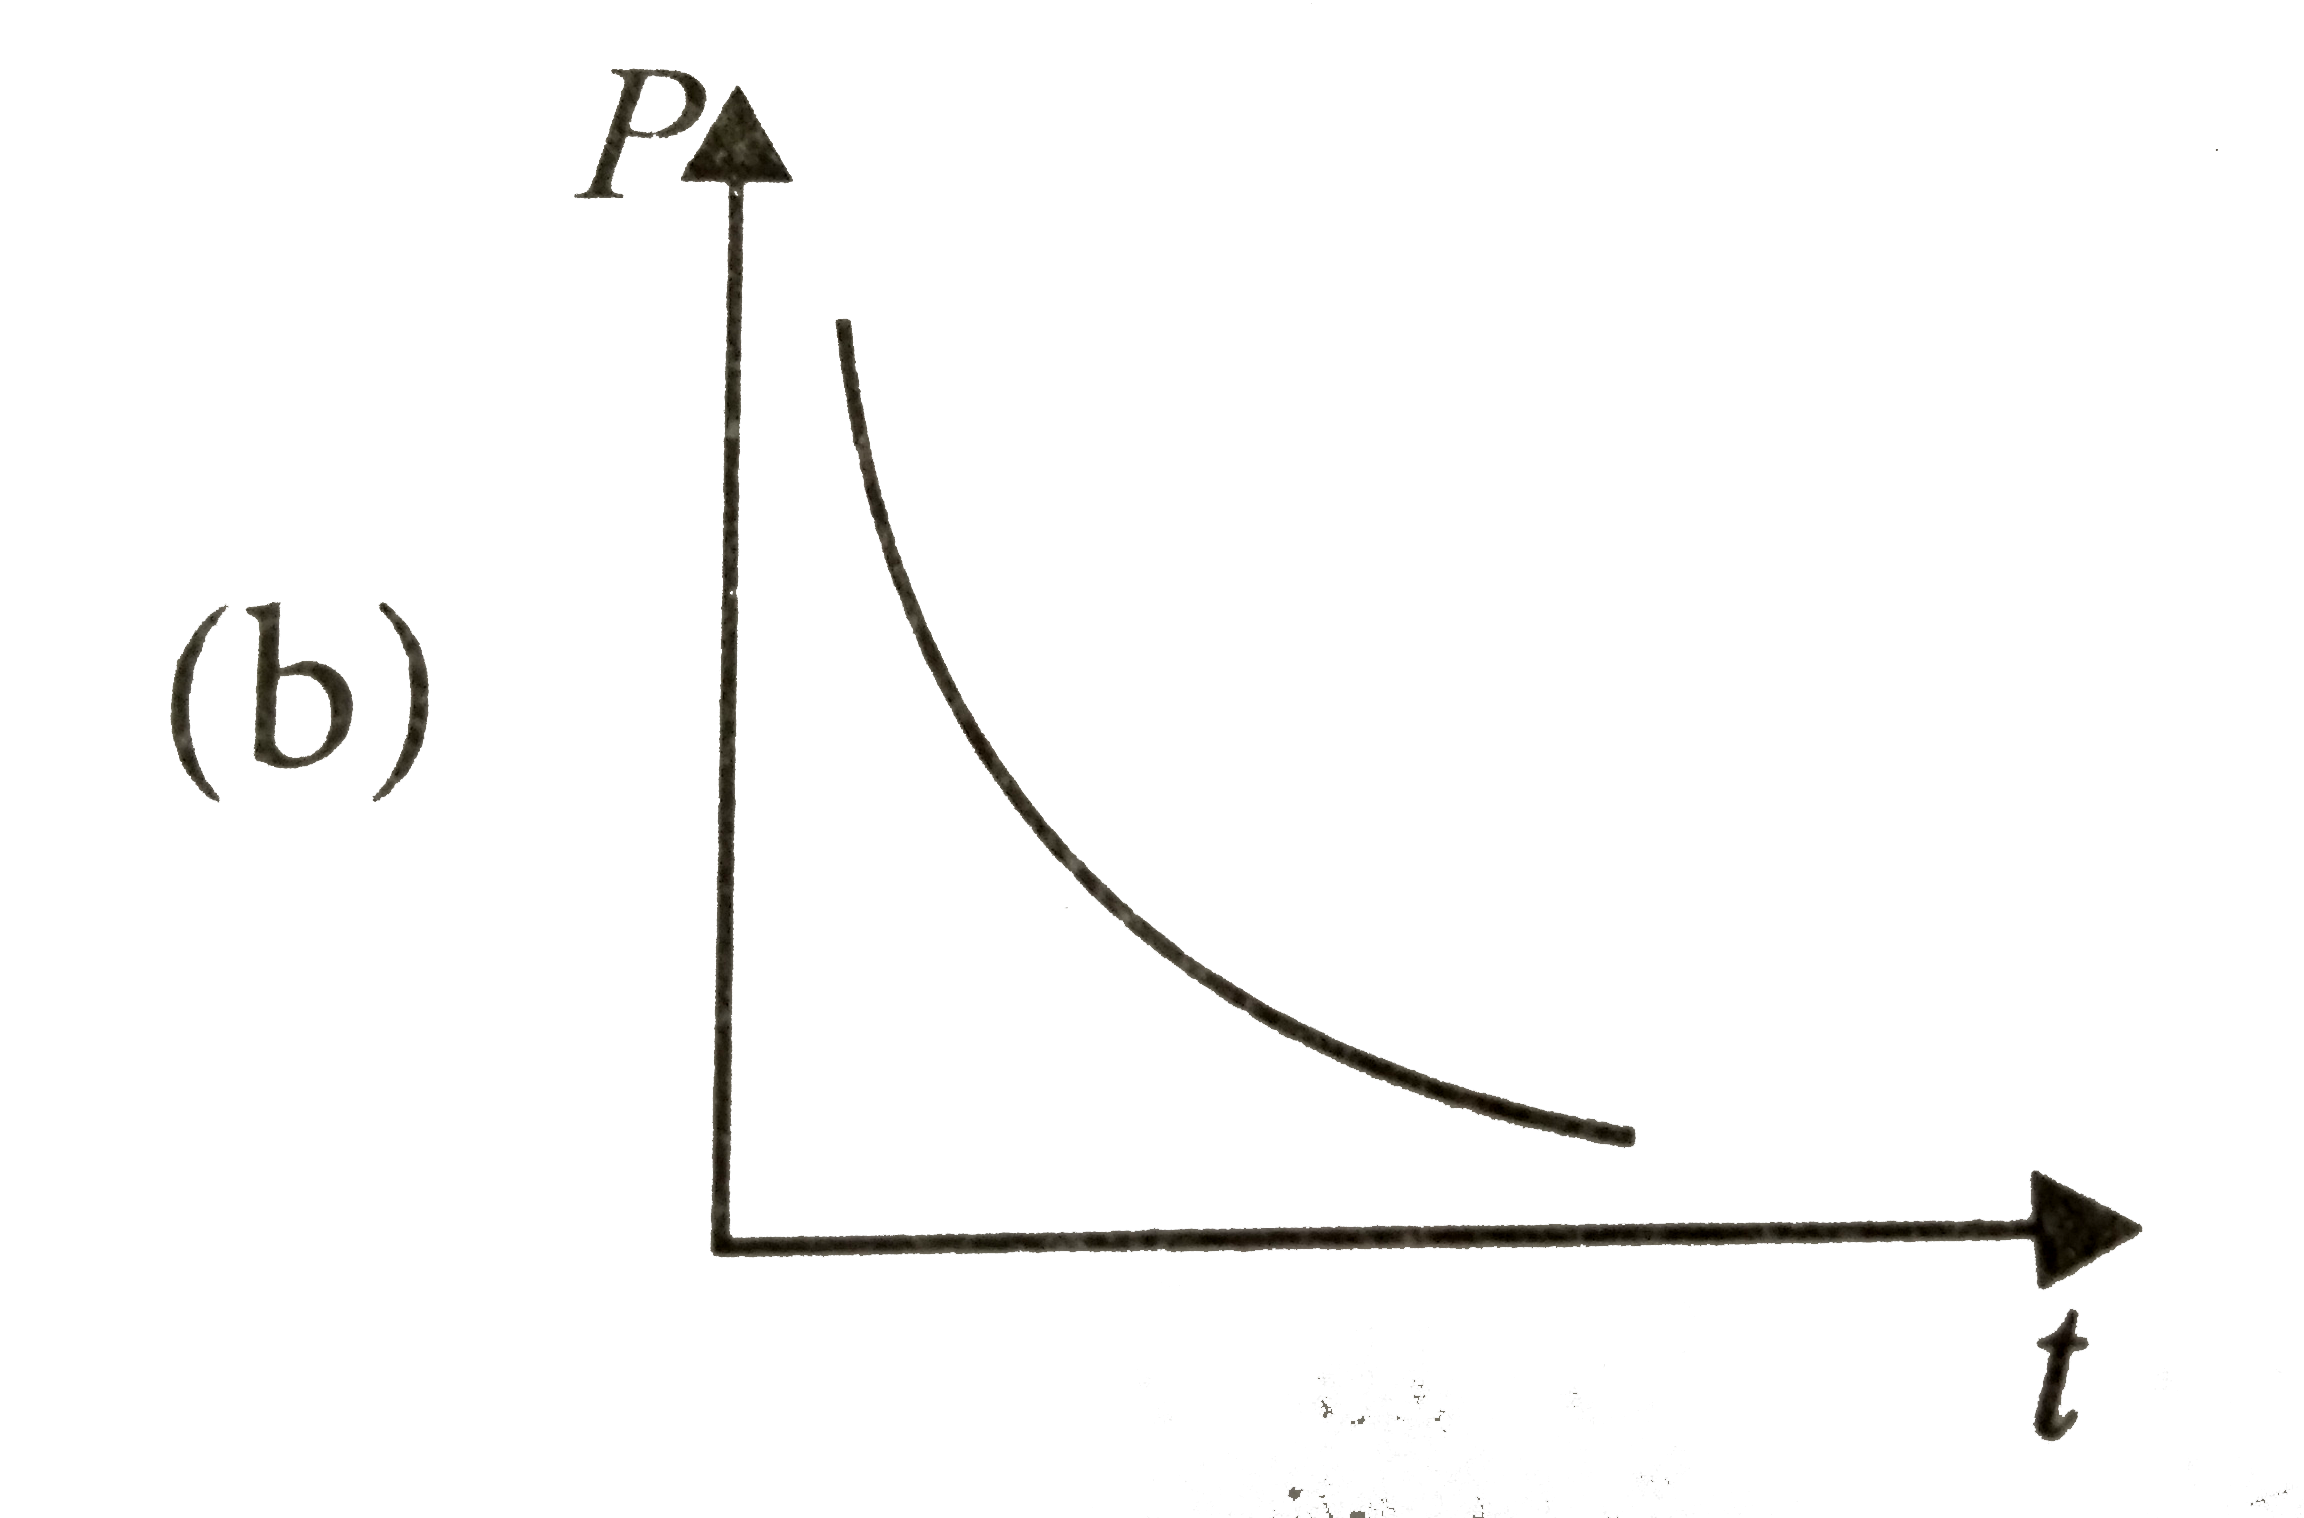 C
C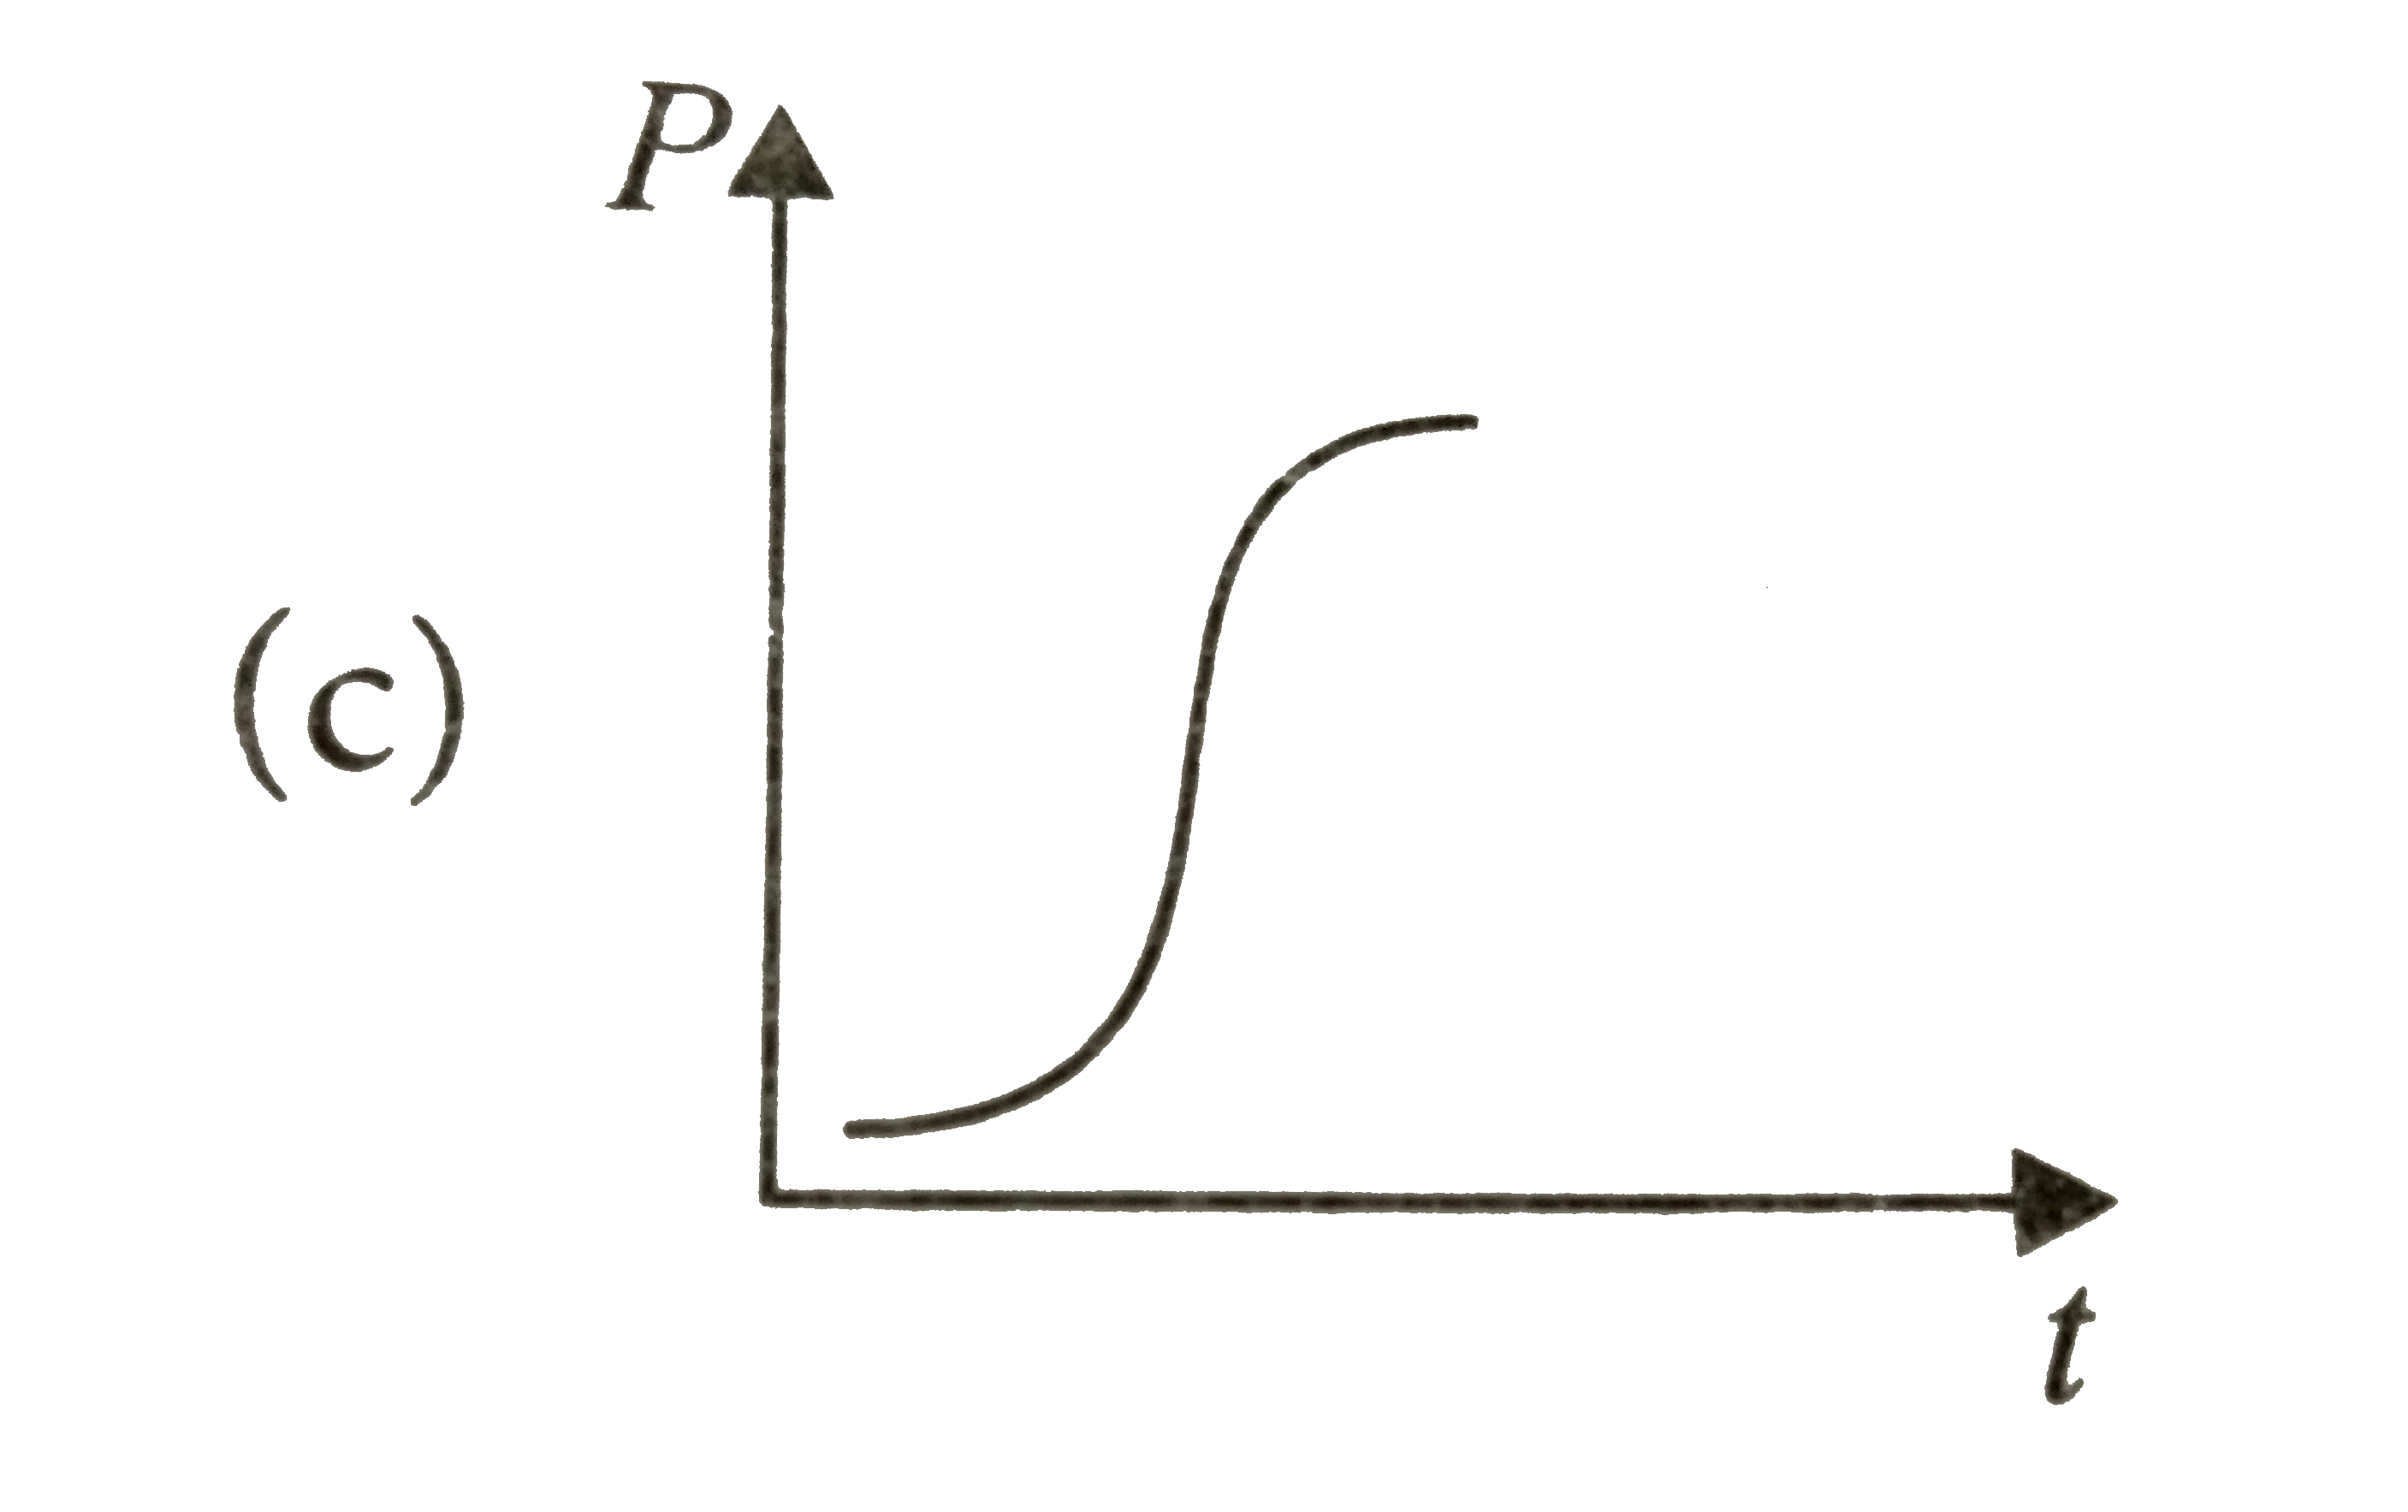 D
D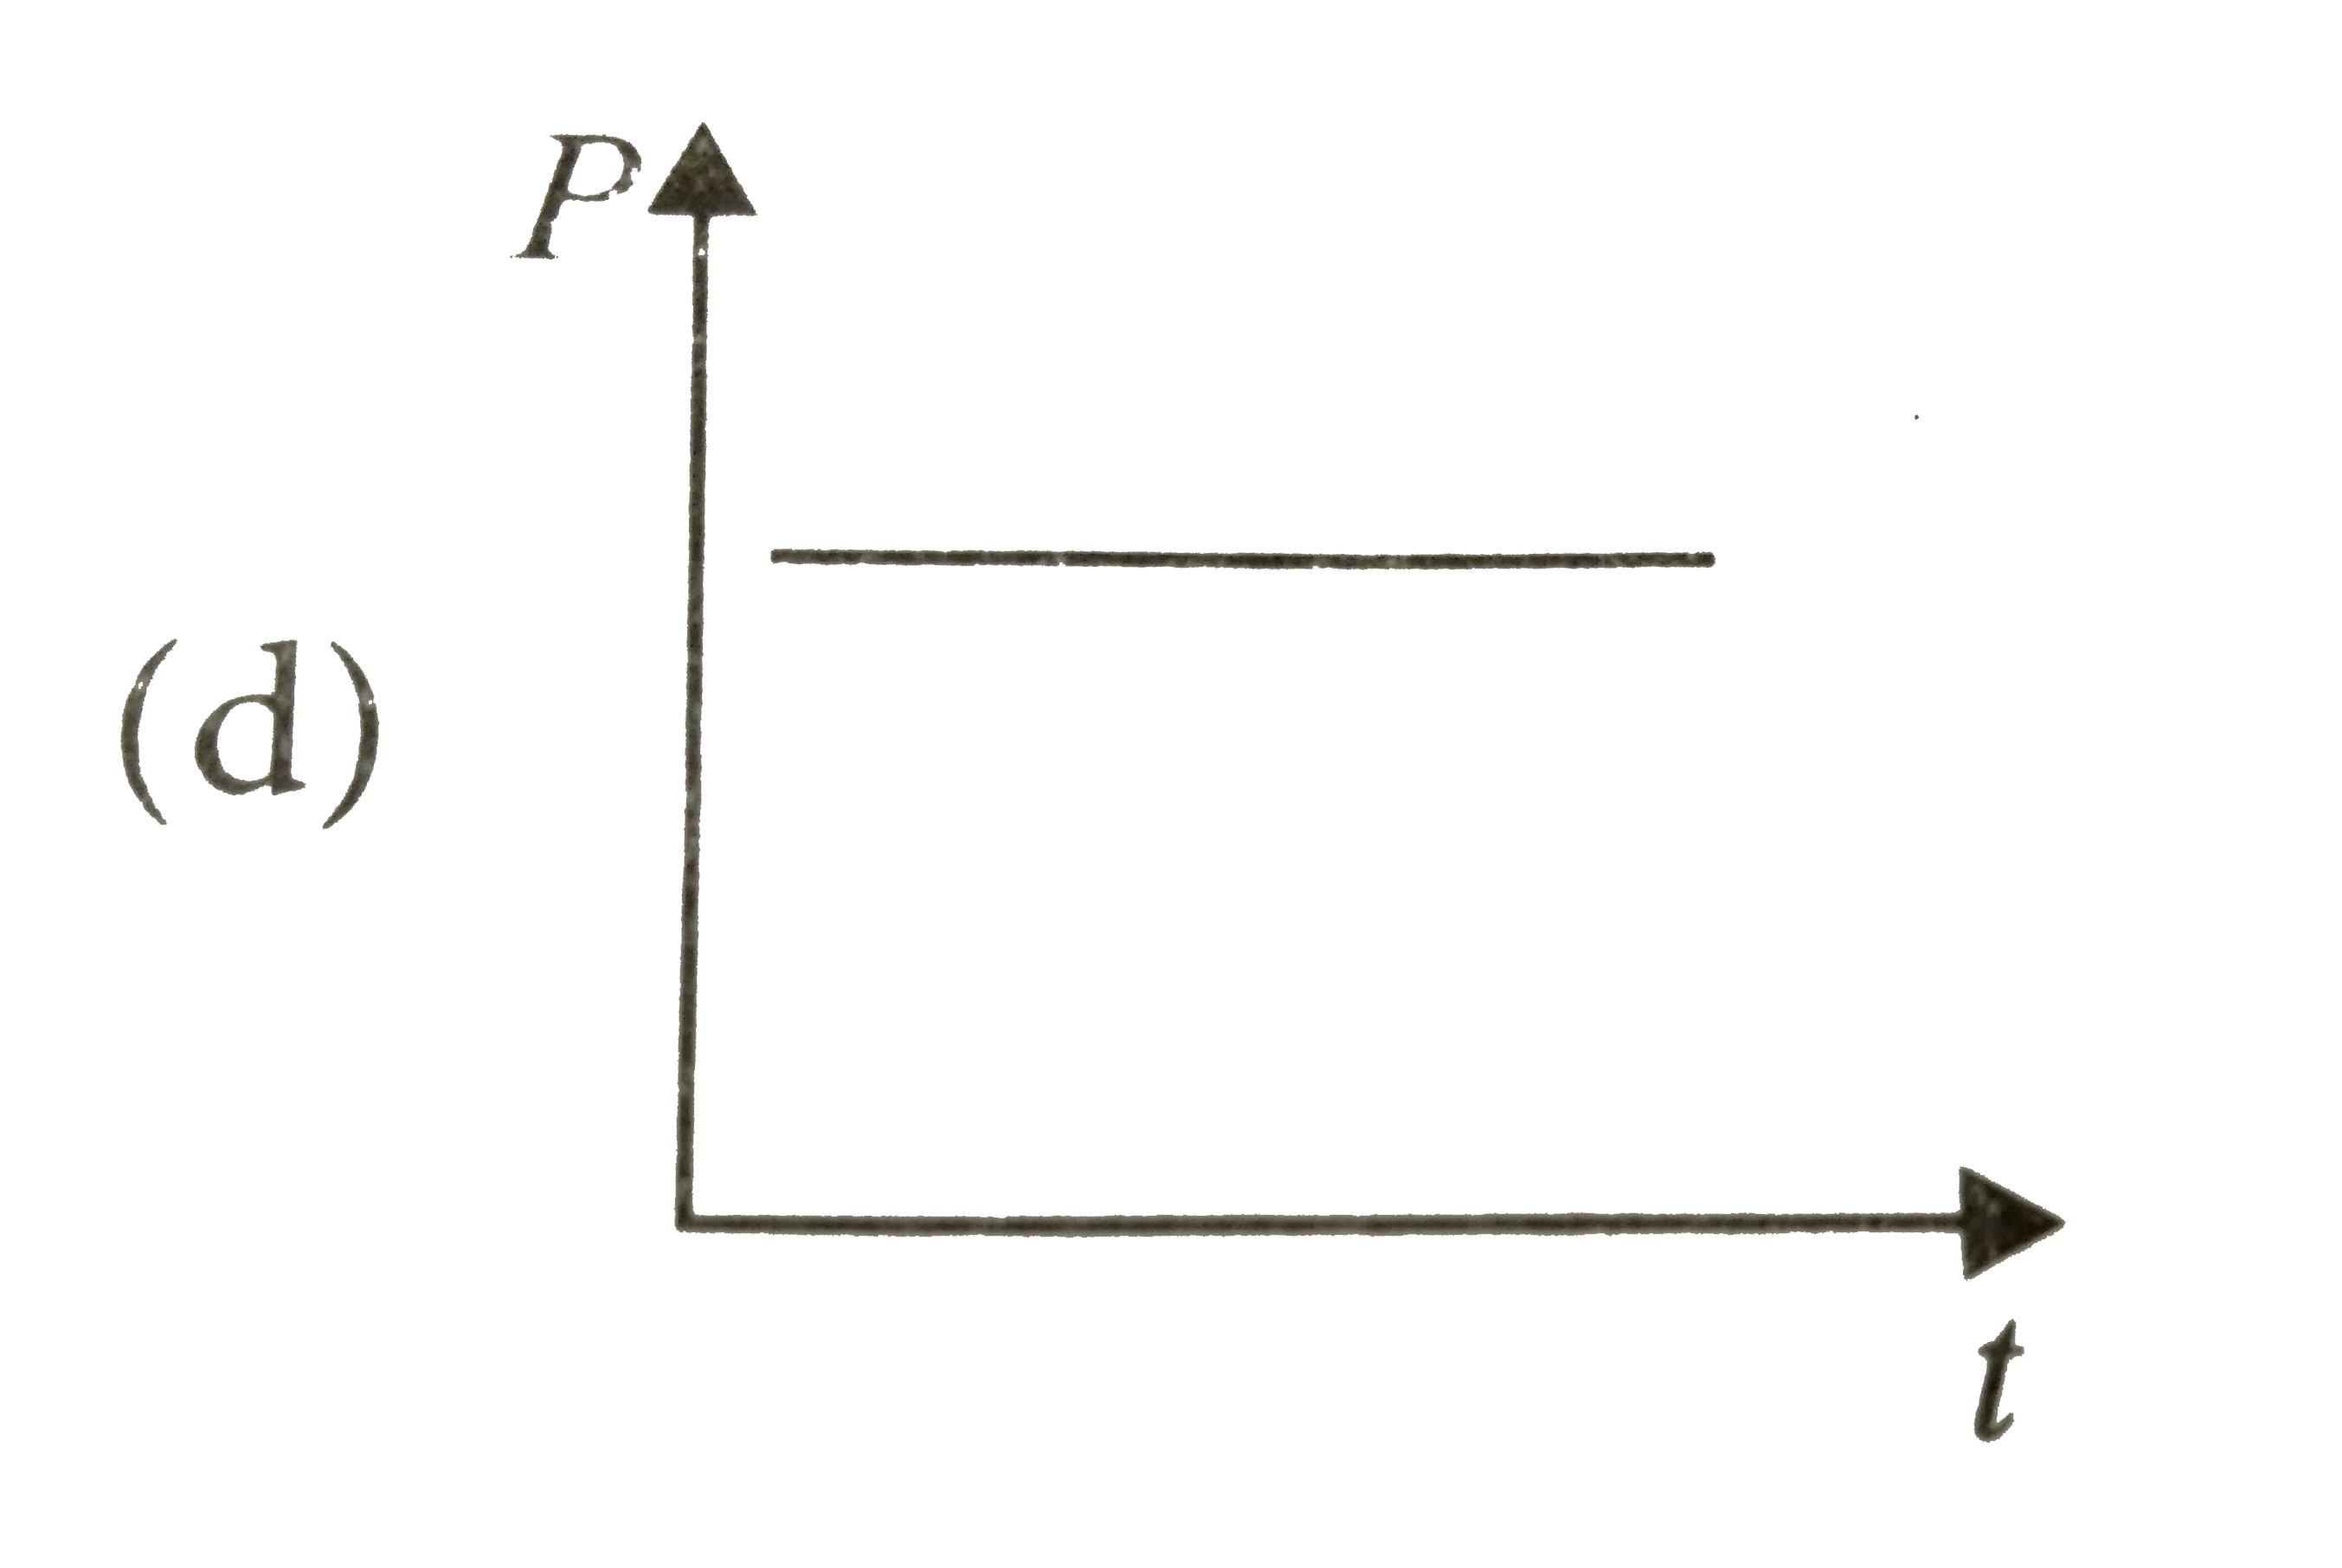
Describe an experiment to demonstrate the excess pressure inside a soap bubble.
View SolutionThe excess pressure inside a soap bubble of radius R is (S is the surface tension)
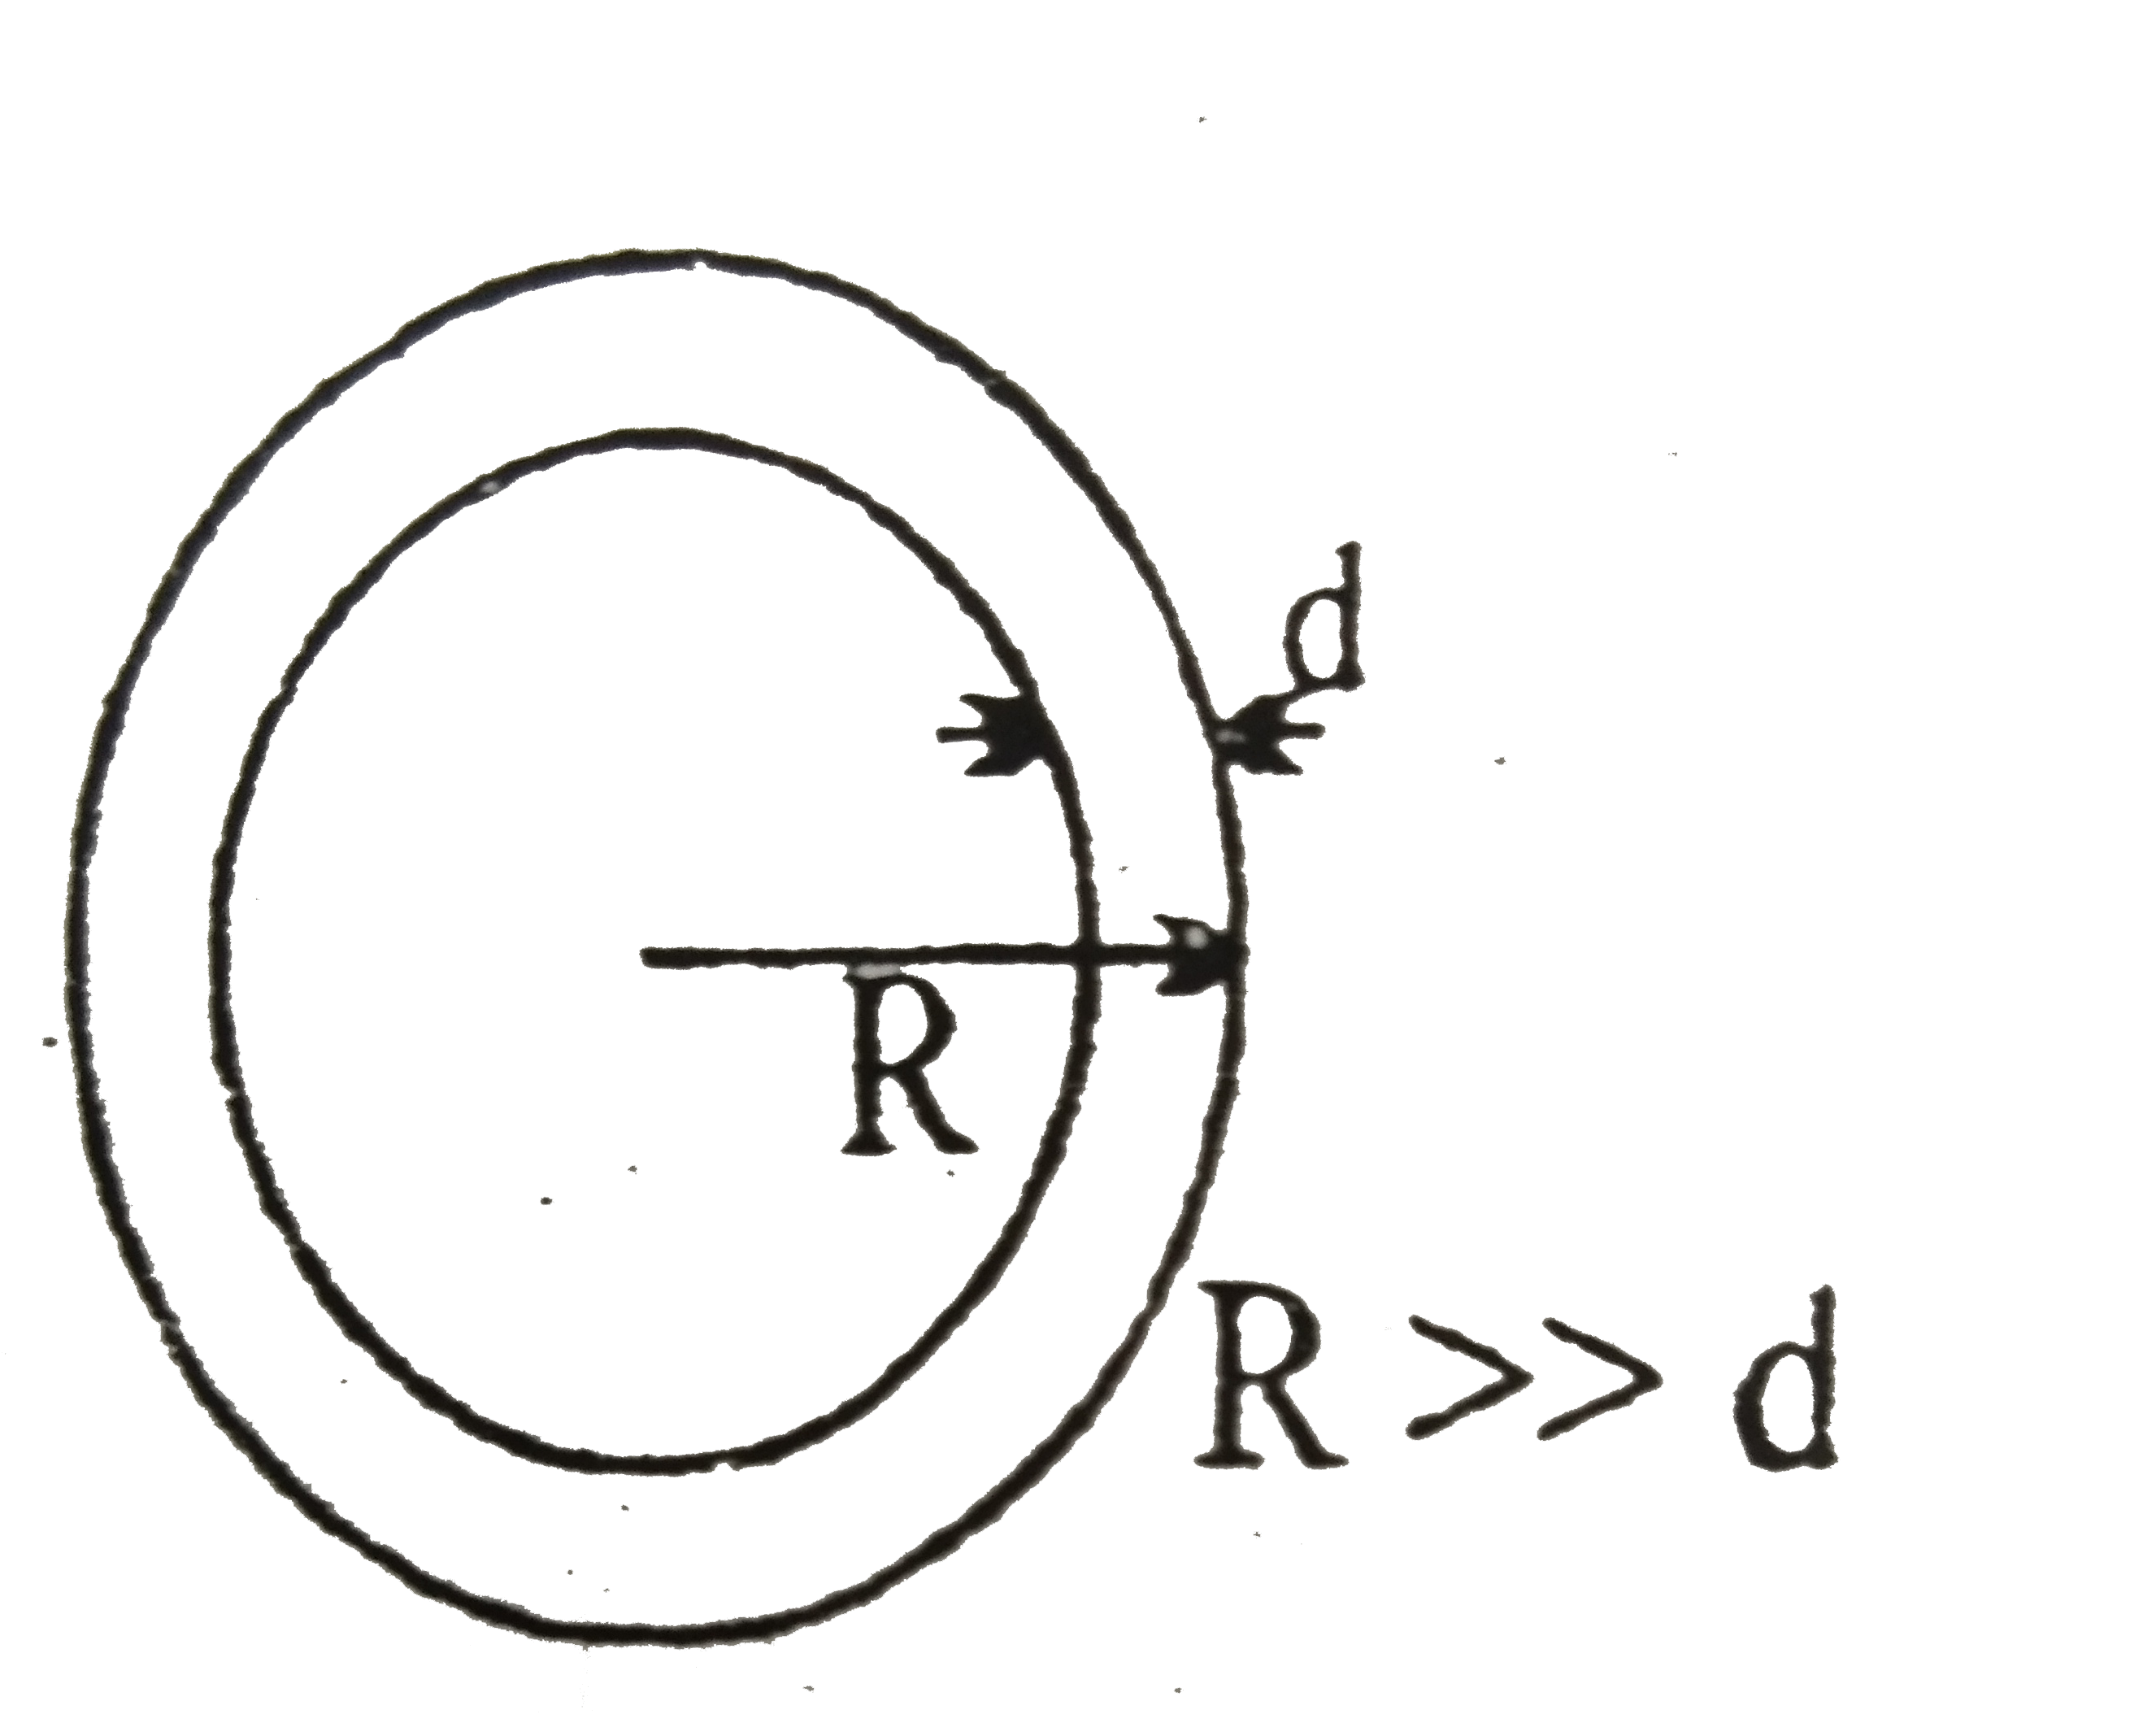
View SolutionA soap bubble has radius R and thickness d(<<R) as shown. It colapses into a spherical drop. The ratio of excess pressure in the drop to the excess pressure inside the bubble is
View Solutionhe surface tension of water is 0.072m−1 The excess pressure inside a water drop, of diameter 1.2 mm,is
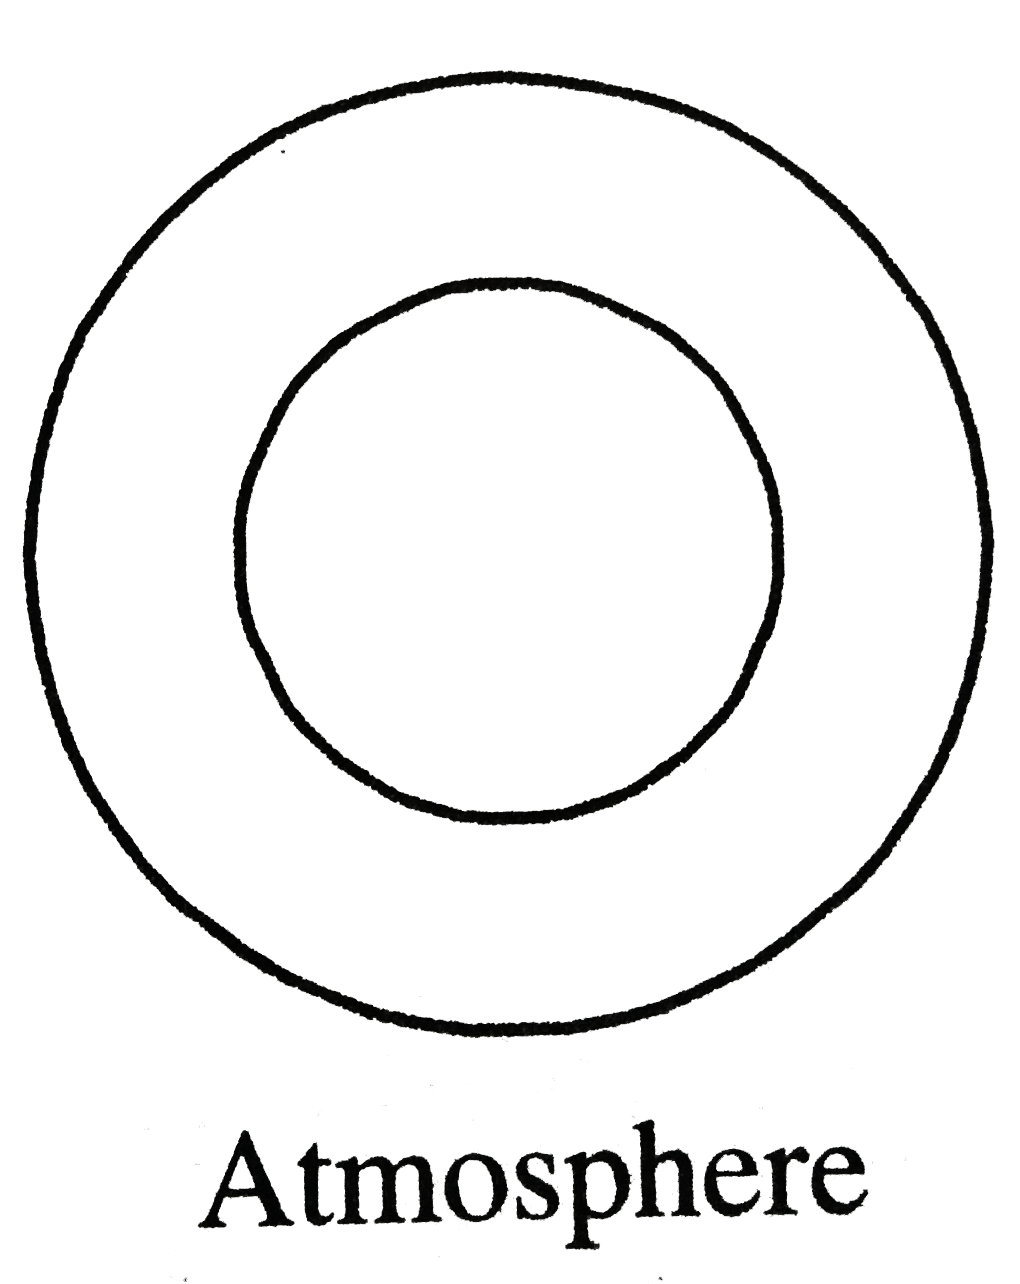
View SolutionA soap bubble of raidus R is surrounded by another soap bubble of radius 2R, as shown. Take surface tension =S. Then the pressure inside the smaller soap bubble, in excess of the atmosphere presure will be
View SolutionIf R is the radius of a soap bubble and S its surface tension, then the excess pressure inside is
View SolutionDeduce expressions for the excess pressure inside a :
(i) liquid drop, (ii) soap bubble.
View Solution
