Velocity -time graph for a body of mass 10 kg is shown in figure. Work -done on the body in first two seconds of the motion is :
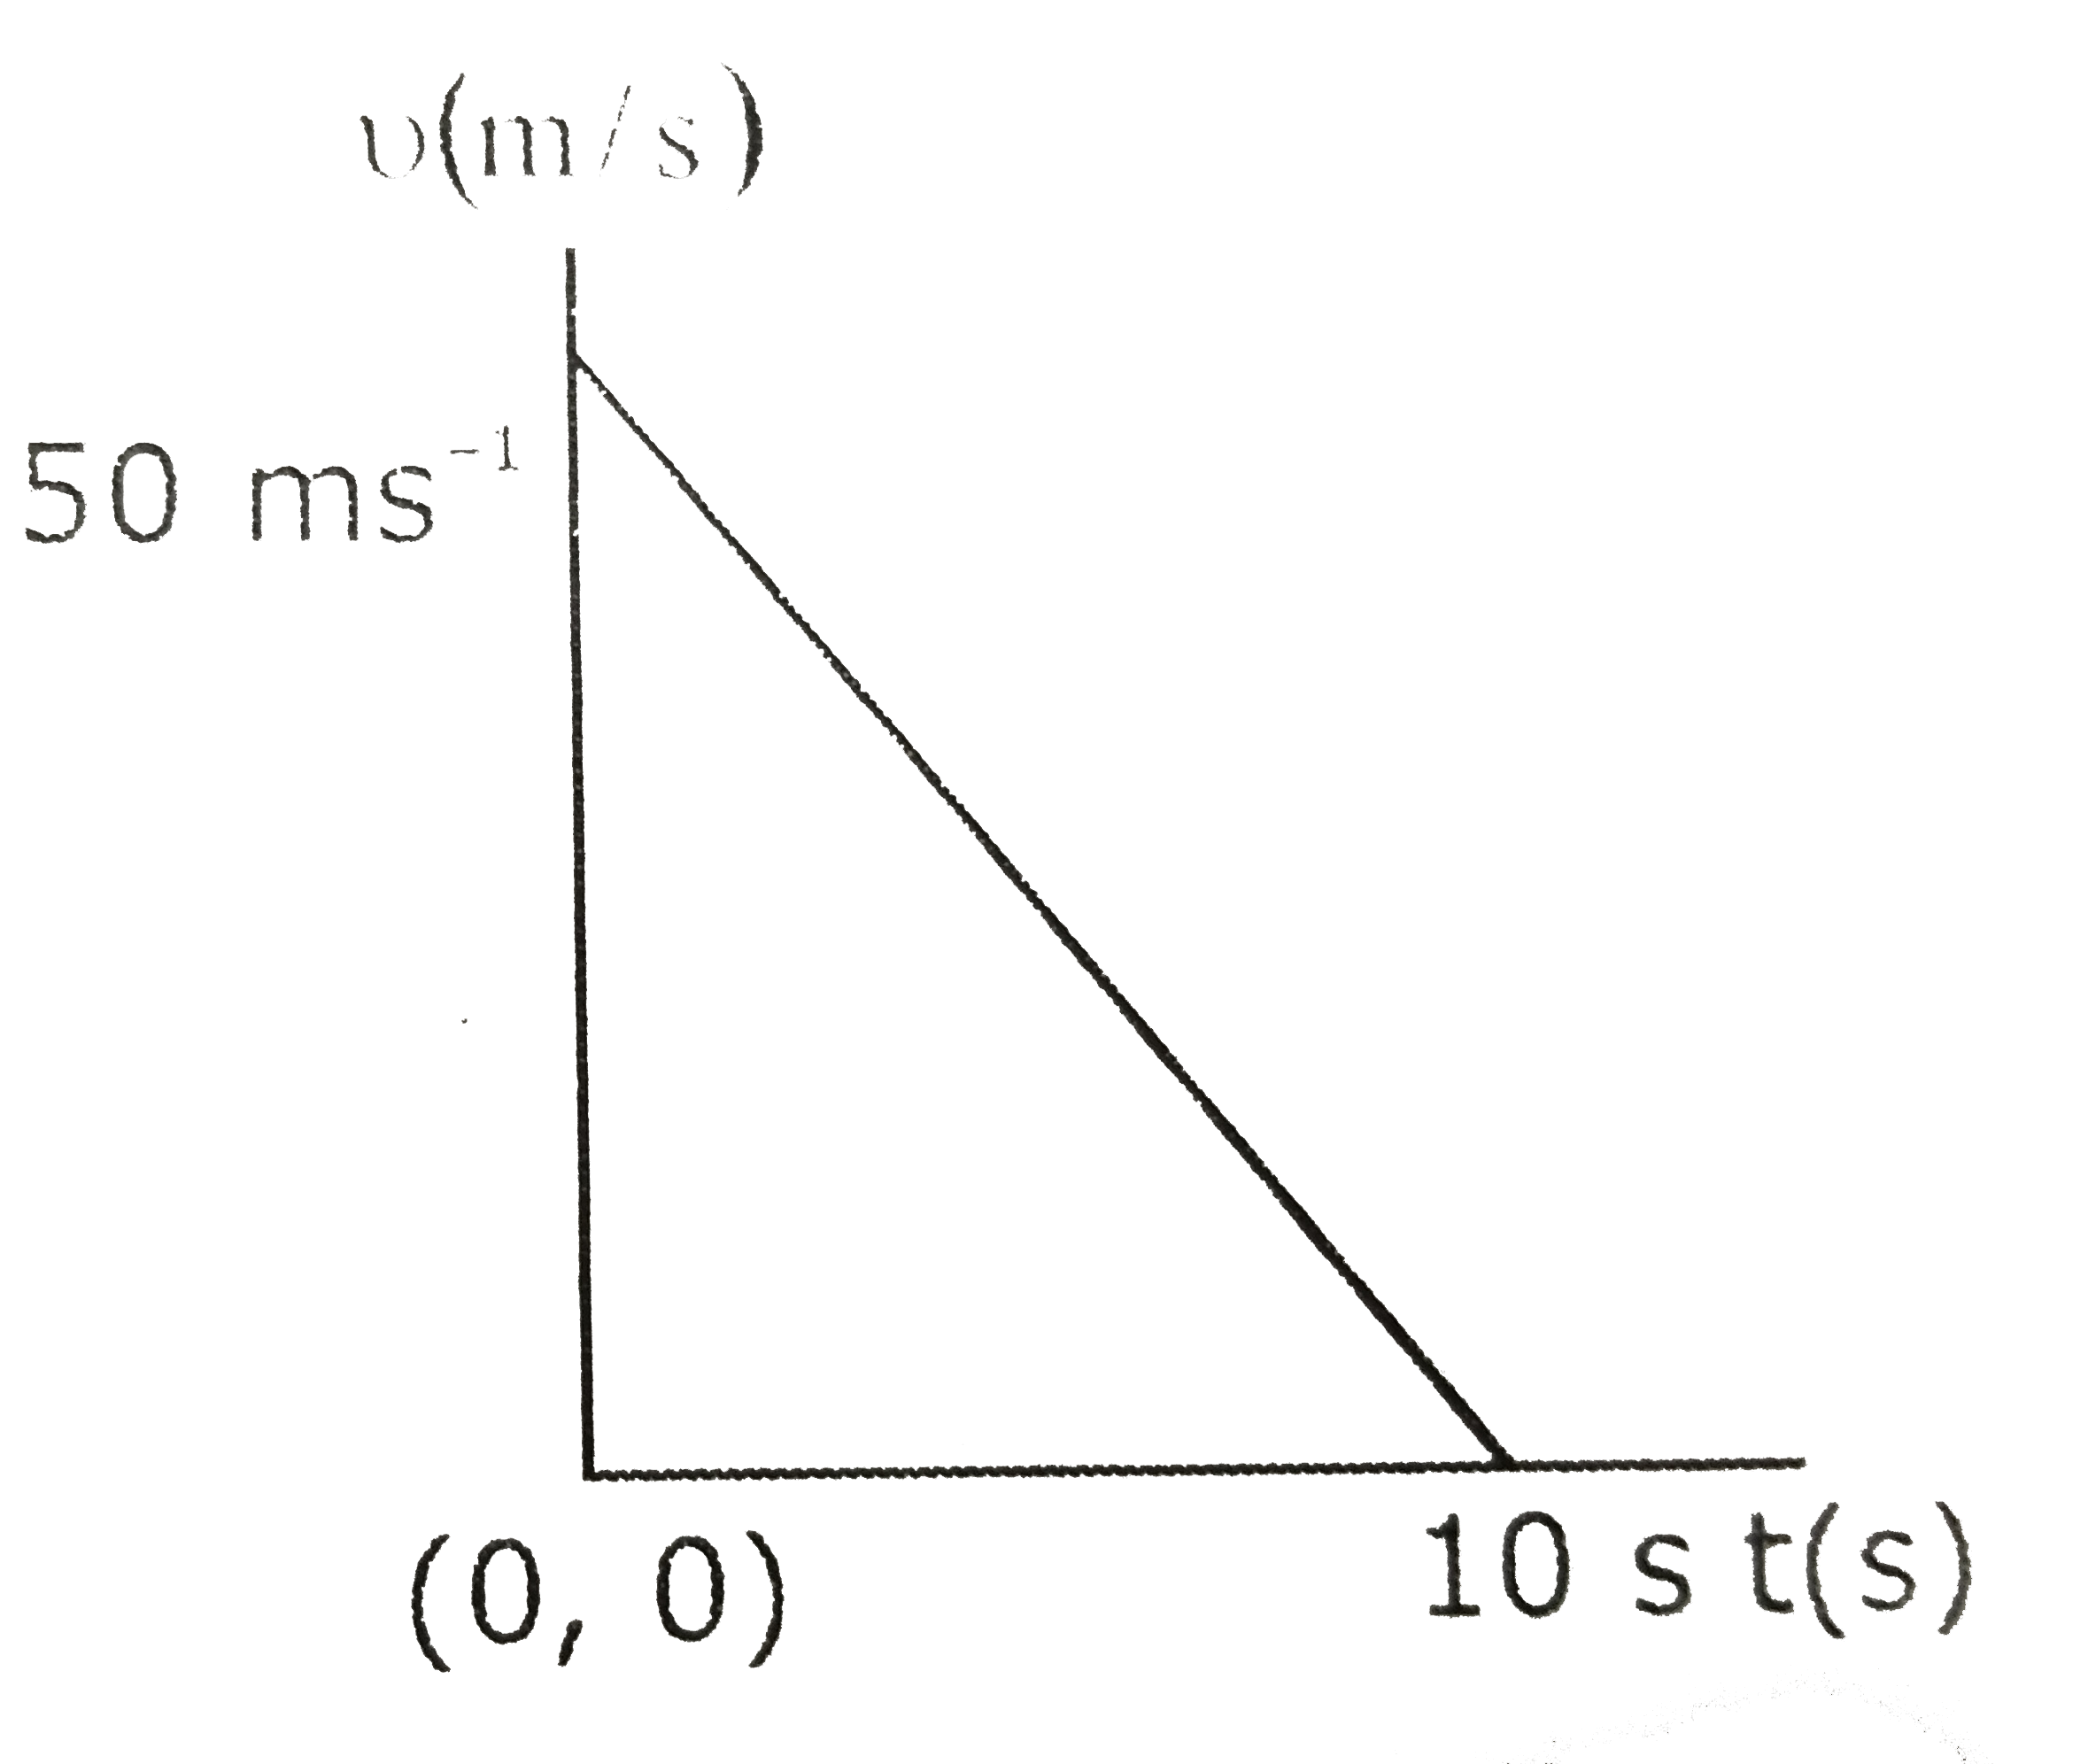
−4500J
12000J
−9300J
−12000J
Step by step video & image solution for Velocity -time graph for a body of mass 10 kg is shown in figure. Work -done on the body in first two seconds of the motion is : by Physics experts to help you in doubts & scoring excellent marks in Class 12 exams.
Updated on:21/07/2023Topper's Solved these Questions
Similar Questions
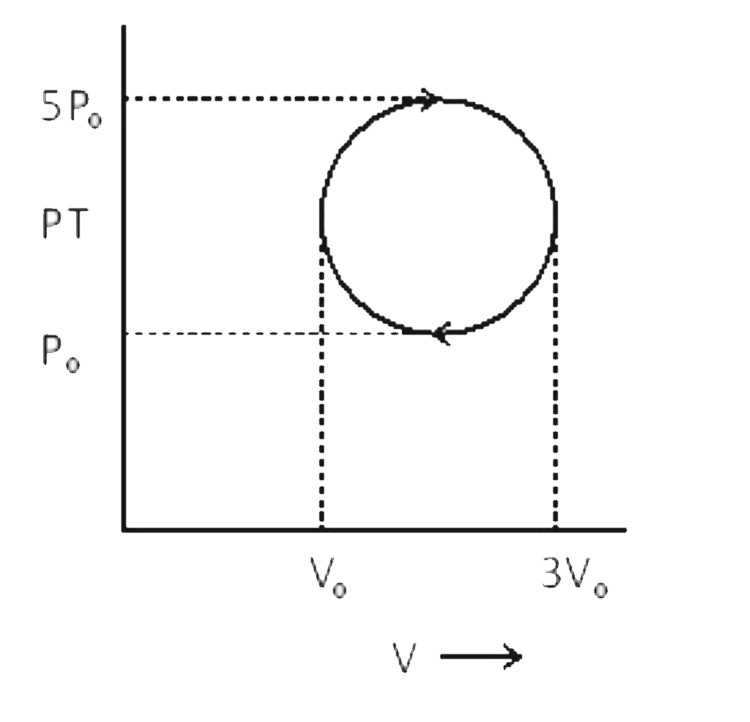
P – V graph for a cyclic process is shown in figure . Work done is given by
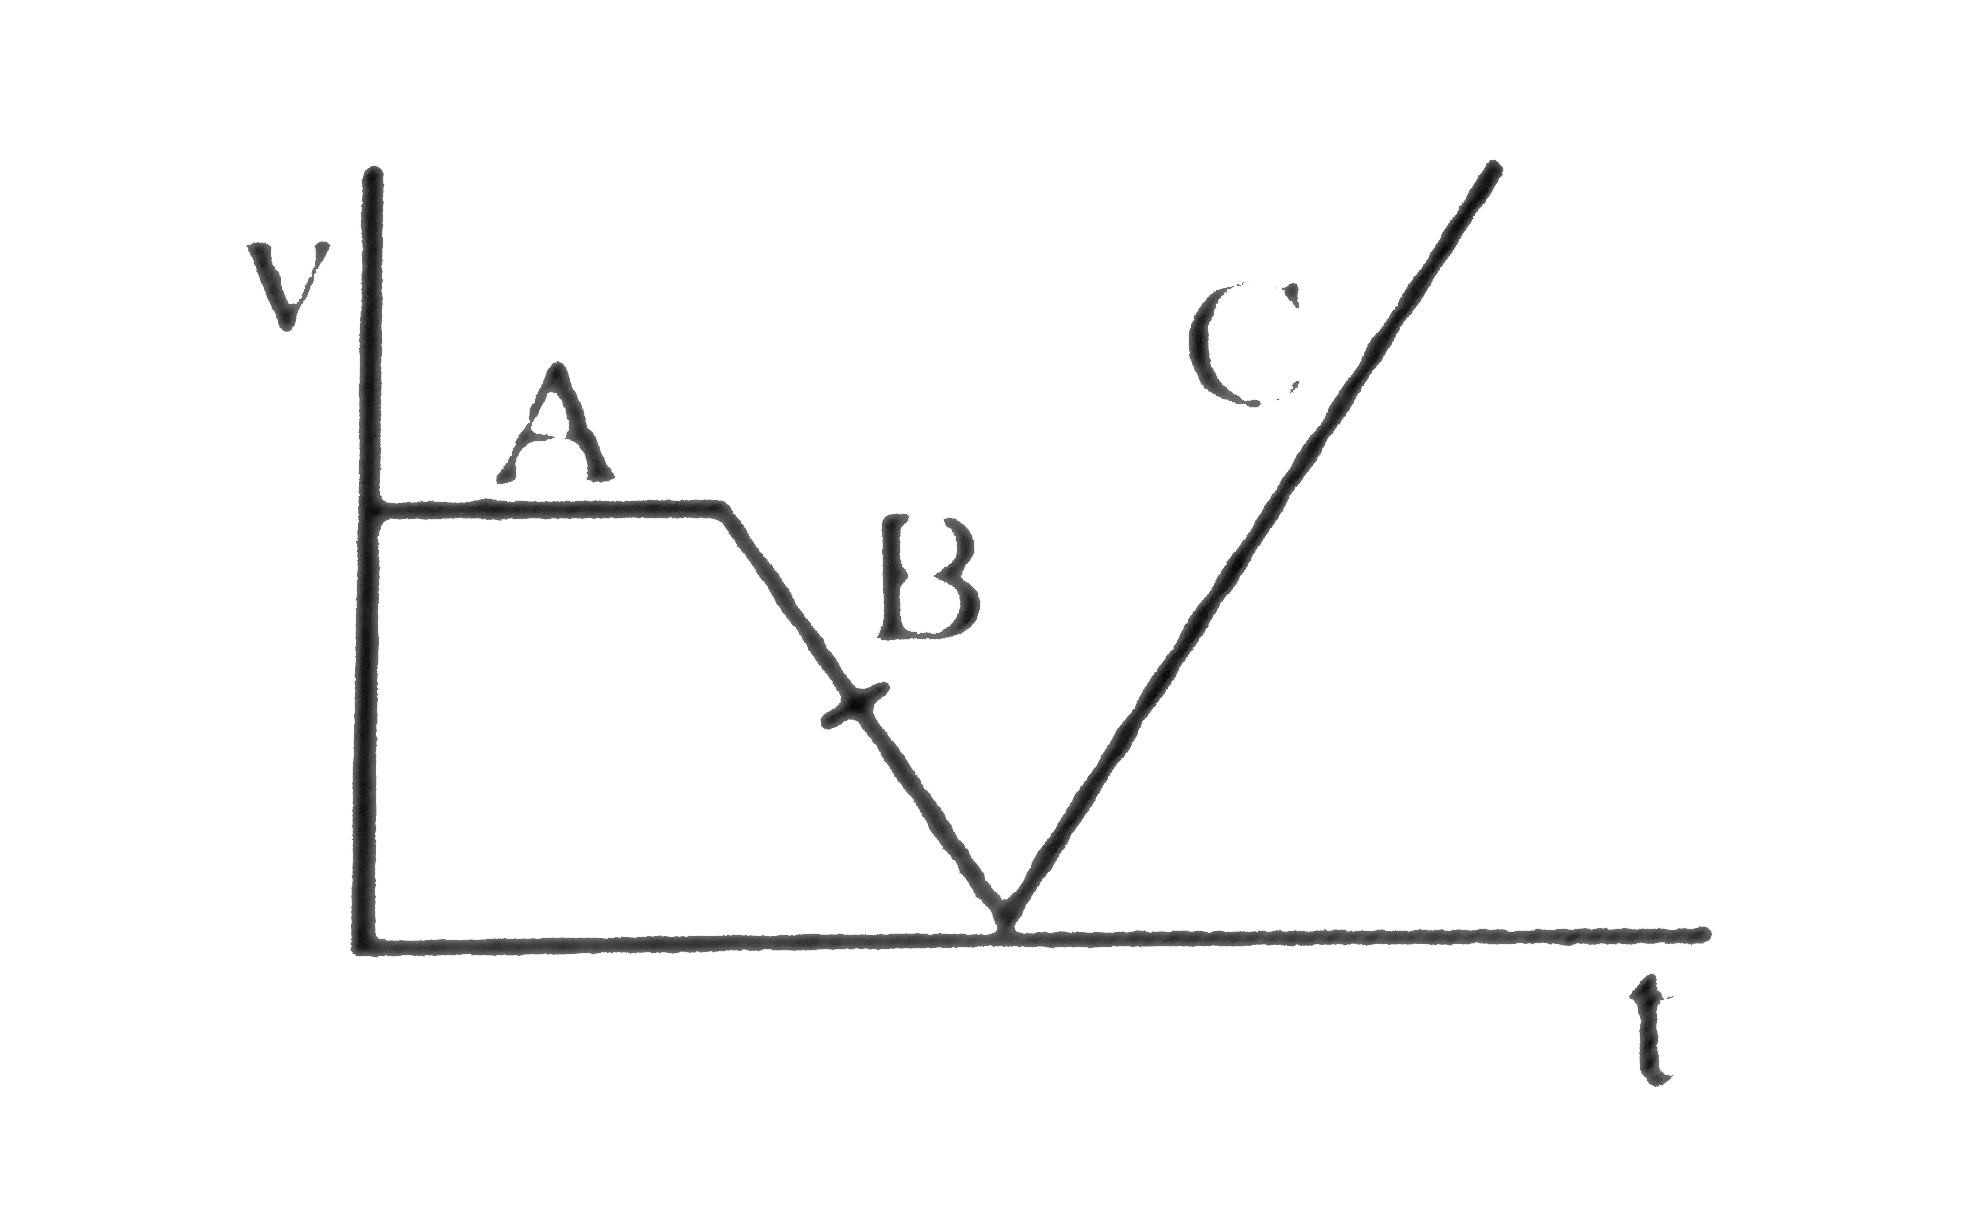
View SolutionVelocity versus time graph of a body is shown in figure. It explains that
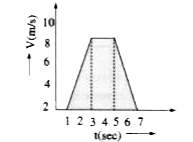
View SolutionFor the velocity - time graph shown in figure below the distance covered by the body in last two seconds of its motion is what fraction of the total distance covered by it in all the total distance covered by it in all the seven seconds
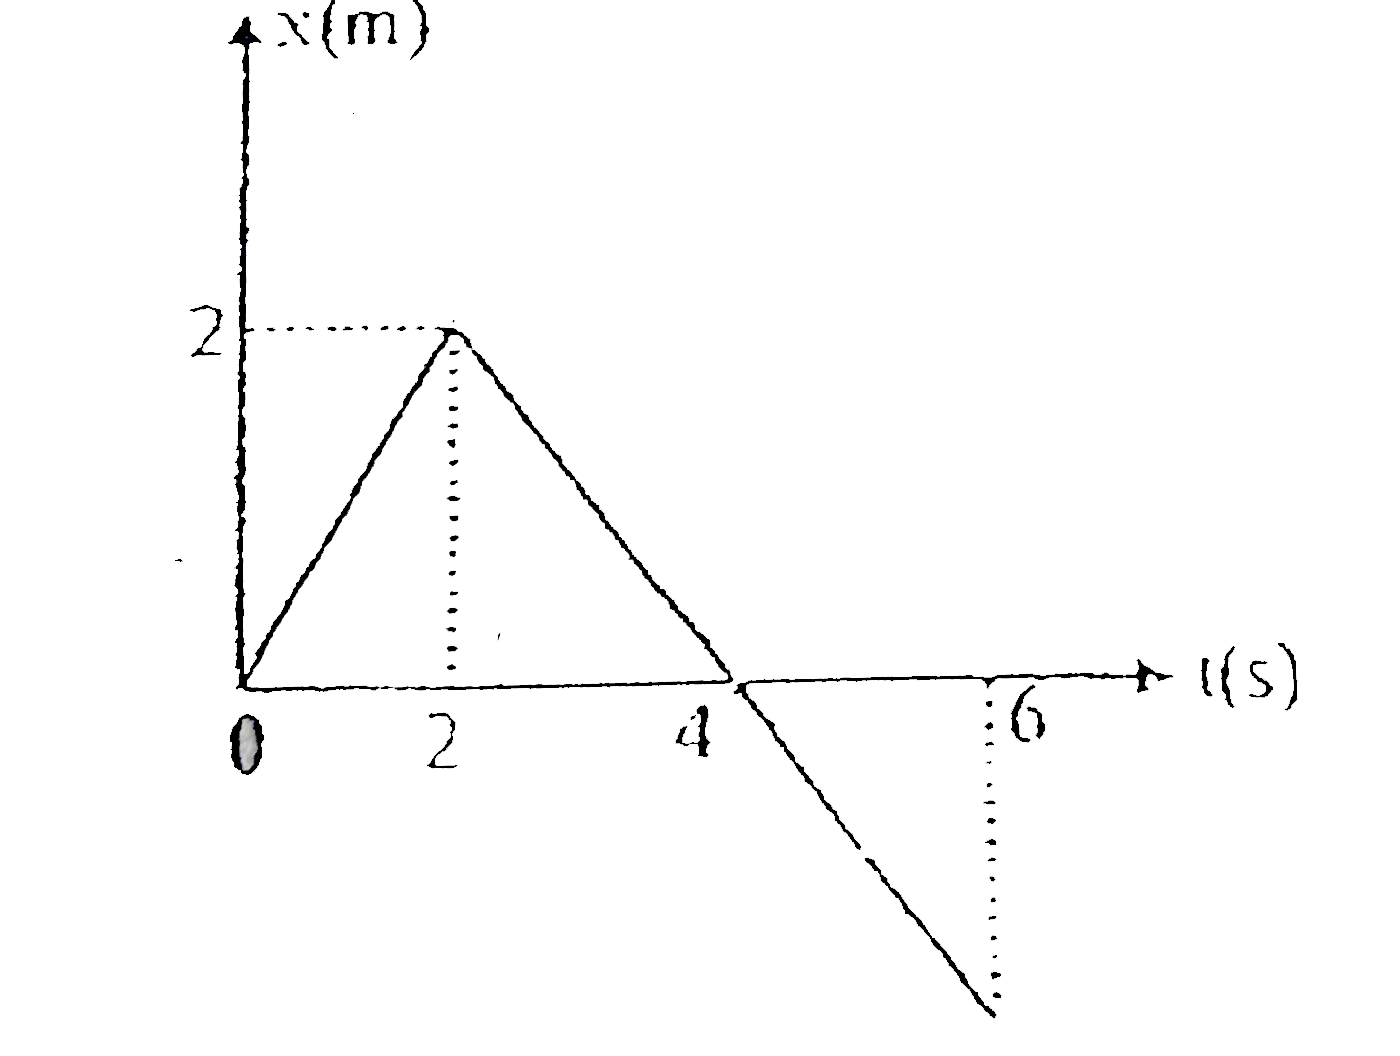
View SolutionPosition time graph of a particle of mass 2 kg is shown in figrure. Total work done on the particle from t=0 to t=4s is
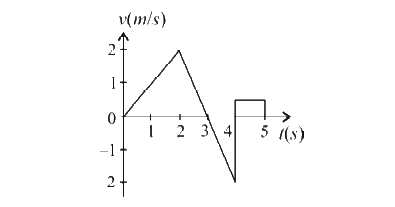
View SolutionThe velocity versus time graph of a body in a straight line is as shown in figure. The displacment of the body in five seconds is
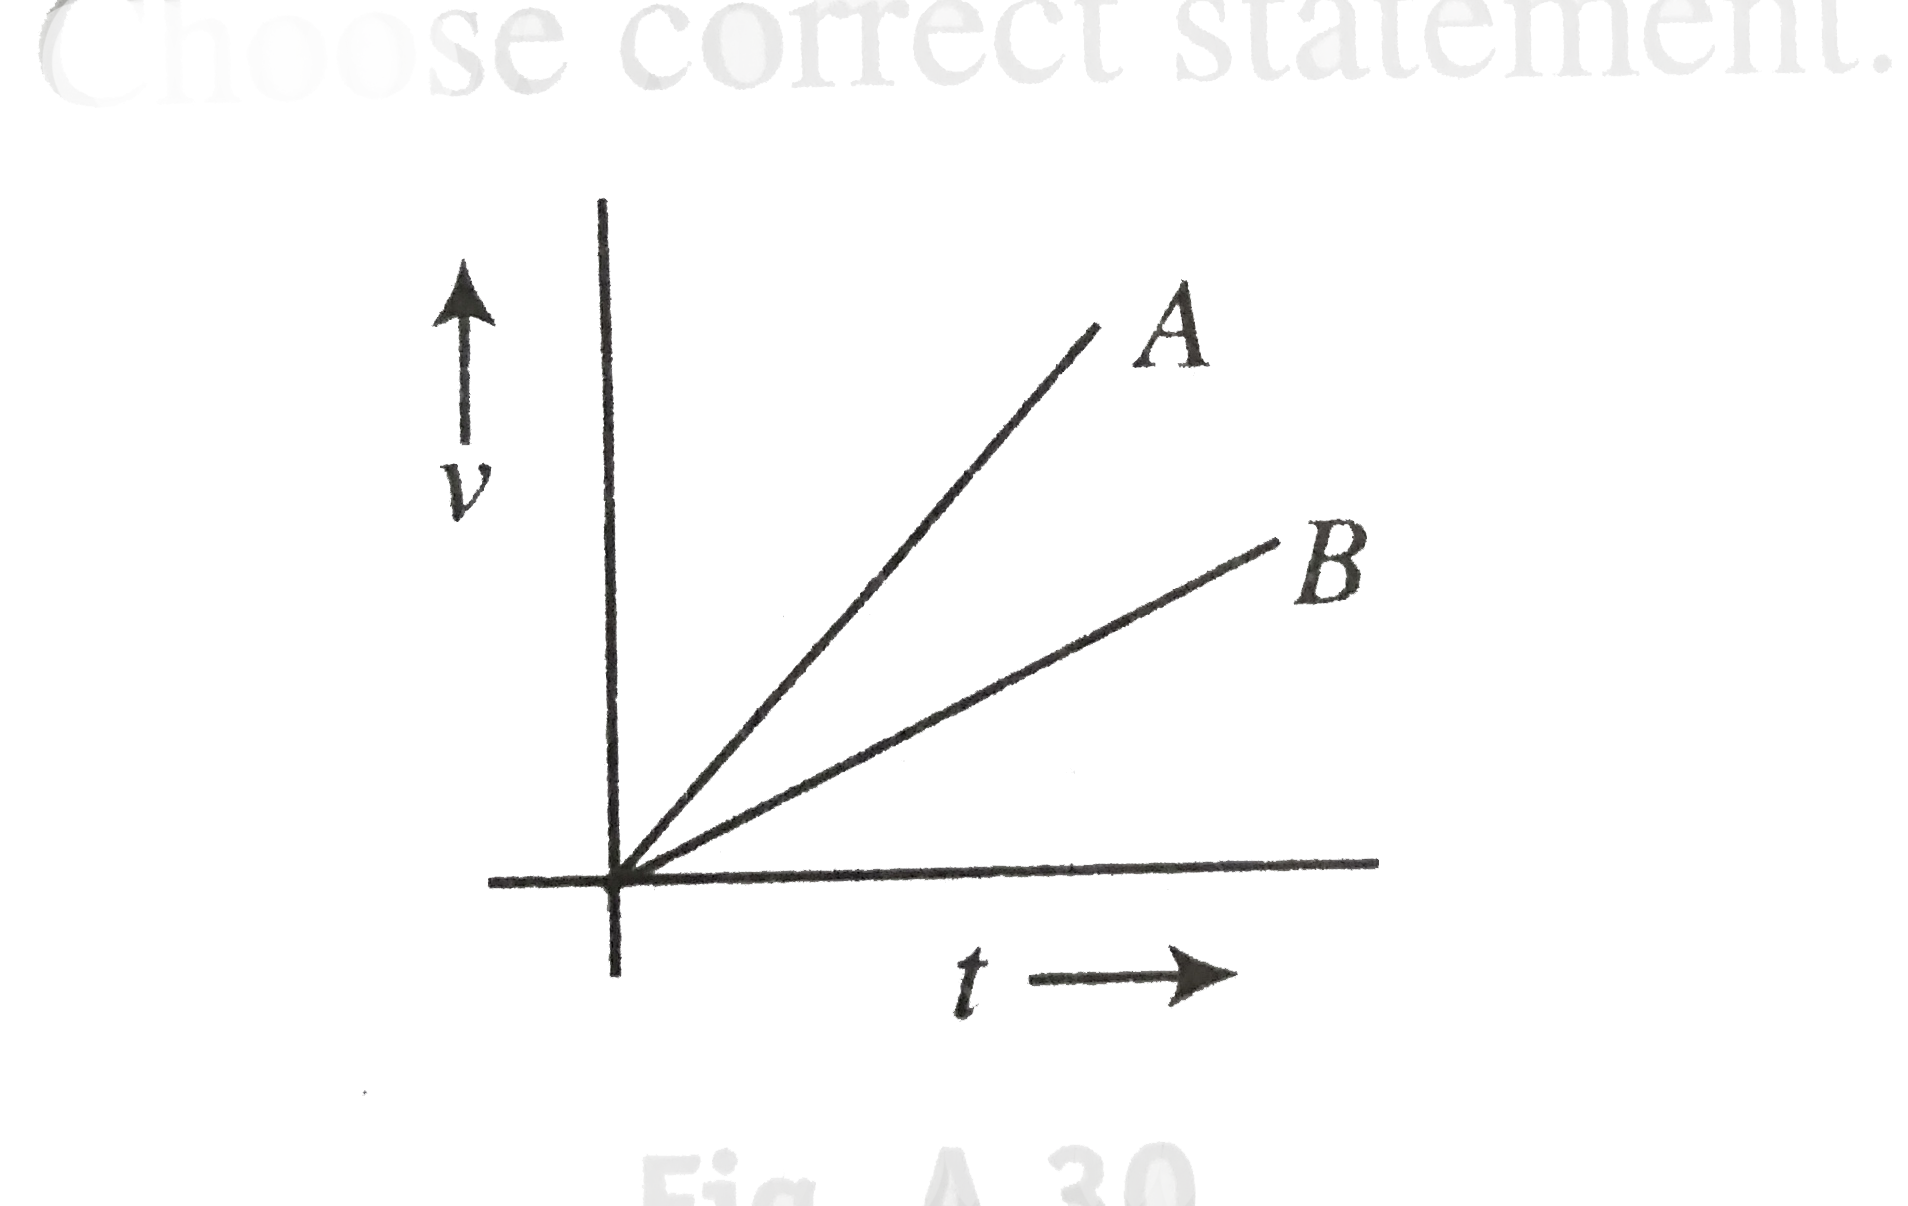
View SolutionThe velocity - time graph of two bodies A and B is shown in figure. Choose correct statement.
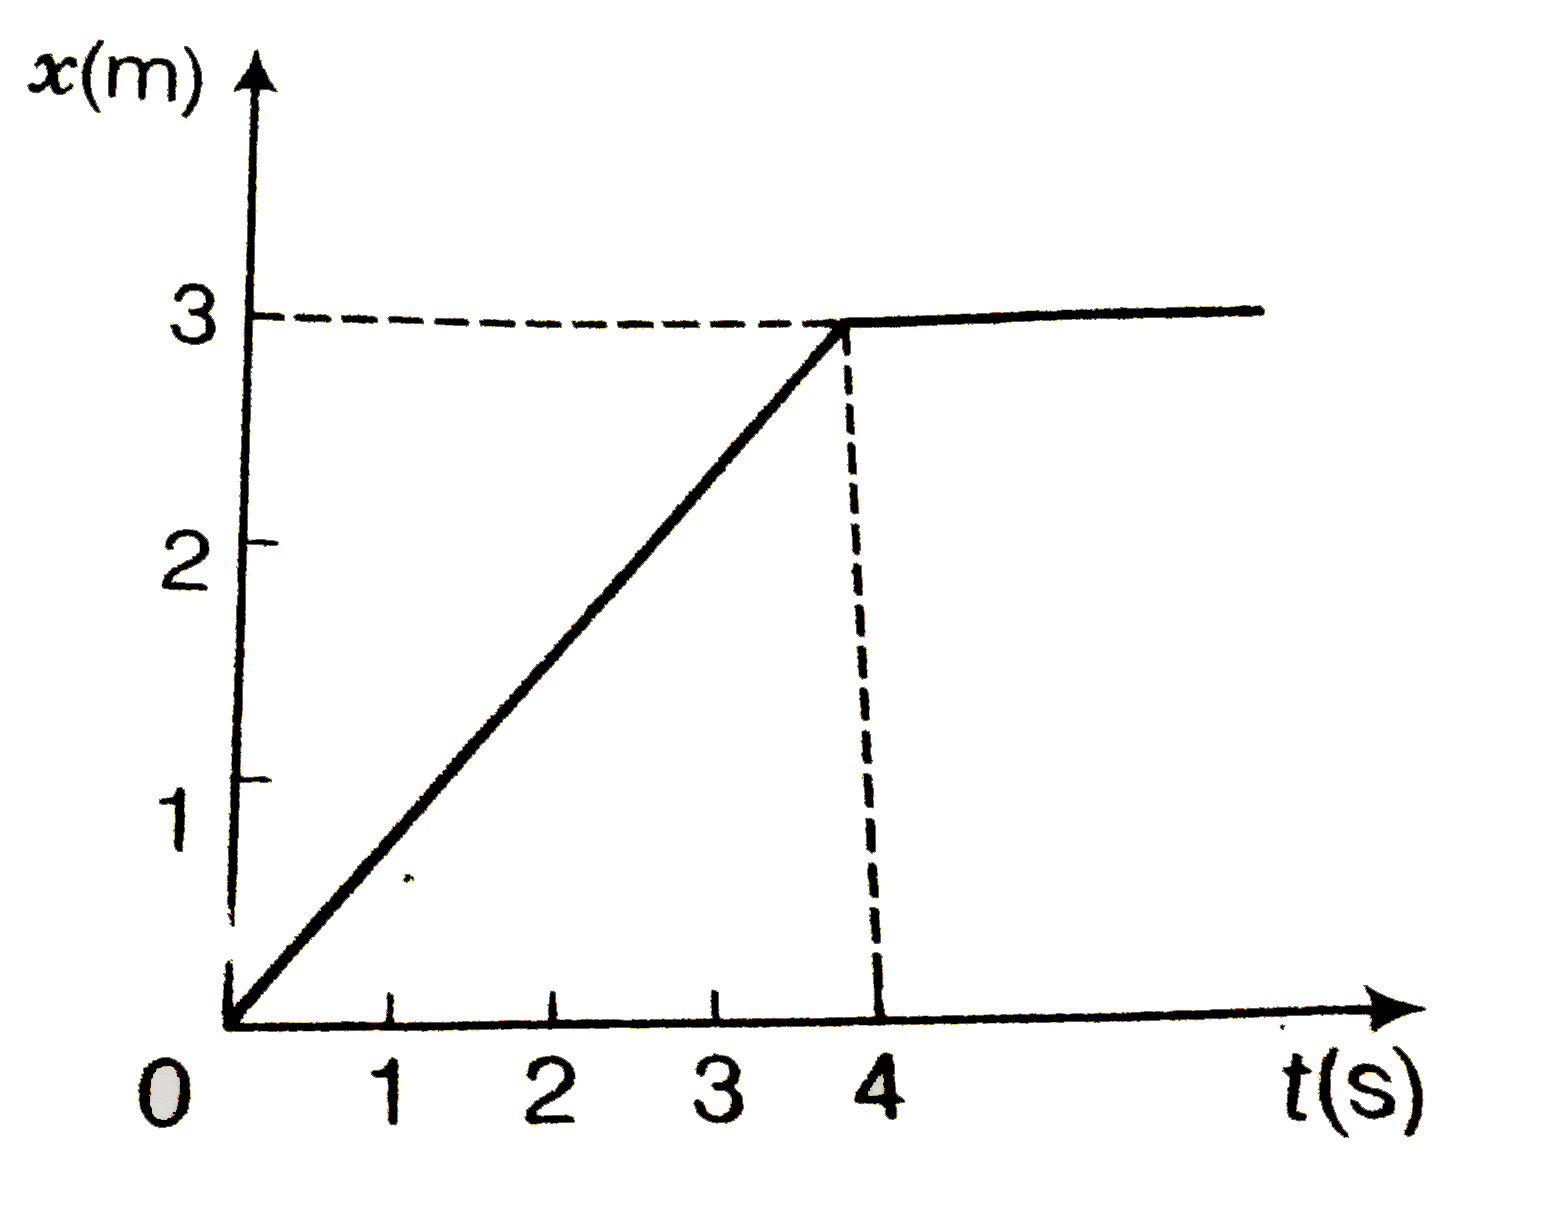
View SolutionThe position-time graph of a body of mass 2 kg is as given in figure . What is the impulse on the body at t = 0 s and t = 4 s .
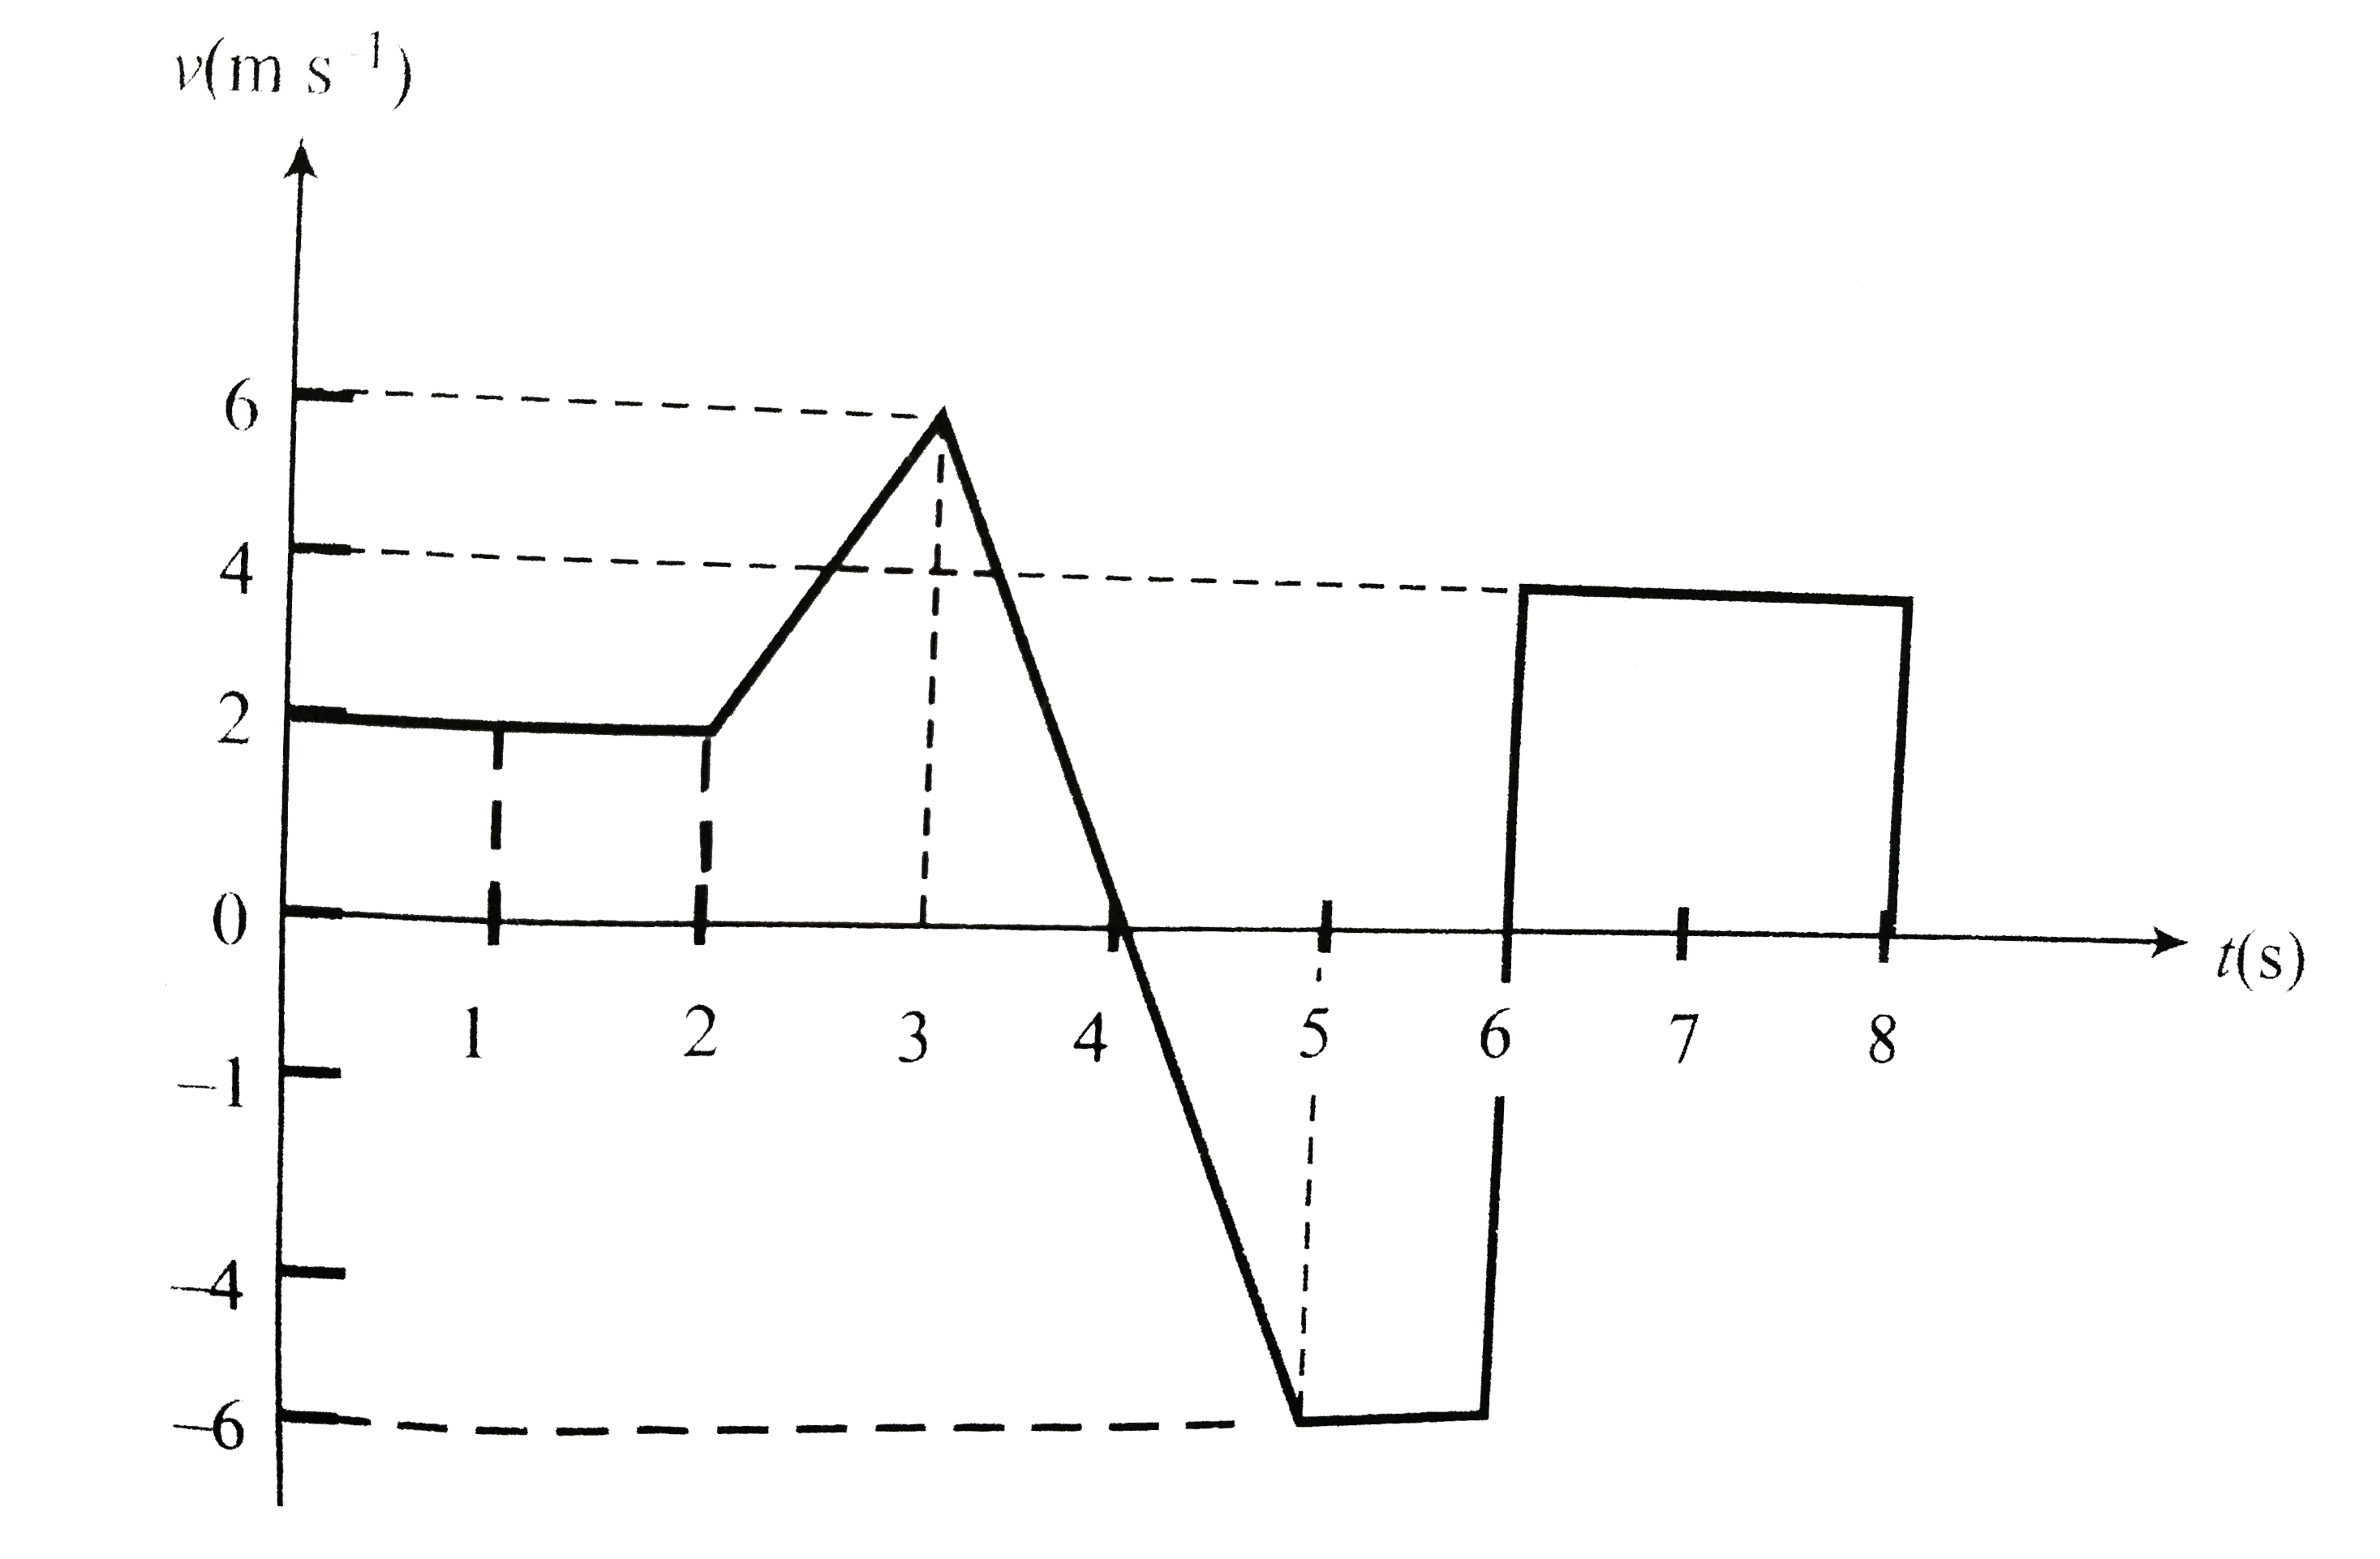
View SolutionThe velocity-time graph of a body is shown in .
The displacement of the body in 8s is.
 .
.
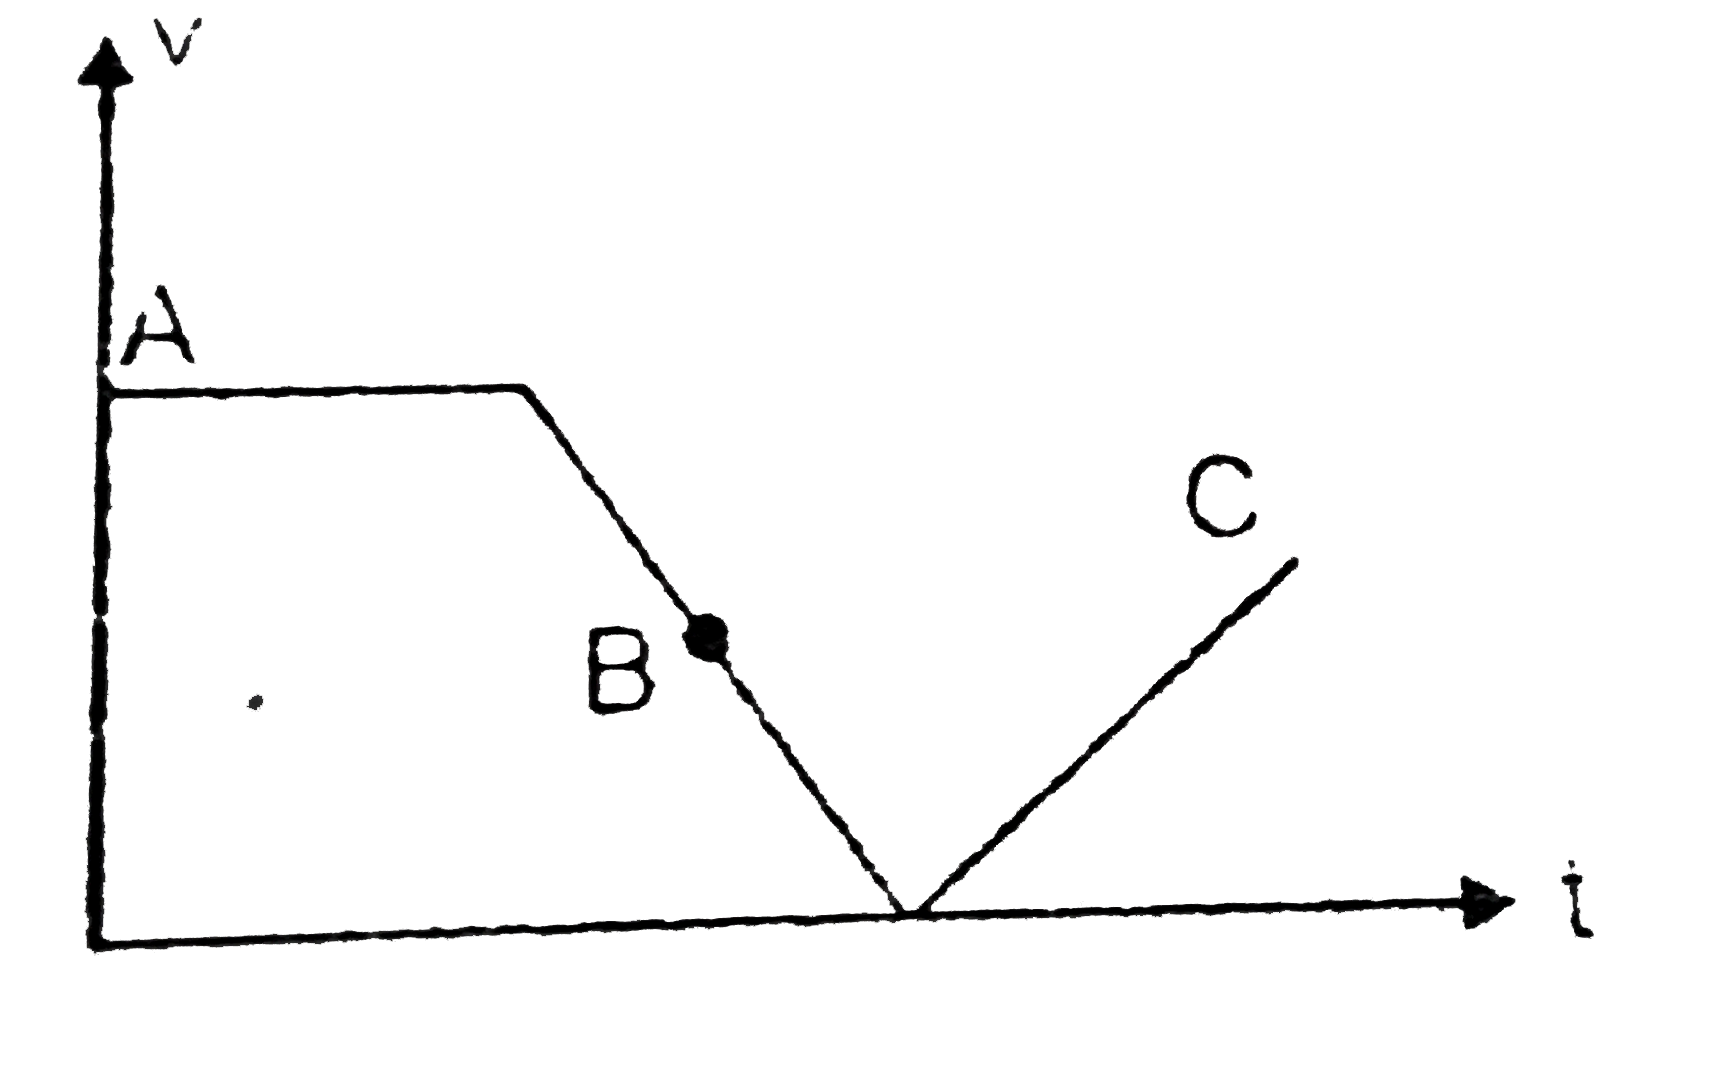
View SolutionThe velocity time graph of a body is shown in fig. it indicates that :
View SolutionA force given by the relation F=8t, acts on a body of mass 2kg, initialiy at rest. Find the work done by this force on the body during first 2 seconds of its motion.
View Solution
