100 mL of 0.1 HCl is taken in a beaker and to it 100 mL of 0.1 M NaOH is added in steps of 2ml and the pH is continuously measured . Which of the following graphs correctly depicts the change in pH
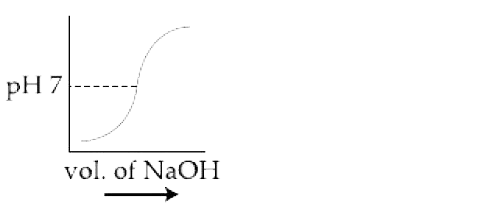
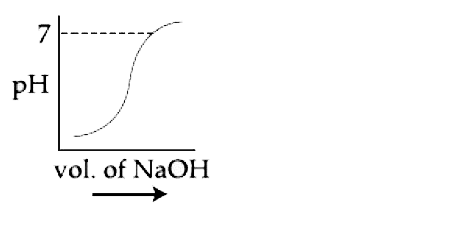
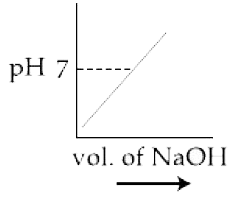
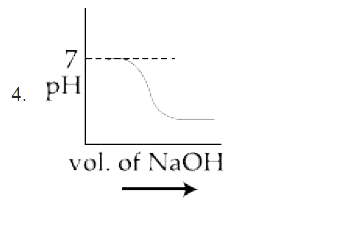
To solve the problem, we need to analyze the titration of hydrochloric acid (HCl) with sodium hydroxide (NaOH) and understand how the pH changes as NaOH is added incrementally. Here’s a step-by-step breakdown of the solution:
Step 1: Determine Initial pH of HCl Solution
1. We start with 100 mL of 0.1 M HCl.
2. The concentration of H⁺ ions in HCl is equal to its molarity since HCl is a strong acid and fully dissociates.
3. Therefore, (H⁺) = 0.1 M.
4. The pH is calculated using the formula:
pH=−log(H⁺)=−log(0.1)=1
Step 2: Understand the Neutralization Reaction
1. As we add NaOH, a strong base, it will react with the H⁺ ions from HCl.
2. The neutralization reaction is:
HCl+NaOH→NaCl+H2O
3. Initially, the solution is acidic (pH = 1).
Step 3: Incremental Addition of NaOH
1. We are adding NaOH in increments of 2 mL.
2. Each addition of NaOH will neutralize an equivalent amount of H⁺ ions, causing the pH to gradually increase.
Step 4: Identify the Equivalence Point
1. The equivalence point occurs when all the H⁺ ions have been neutralized by NaOH.
2. For 100 mL of 0.1 M HCl, we have:
Moles of HCl=0.1mol/L×0.1L=0.01mol
3. To neutralize this, we need 0.01 mol of NaOH, which is also 100 mL of 0.1 M NaOH.
4. At the equivalence point, the pH will be around 7, as the solution will be neutral.
Step 5: Adding Excess NaOH
1. After reaching the equivalence point (when 100 mL of NaOH is added), any further addition of NaOH will increase the pH significantly.
2. The pH will rise sharply as the solution becomes increasingly basic.
Step 6: Graphical Representation
1. The graph of pH vs. volume of NaOH added will show:
- A low initial pH (around 1).
- A gradual increase in pH as NaOH is added.
- A sharp rise in pH at the equivalence point (around 100 mL of NaOH).
- A plateau at a higher pH after the equivalence point as more NaOH is added.
Conclusion
The correct graph will show a gradual increase in pH, a sharp increase at the equivalence point, and then a plateau as more NaOH is added.
1. We start with 100 mL of 0.1 M HCl.
2. The concentration of H⁺ ions in HCl is equal to its molarity since HCl is a strong acid and fully dissociates.
3. Therefore, (H⁺) = 0.1 M.
4. The pH is calculated using the formula:
pH=−log(H⁺)=−log(0.1)=1
1. As we add NaOH, a strong base, it will react with the H⁺ ions from HCl.
2. The neutralization reaction is:
HCl+NaOH→NaCl+H2O
3. Initially, the solution is acidic (pH = 1).
1. We are adding NaOH in increments of 2 mL.
2. Each addition of NaOH will neutralize an equivalent amount of H⁺ ions, causing the pH to gradually increase.
1. The equivalence point occurs when all the H⁺ ions have been neutralized by NaOH.
2. For 100 mL of 0.1 M HCl, we have:
Moles of HCl=0.1mol/L×0.1L=0.01mol
3. To neutralize this, we need 0.01 mol of NaOH, which is also 100 mL of 0.1 M NaOH.
4. At the equivalence point, the pH will be around 7, as the solution will be neutral.
1. After reaching the equivalence point (when 100 mL of NaOH is added), any further addition of NaOH will increase the pH significantly.
2. The pH will rise sharply as the solution becomes increasingly basic.
1. The graph of pH vs. volume of NaOH added will show:
- A low initial pH (around 1).
- A gradual increase in pH as NaOH is added.
- A sharp rise in pH at the equivalence point (around 100 mL of NaOH).
- A plateau at a higher pH after the equivalence point as more NaOH is added.
The correct graph will show a gradual increase in pH, a sharp increase at the equivalence point, and then a plateau as more NaOH is added.
Topper's Solved these Questions
Similar Questions
100 mL of 0.2 N HCI is added to 100 mL of 0.18 N NaOH and whole volume is made one litre. What will be the pH of resulting solution.
View SolutionTo a 50 ml of 0.1 M HCl solution , 10 ml of 0.1 M NaOH is added and the resulting solution is diluted to 100 ml. What is change in pH of the HCl solution ?
View Solution100mL of 0.15MHCl is mixed with 100mL of 0.005MHCl , what is the pH of the following solution approxmately
View Solution100ml of 0.2MH2SO4 is added to 100ml of 0.2MNaOH. The resulting solution will be
View SolutionIn three beakers labelled as (A),(B) and (C ) , 100 mL of water, 100 mL of 1 M solution of glucose in water and 100 mL of 0.5 M solution of glucose in water are taken respectively and kept at same temperature .
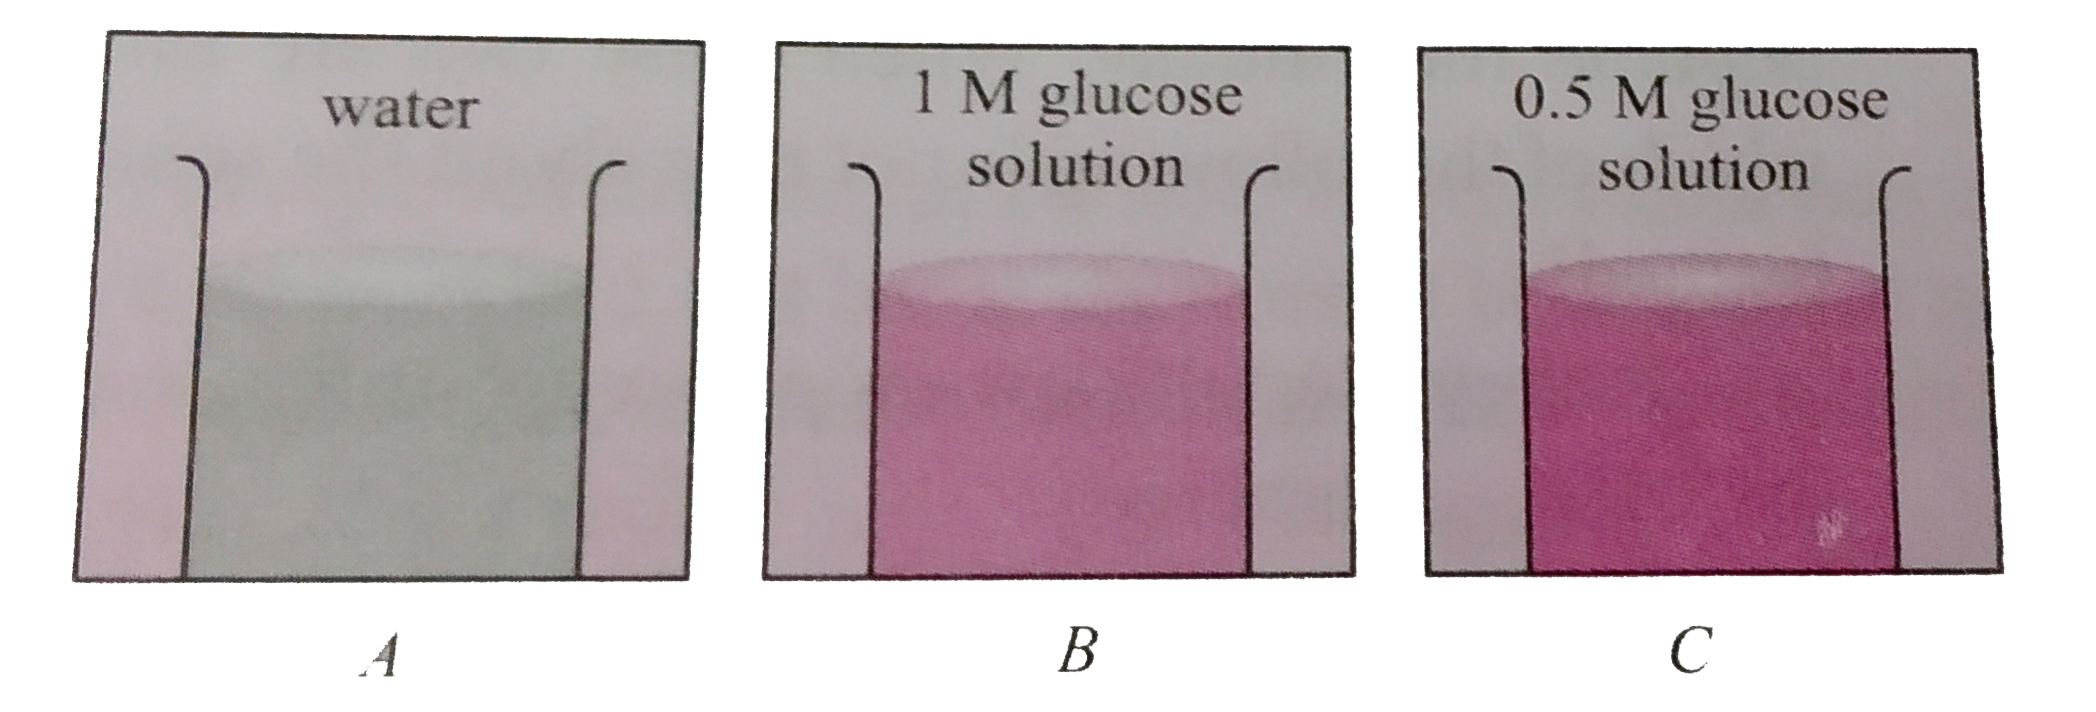
Which of the following statements is correct ?
View Solution100 ml of 0.1 M NaCl and 100 ml of 0.2 MNaOH are mixed. What is the change in pH of NaCI solution ?
View SolutionIf 100 mL of 1NH2SO4 is mixed with 100 mL of 1 M NaOH solution. The resulting solution will be
View Solution1 ml of 0.1 M HCl is added into 99 ml of water . Assume volumes are additive, what is pH of resulting solution .
View Solution100 ml of 0.1 N NaOH is mixed with 50 ml of 0.1 N H2SO4 . The pH of the resulting solution is
View Solution100 mL of 0.01 M solution of NaOH is diluted to 1 litre. The pH of resultant solution will be
View Solution
