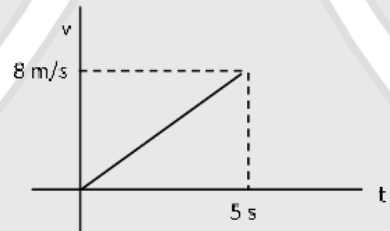
The speed verses time graph for a particle is shown in the figure. The distance travelled (in m) by the particle during the time interval t = 0 to t = 5 s will be __________
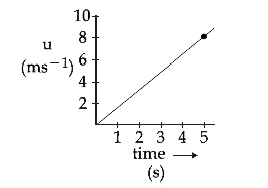
Step by step video & image solution for The speed verses time graph for a particle is shown in the figure. The distance travelled (in m) by the particle during the time interval t = 0 to t = 5 s will be __________ by Physics experts to help you in doubts & scoring excellent marks in Class 12 exams.
Updated on:21/07/2023Topper's Solved these Questions
Similar Questions
Knowledge Check
The speed-time graph of a particle moving along a fixed direction as shown in the figure. The distance traversed by the particle between t = 0 s to t = 10 s is
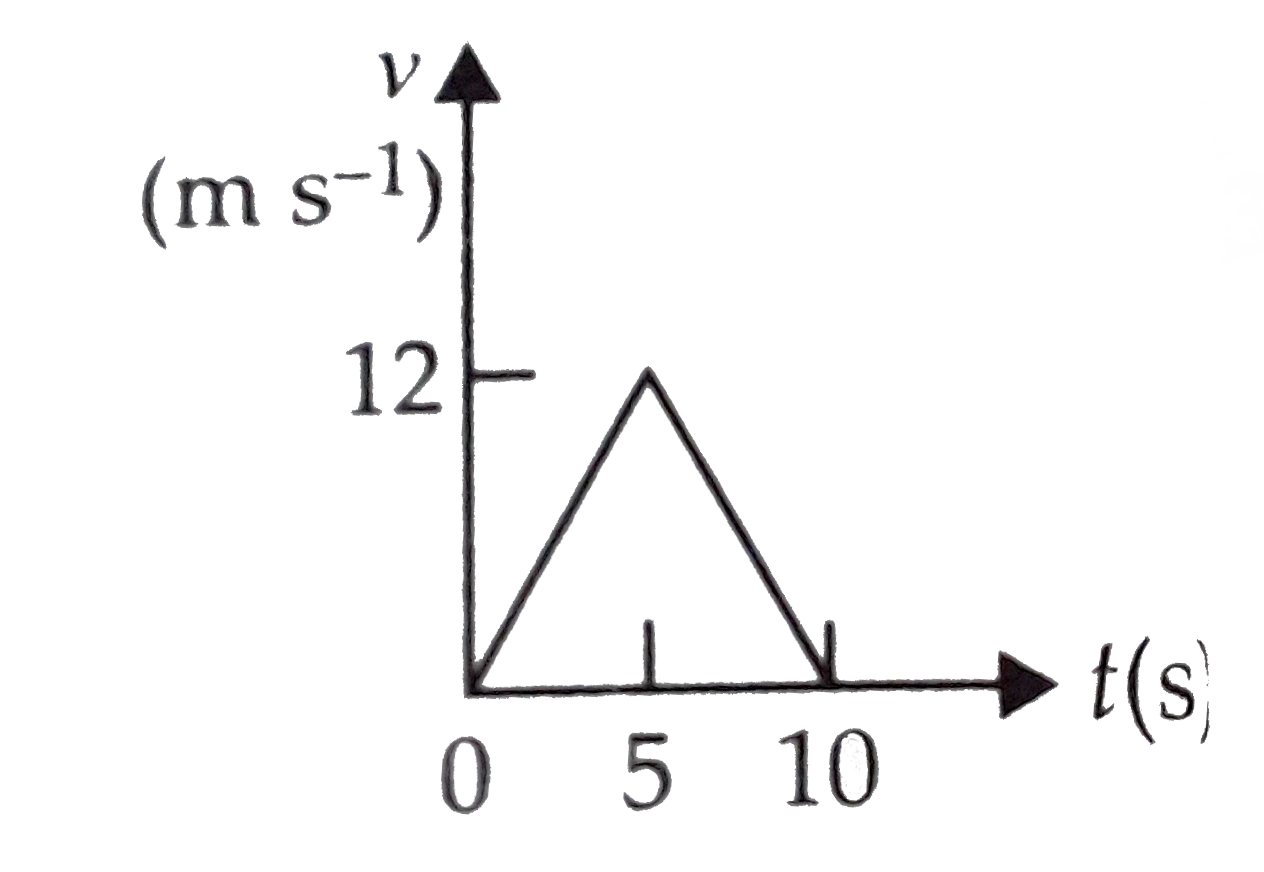 A20 mB40 mC60 mD80 m
The diagram shows the displacement - time graph for a particle moving in a straight line. The distance (in m) coverted by the particle in the time interval t=0 to t=5s is
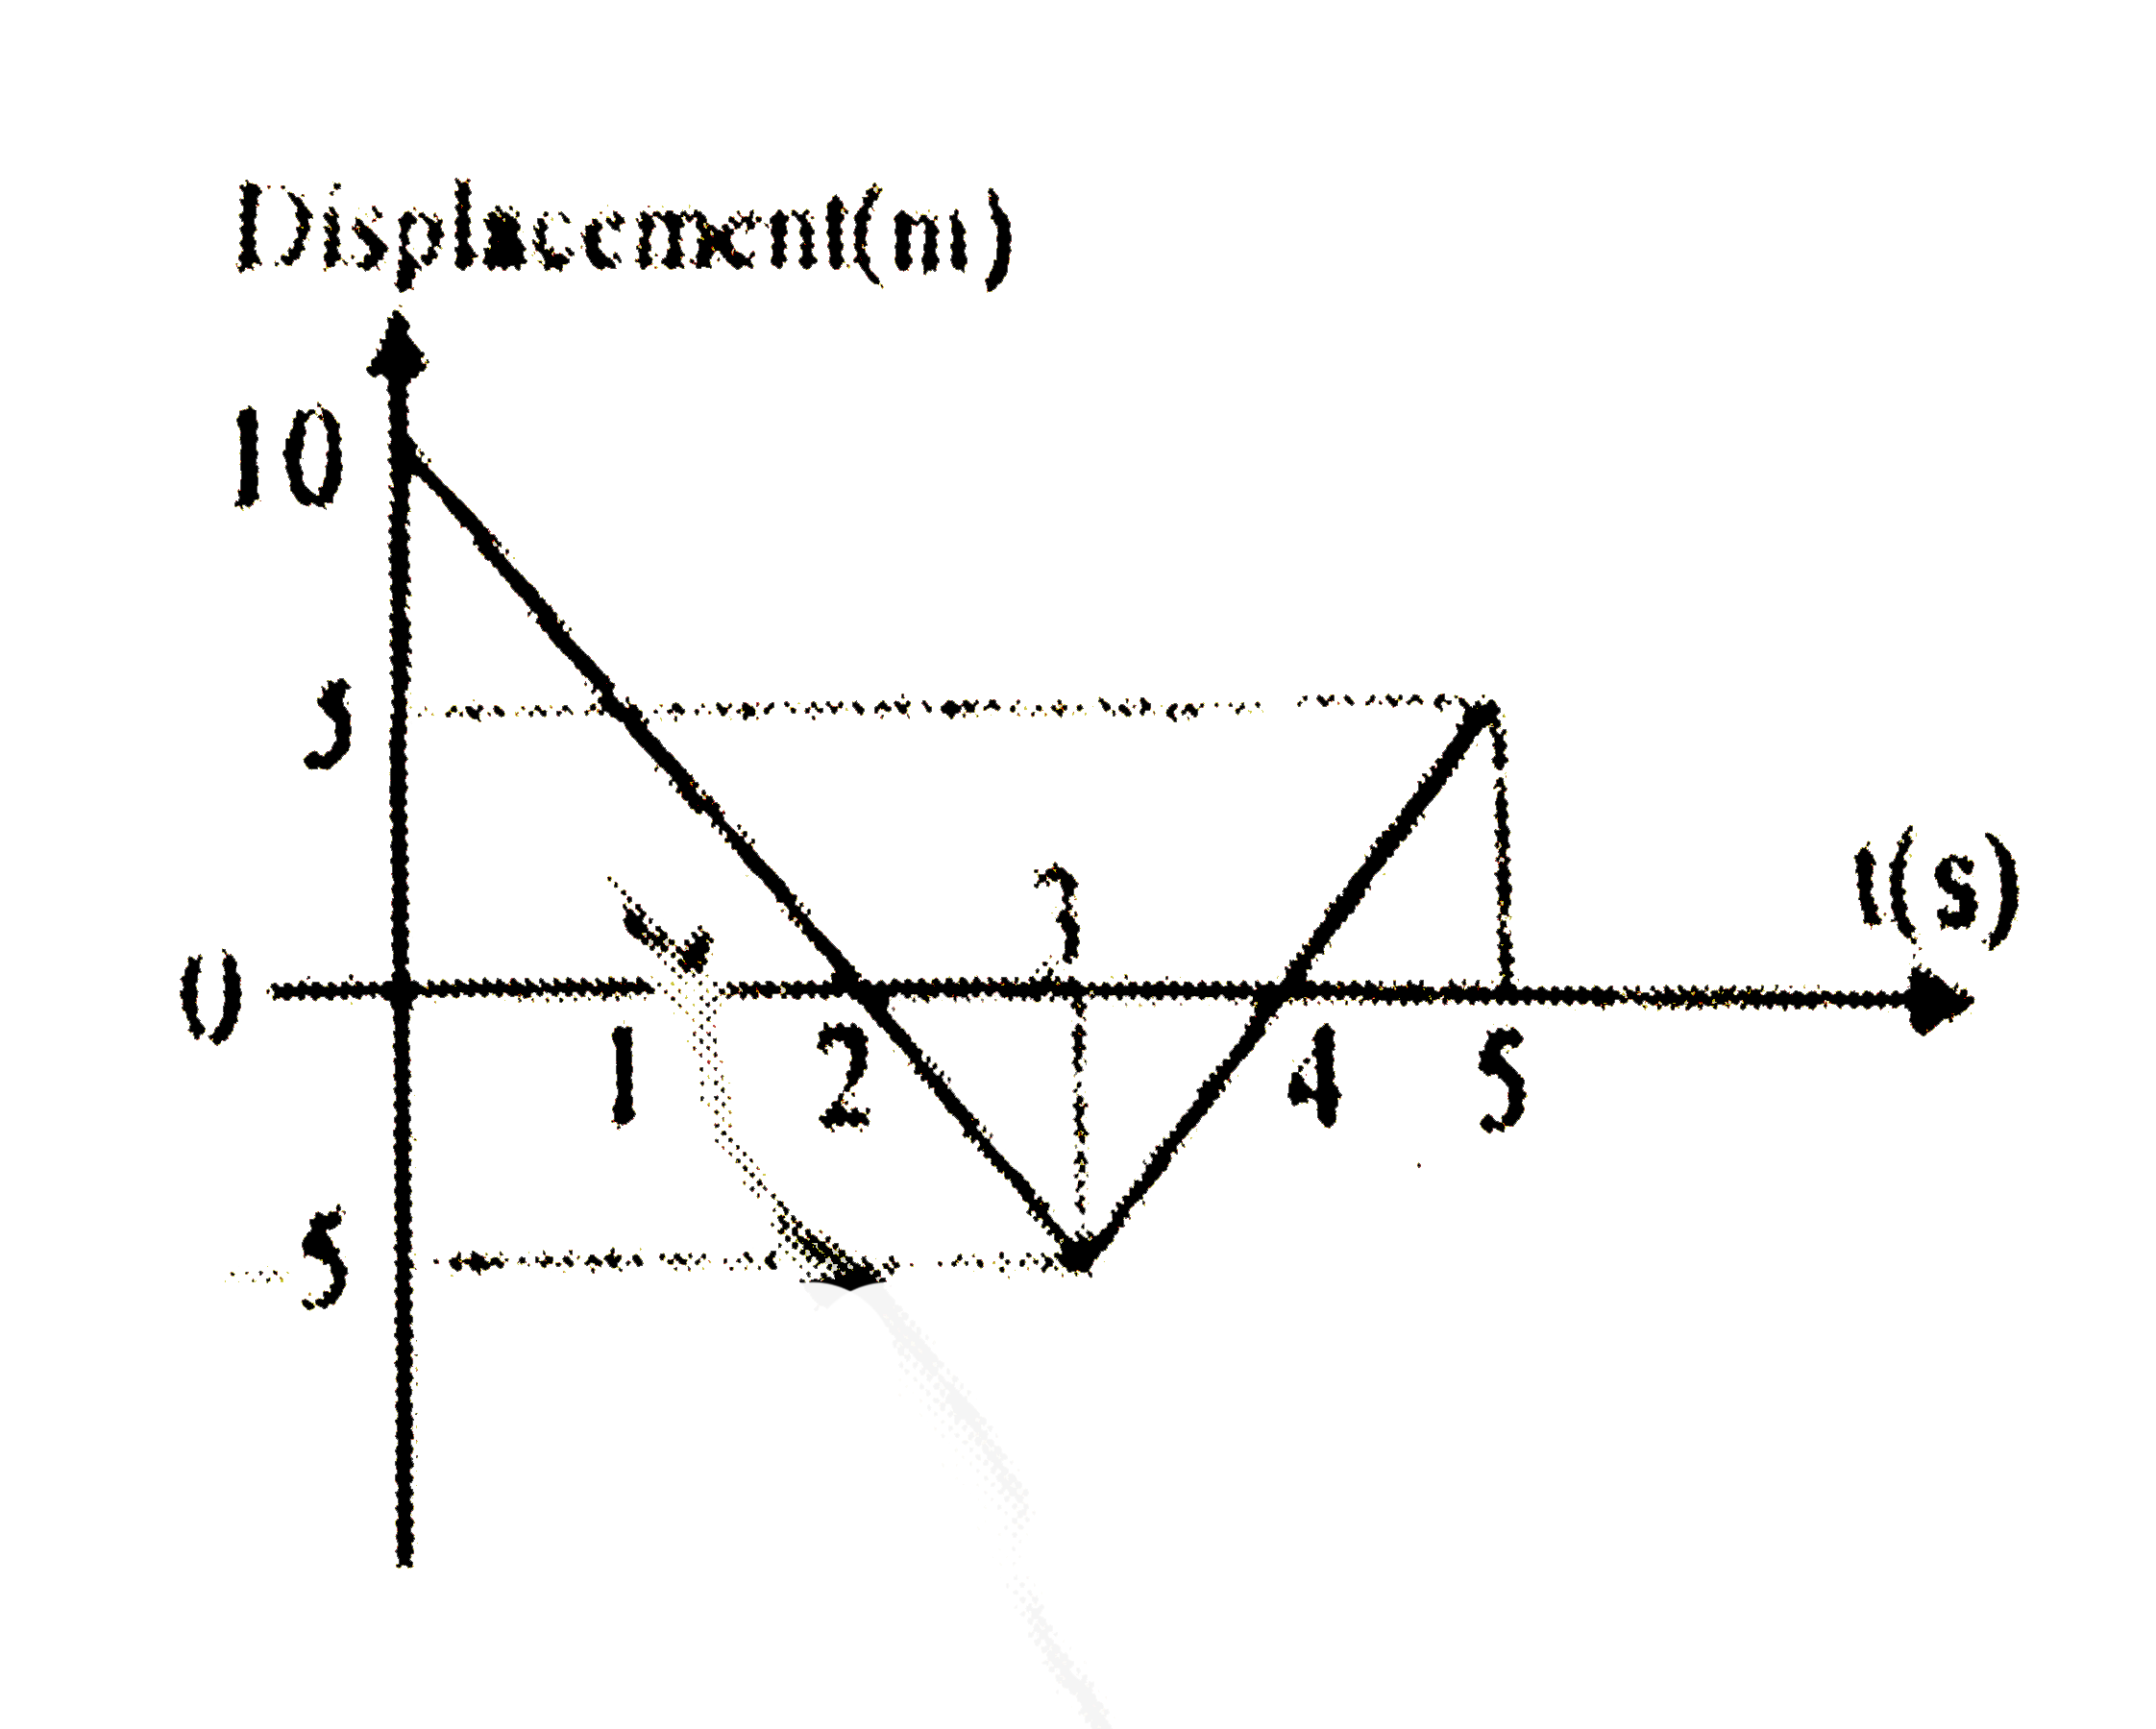
View SolutionThe position - time graph for a particle moving along a straight line is shown in figure. The total distance travelled by it in time t = 0 to t = 10 s is
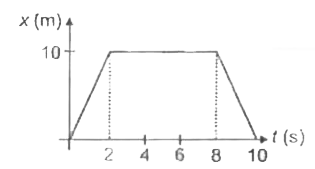
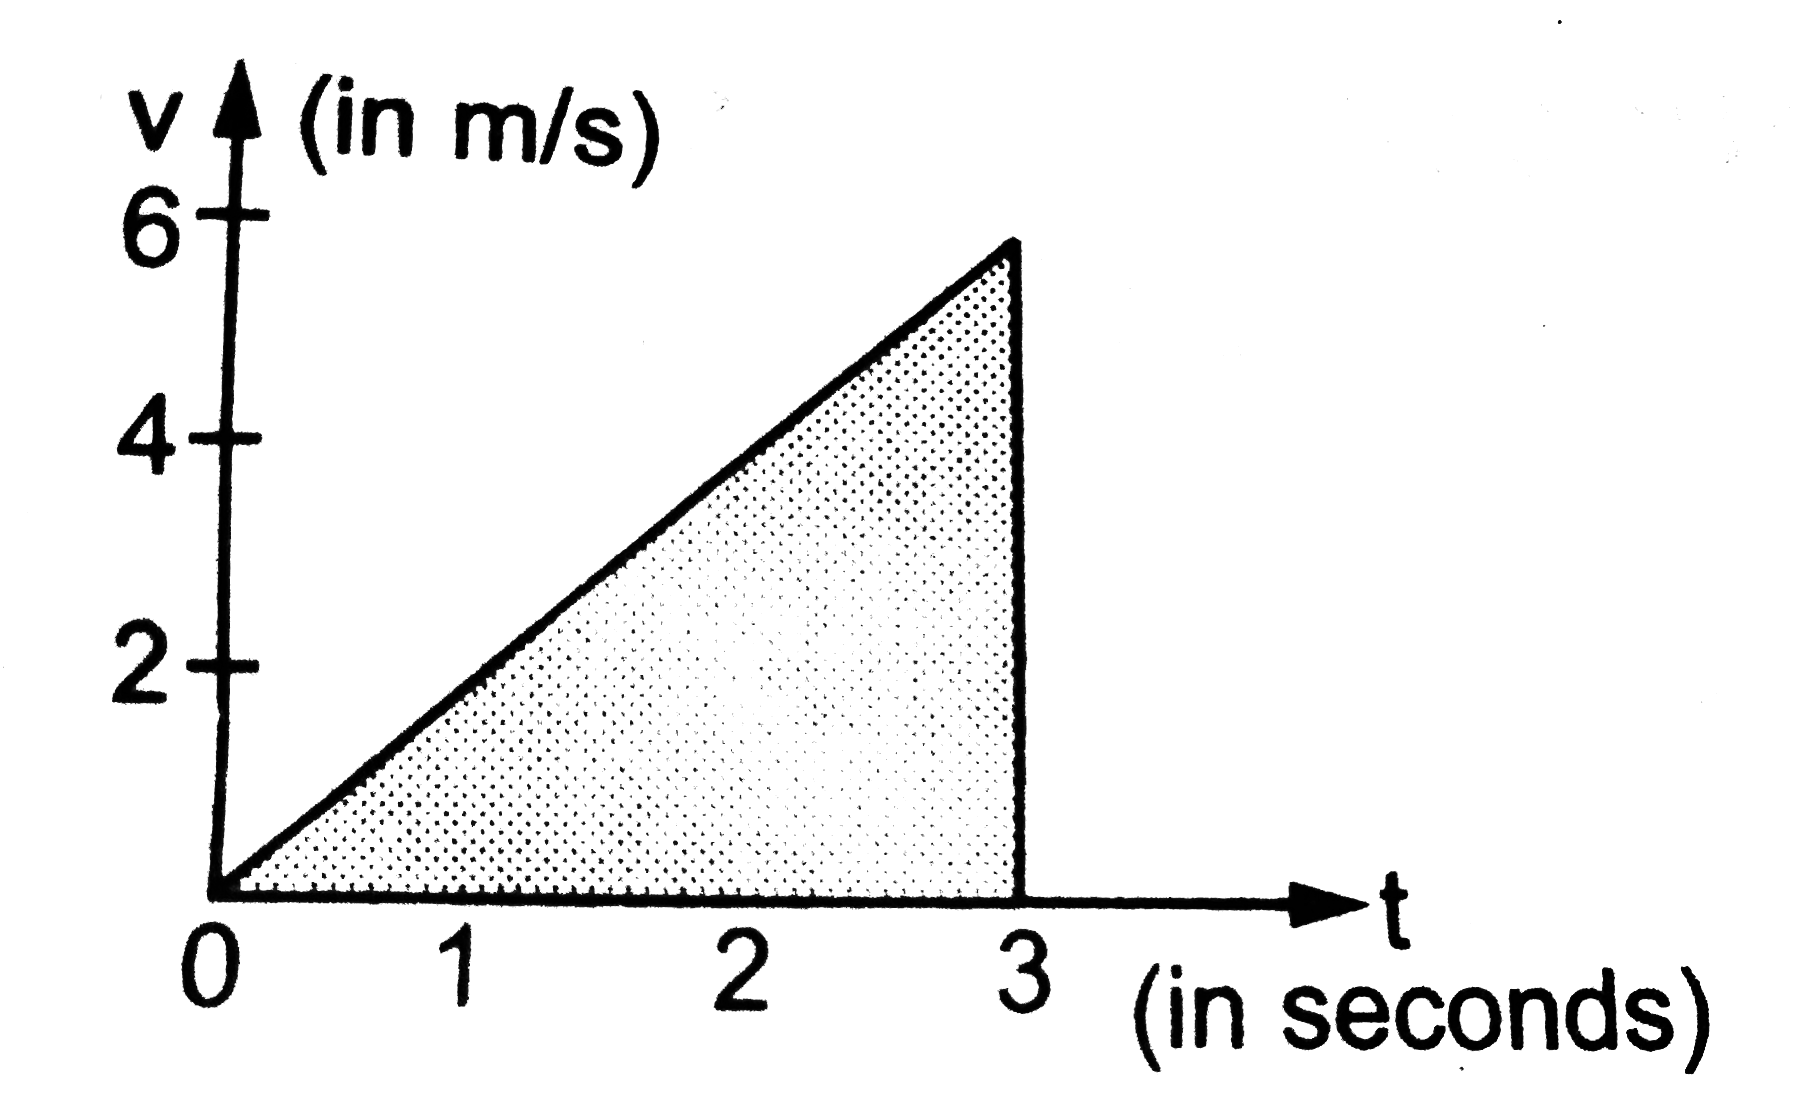
View SolutionThe speed - time graph of a particle moving along a solid curve is shown below. The distance traversed by the particle from t = 0 to t = 3 is
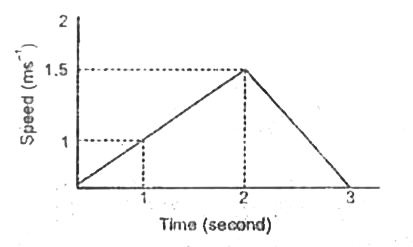
View SolutionThe position (x) - time (t) graph for a particle moving along a straight line is shown in figure. The average speed of particle in time interval t = 0 to t = 8 s is
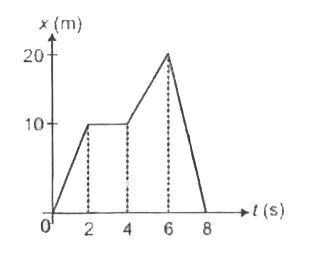
View SolutionFigure shows the velocity time graph for a particle travelling along a straight line. The magnitude of average velocity (in m/s) of particle during the time interval from t=0 to t=6s is 10α. Find the value of α.
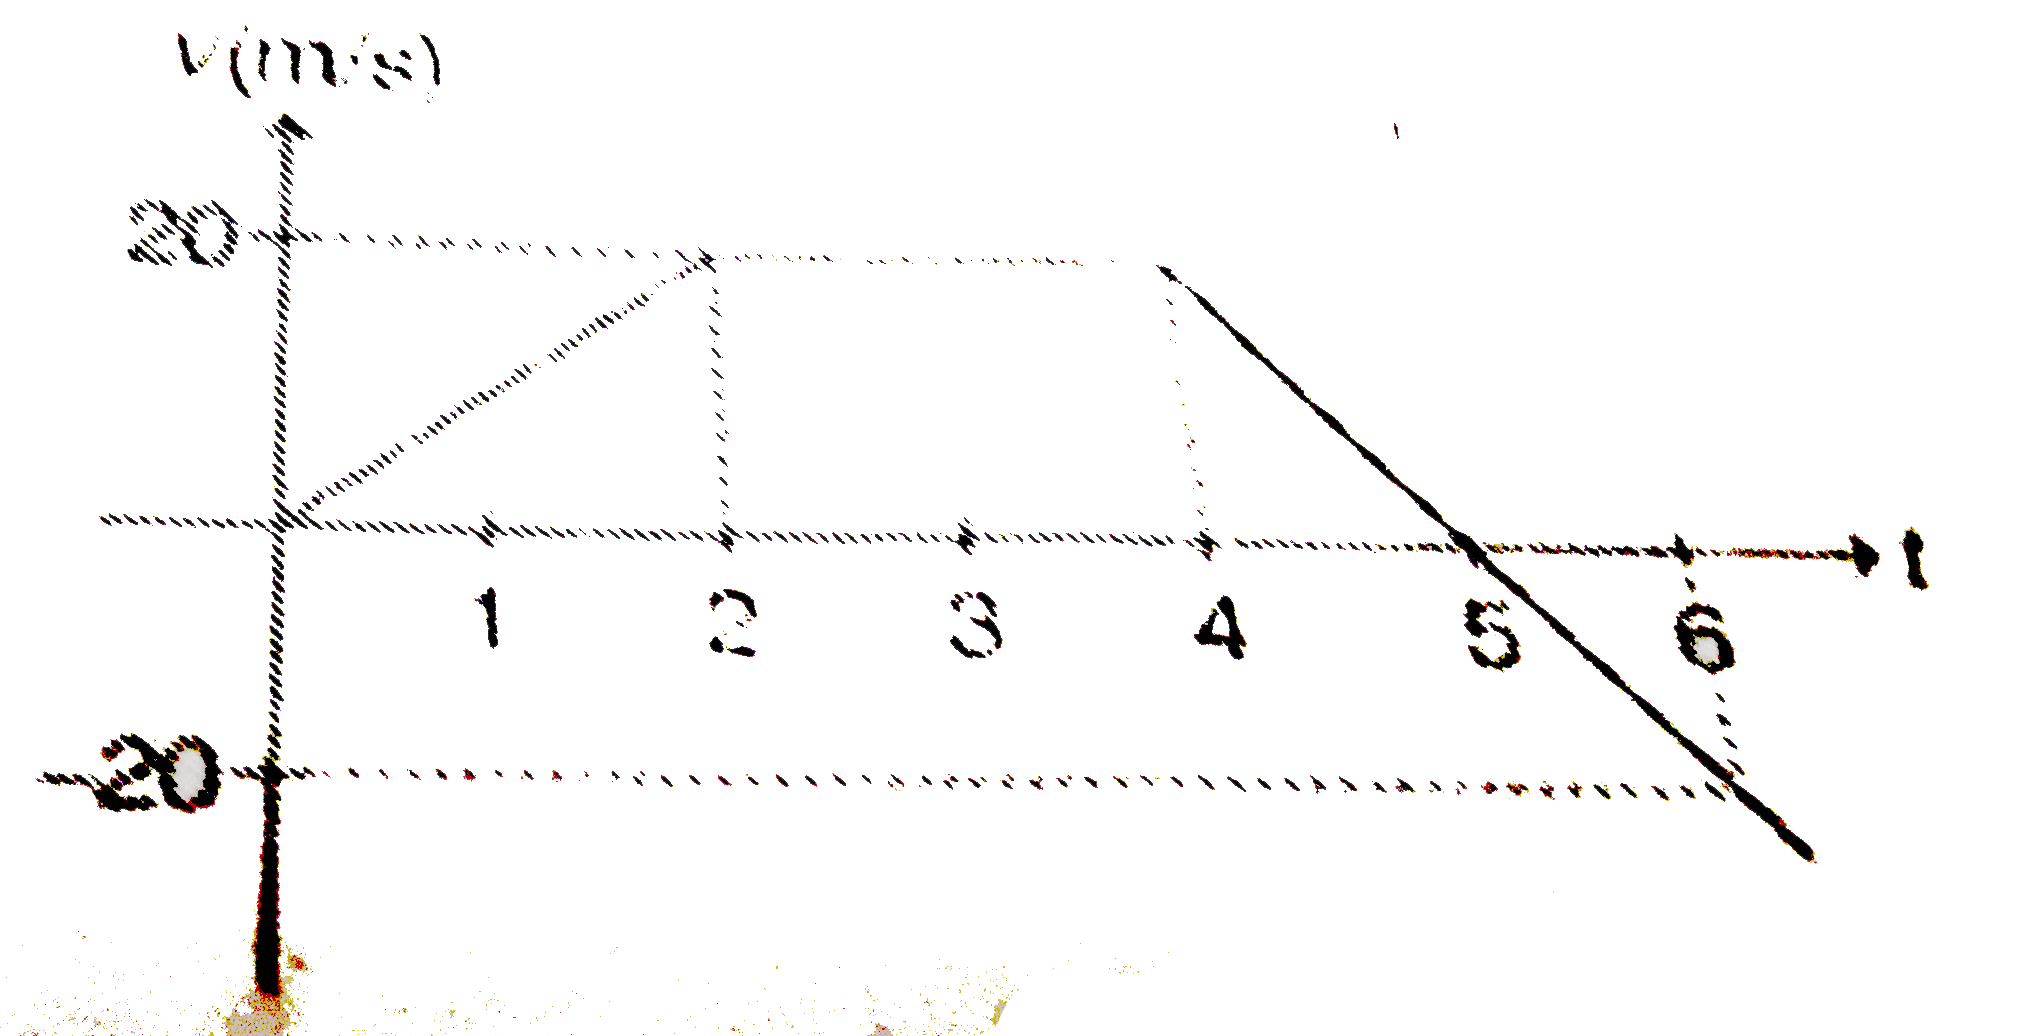
View SolutionPosition-time graph for a particle moving along x− direction is as shown in the figure. Average speed of the particle from t=0 to t=4 is :
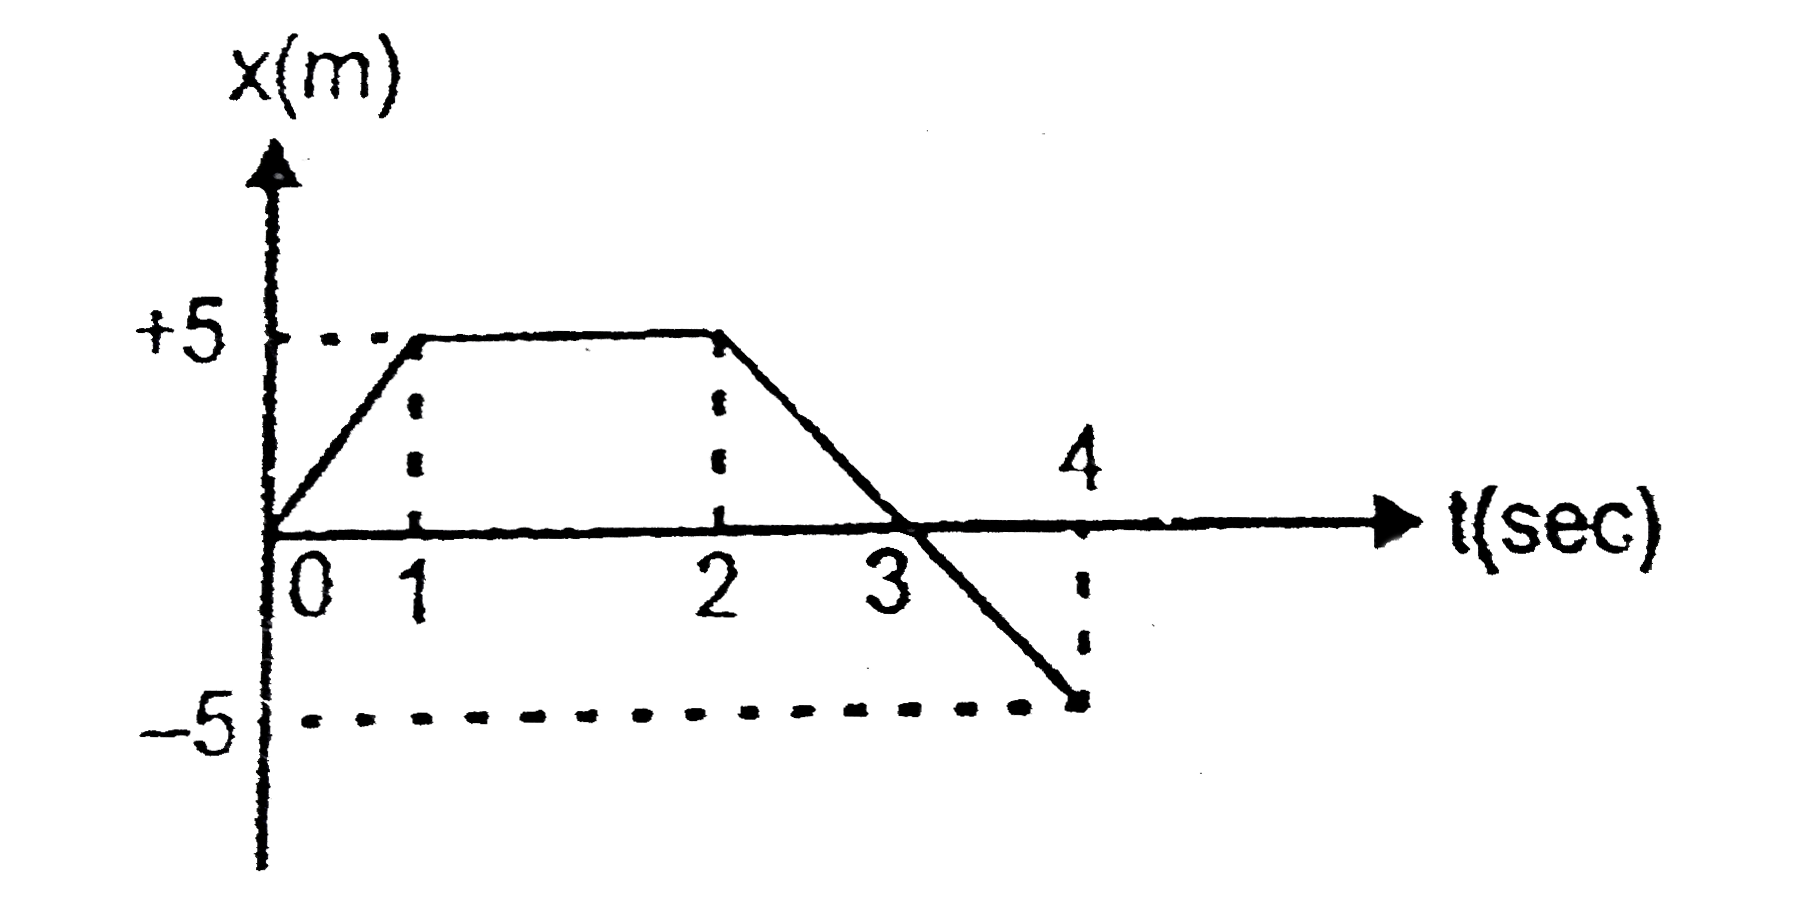
View SolutionThe speed-time graph of a particle moving along a fixed direction is shown in the Fig. The distance traversed by the particle between (a) t=0s→10s .
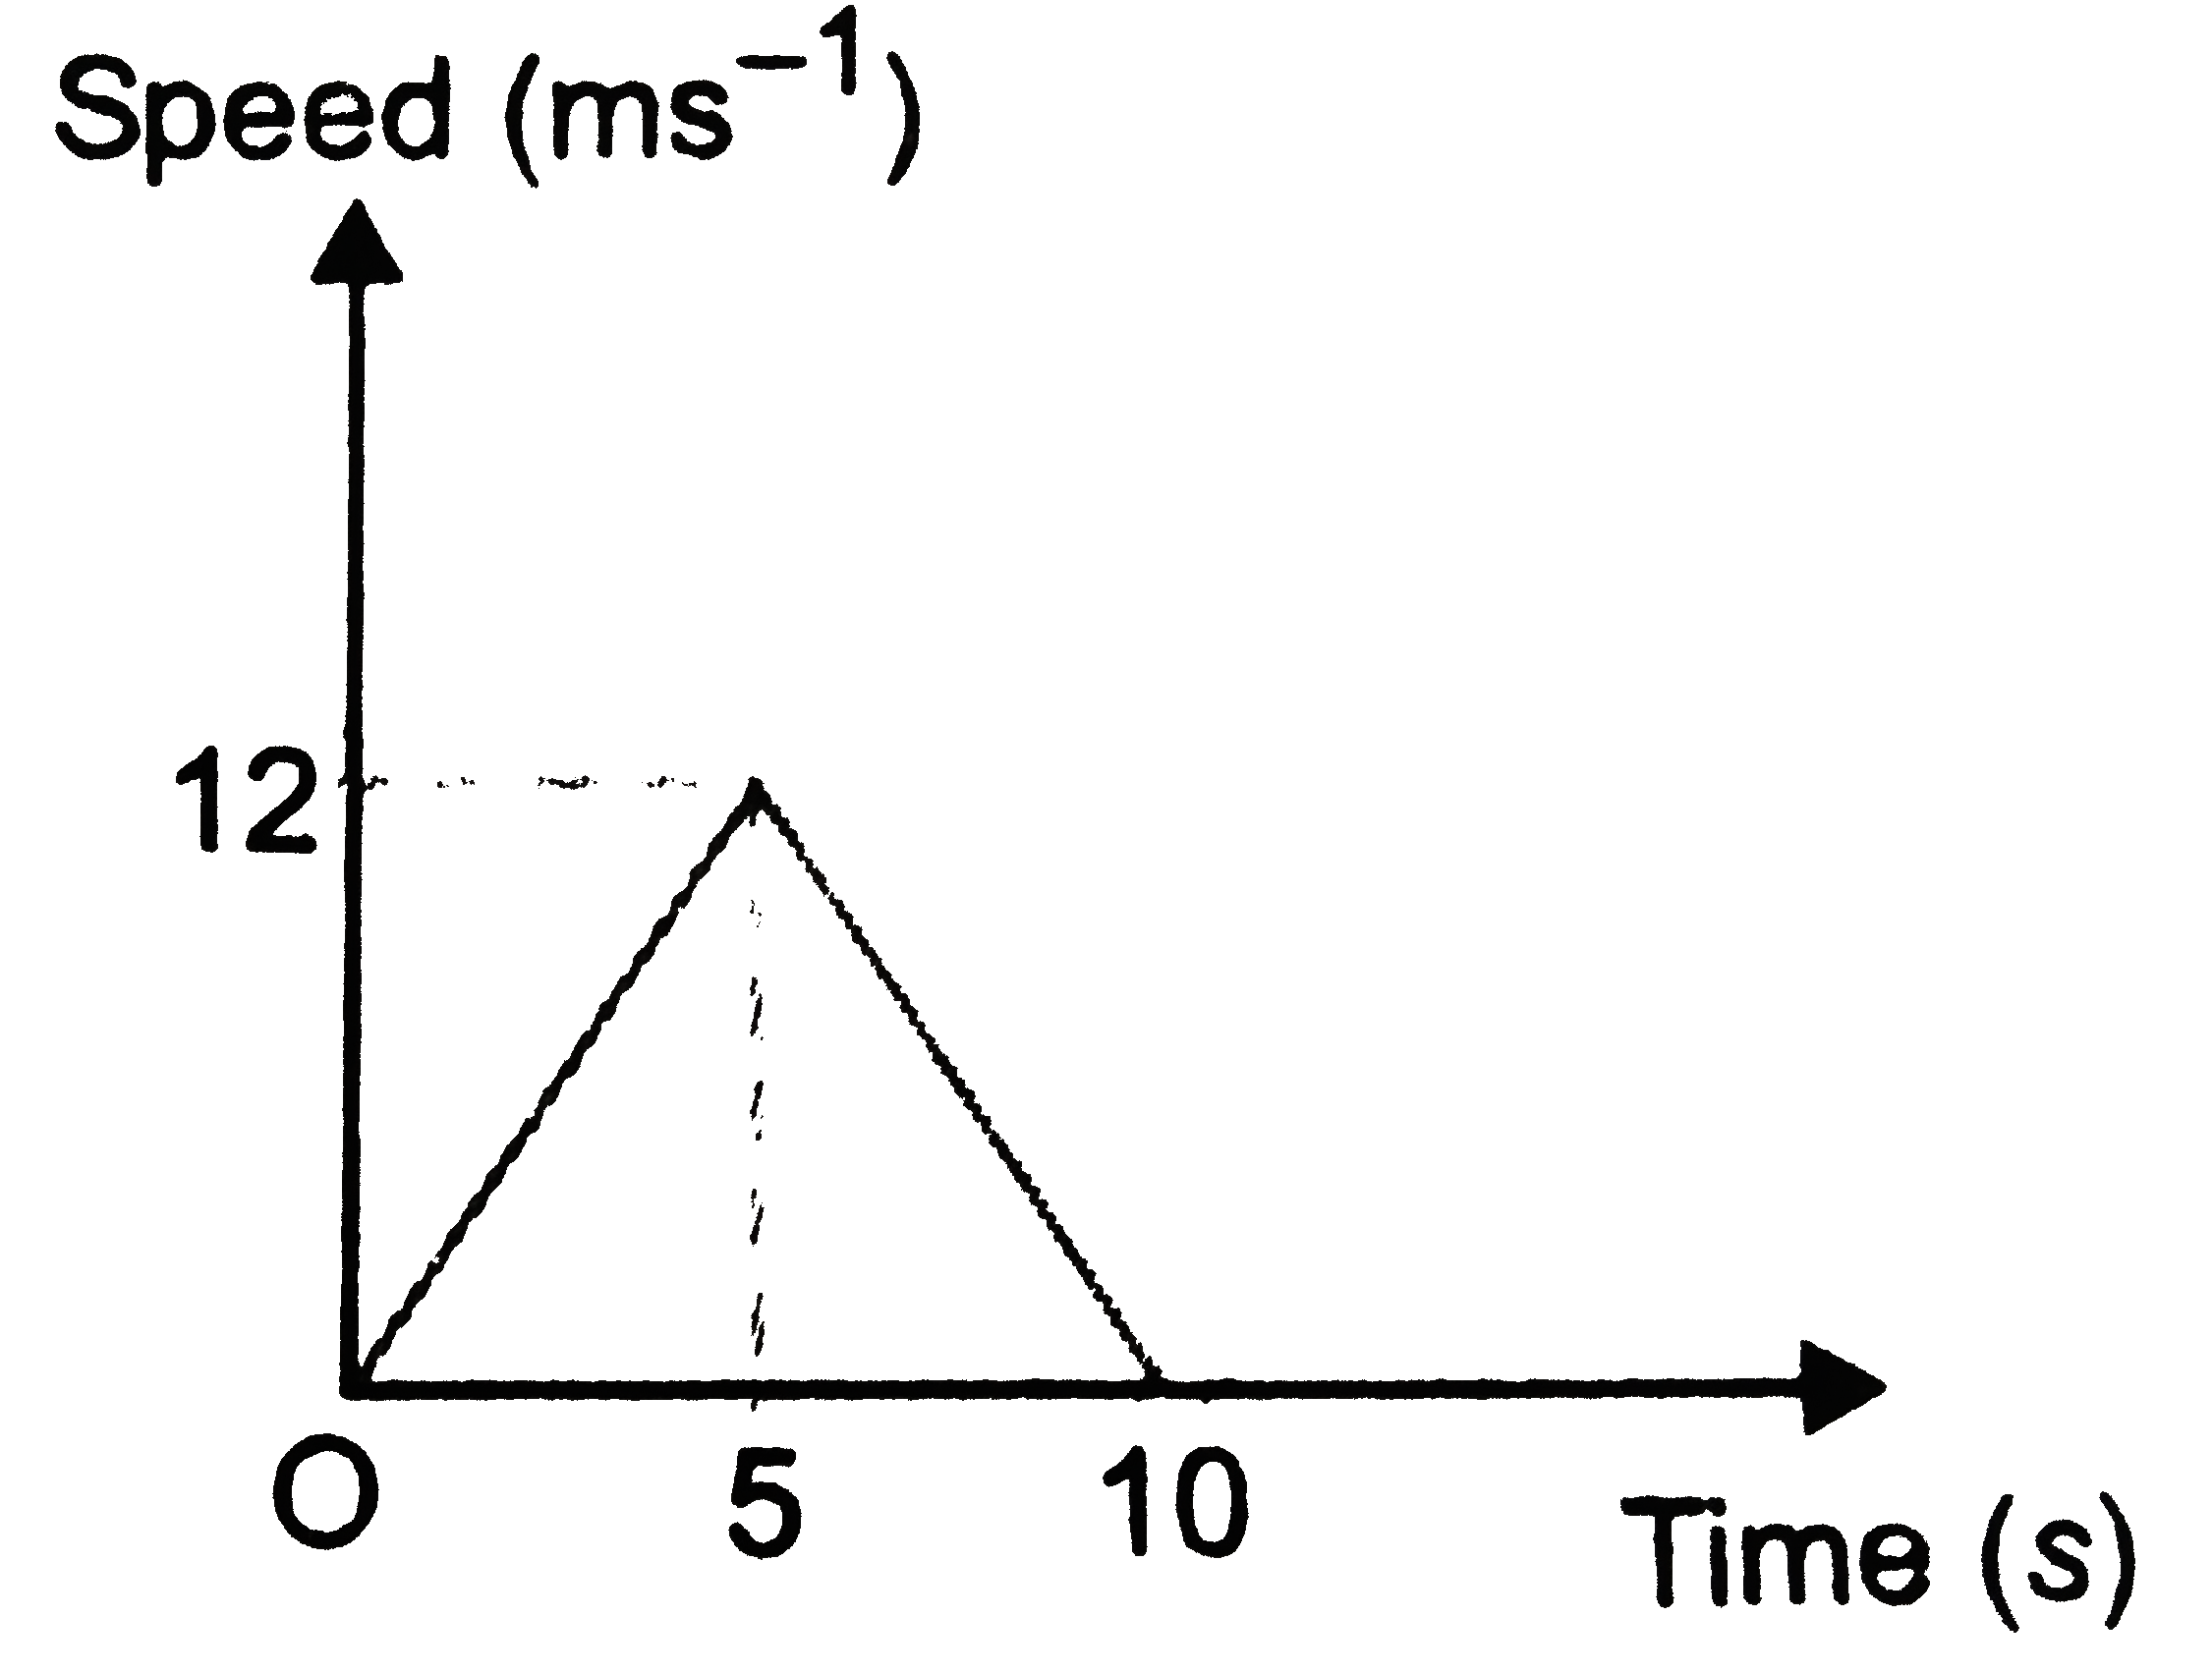 .
what is the average speed of the particle over the intervals?
View Solution

