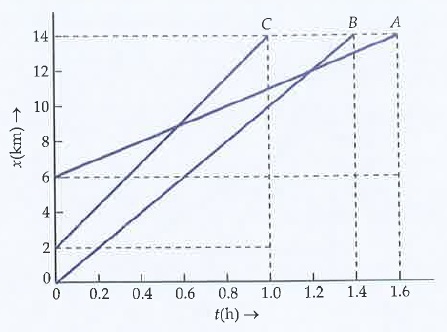
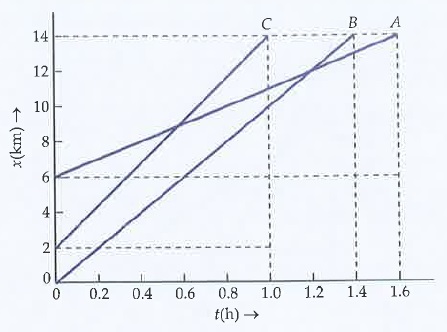
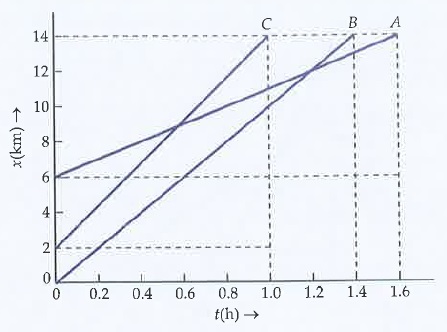
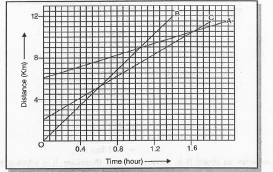
Figure 3.64 shows the position-time graphs of three car A, B and C. On the basis of the graphs, answer the following questions : How far did car A travel between the time it passed cars B and C ?
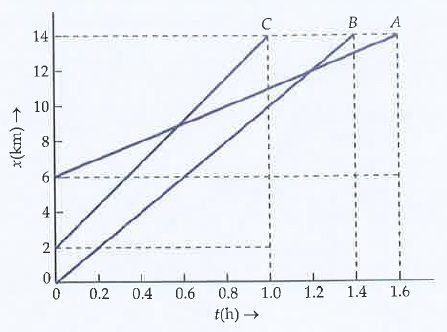
Step by step video & image solution for Figure 3.64 shows the position-time graphs of three car A, B and C. On the basis of the graphs, answer the following questions : How far did car A travel between the time it passed cars B and C ? by Physics experts to help you in doubts & scoring excellent marks in Class 11 exams.
Topper's Solved these Questions
Similar Questions
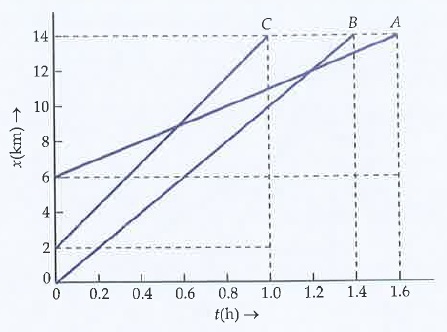
Figure 3.64 shows the position-time graphs of three car A, B and C. On the basis of the graphs, answer the following questions : When A passes C, where is B ?
 View Solution
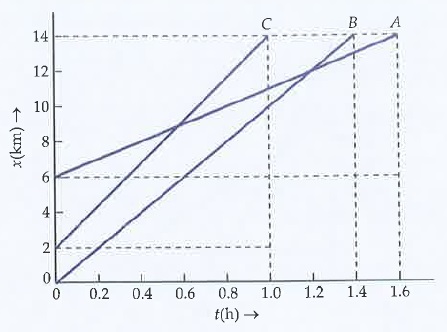
Figure 3.64 shows the position-time graphs of three car A, B and C. On the basis of the graphs, answer the following questions : Are the three cars ever at the same point on the road ?
 View Solution
Knowledge Check
- Question 1 - Select One
Figure shows position-time graph of two cars A and B.
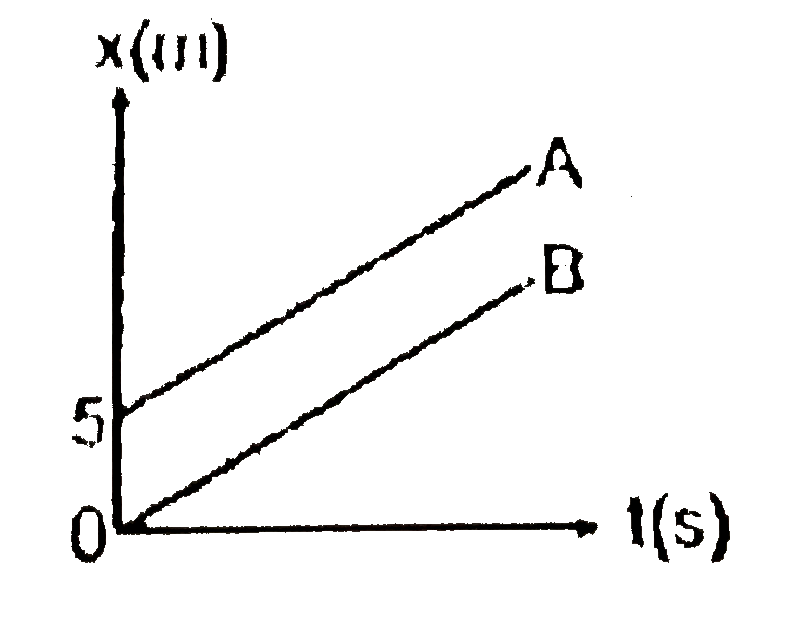 ACar A is faster than car B.BCar B is faster than car A.CBoth cars are moving with same velocity.DBoth cars have positive acceleration.
Figure 3.64 shows the position-time graphs of three car A, B and C. On the basis of the graphs, answer the following questions : Which car has the highest speed and which the lowest ?
 View Solution
Figure shows the position-time graphs of three car A, B and C. On the basis of the graphs, answer the following questions : What is the relative velocity of car B with respect to car C ?
 View Solution
Figure shows the position-time graphs of three car A, B and C. On the basis of the graphs, answer the following questions : What is the relative velocity of car C with respect to car A ?
 View Solution
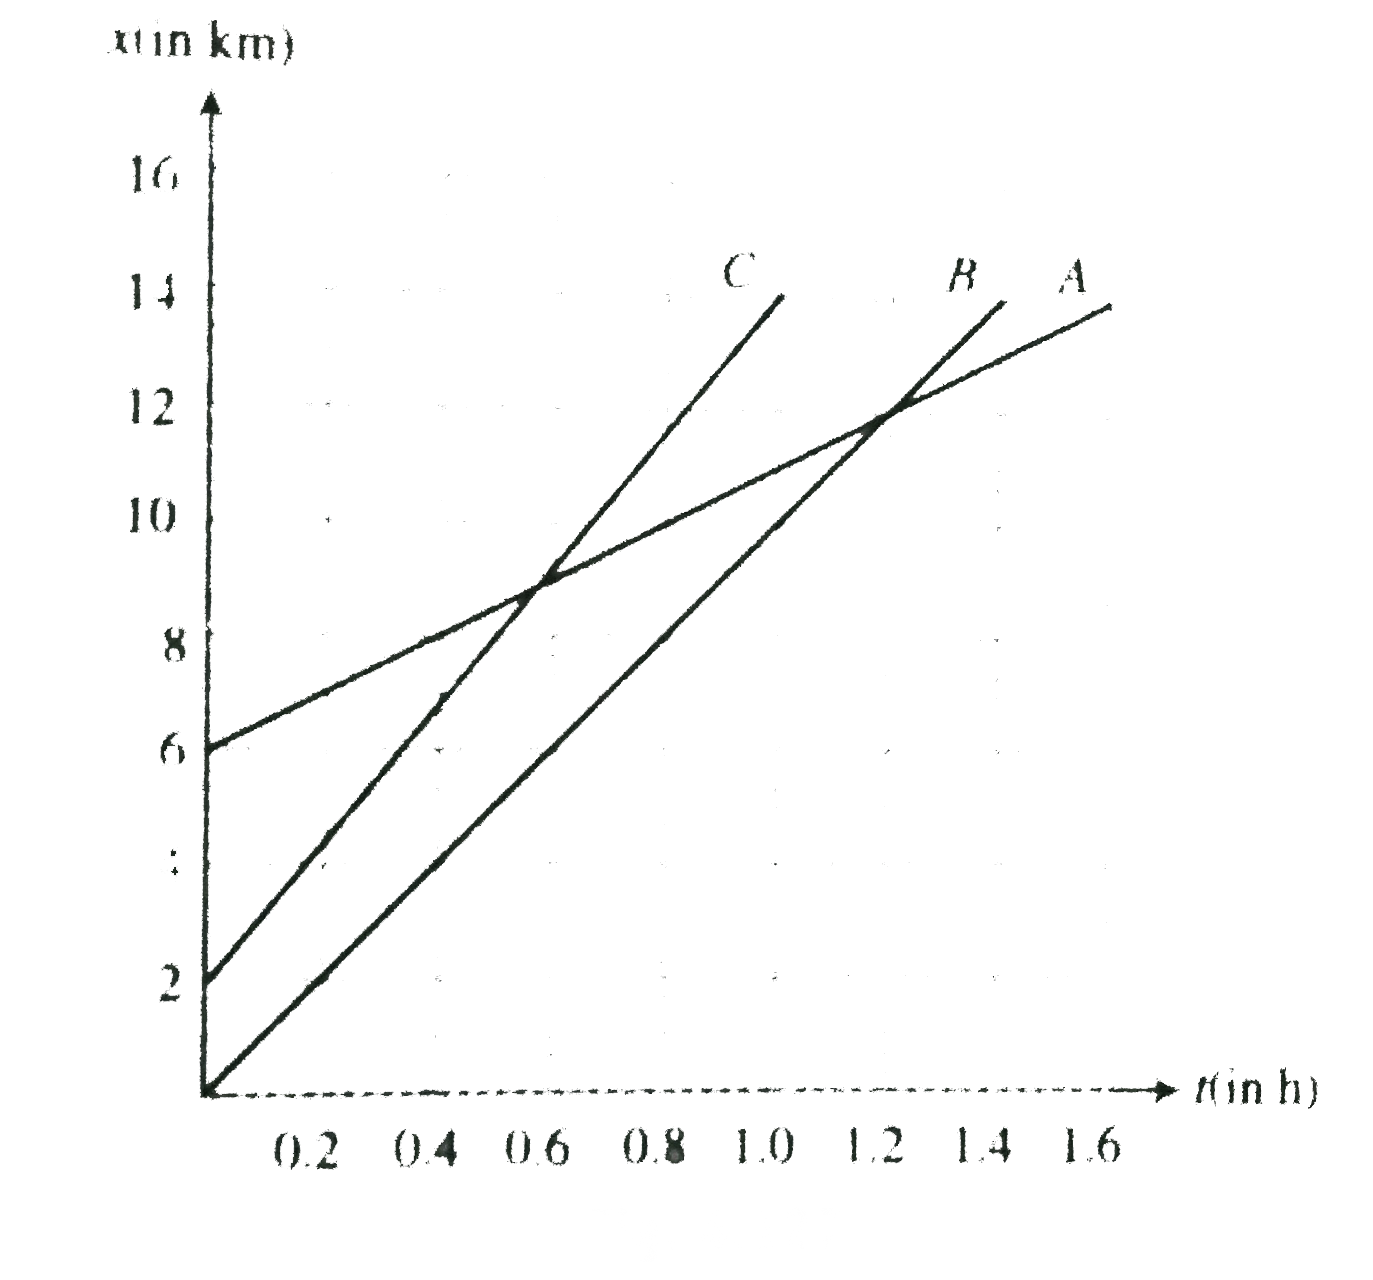
Shows the position-time graphs of three cars A,B and C On the basis of the graphs answer the follwing questions:
 .
.
a. Which car has the highest speed and which the lowest?
b. Are the three cars evrs at the same point on the road?
c. When C passes A, wher is B?
d. What is the time interval during car A travel between the time it passed cars B and C ?.
e. What is the relative velocty of car B with respect to car C?View SolutionFig 1.11 show the distance - time graphs of three A,B and C. Study the graph and answer the following question : How far has C travelled when B passes A ?
 View Solution
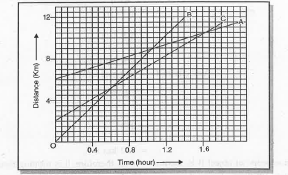
Fig 1.11 show the distance - time graphs of three A,B and C. Study the graph and answer the following question : Which of the three is travelling the fastest ?
 View Solution
Figure shows the distance-time graph of three object A,B and C. Study the graph and answer the following questions :
(a) Which of the three is travelling the fastest ?
(b) Are all three ever at the same point on the road ?
( c) How far has C travelld by when B passes A ?
(d) How far has B travelled by the time it passes C ?View Solution
