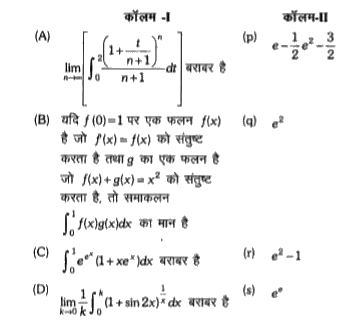
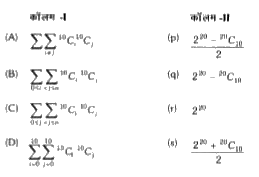
निम्नलिखित कॉलम I को कॉलम II से मिलाये

The correct Answer is:A→r;B→p;C→s;D→q
Step by step video, text & image solution for निम्नलिखित कॉलम I को कॉलम II से मिलाये by Maths experts to help you in doubts & scoring excellent marks in Class 12 exams.
Updated on:21/07/2023Topper's Solved these Questions
- निश्चित समाकलन एवं वक्रों से घिरा क्षेत्रफल BOOK - ERRORLESS HINDICHAPTER - निश्चित समाकलन एवं वक्रों से घिरा क्षेत्रफल EXERCISE - JEE ADVANCED (Integer type questions)
17 Videos
- द्विपद प्रमेय तथा गणितीय आगमन BOOK - ERRORLESS HINDICHAPTER - द्विपद प्रमेय तथा गणितीय आगमन EXERCISE - JEE Advanced (Matrix Math type questions)
5 Videos
- प्रायिकताBOOK - ERRORLESS HINDICHAPTER - प्रायिकताEXERCISE - EXERCISE
99 Videos
Similar Questions
दिया है कि किसी वास्तविक संख्या x के लिए [x], अधिकतम पूर्णांक को दर्शाता है यदि अन्तराल [−10,10] पर वास्तविक मानो वाला फलन f निम्न प्रकार से परिभाषित है f(x)={x−[x],यदि [x] विषम है,1+[x]−x, यदि [x] सम है तो π210∫10−10f(x)cosπxdx का मान है
View Solutionनिम्नलिखित कॉलम I को कॉलम II से मिलाये

View SolutionA, B, C तीन परस्पर स्वतंत्र घटनायें हैं। S1 तथा S2 दो कथनों को देखने पर
S1 : A तथा B∪C स्वतन्त्र हैं
S2 : A तथा B∩C स्वतन्त्र हैं तब
View SolutionIdentify the cell organelle 'A' :-
ltimg src="https://d10lpgp6xz60nq.cloudfront.net/physics_images/ALN_BIO_C10_E08_018_Q01.png" width="80%"gt
View SolutionHow many lines of symmetry does the above figure have ?
View SolutionWhich of the following are correct chain isomers of butane ? (i)
View SolutionDetermine the point of symmetry of a regular hexagon.
View SolutionDtermine the images of the following figure about the given line :
View SolutionMatch the following Column A to Column B

View SolutionMatch the following Column A to Column B

View SolutionMatch the following Column A to Column B

View SolutionFind the area of the figure given below.

View SolutionThe inequation represented by the graph given below is :
View SolutionThe inequation that best describes the graph given below is _________
View SolutionThe inequation that best describes the following graph is _________
View SolutionWhich inequations represent the shaded region in the given figure
View Solution
