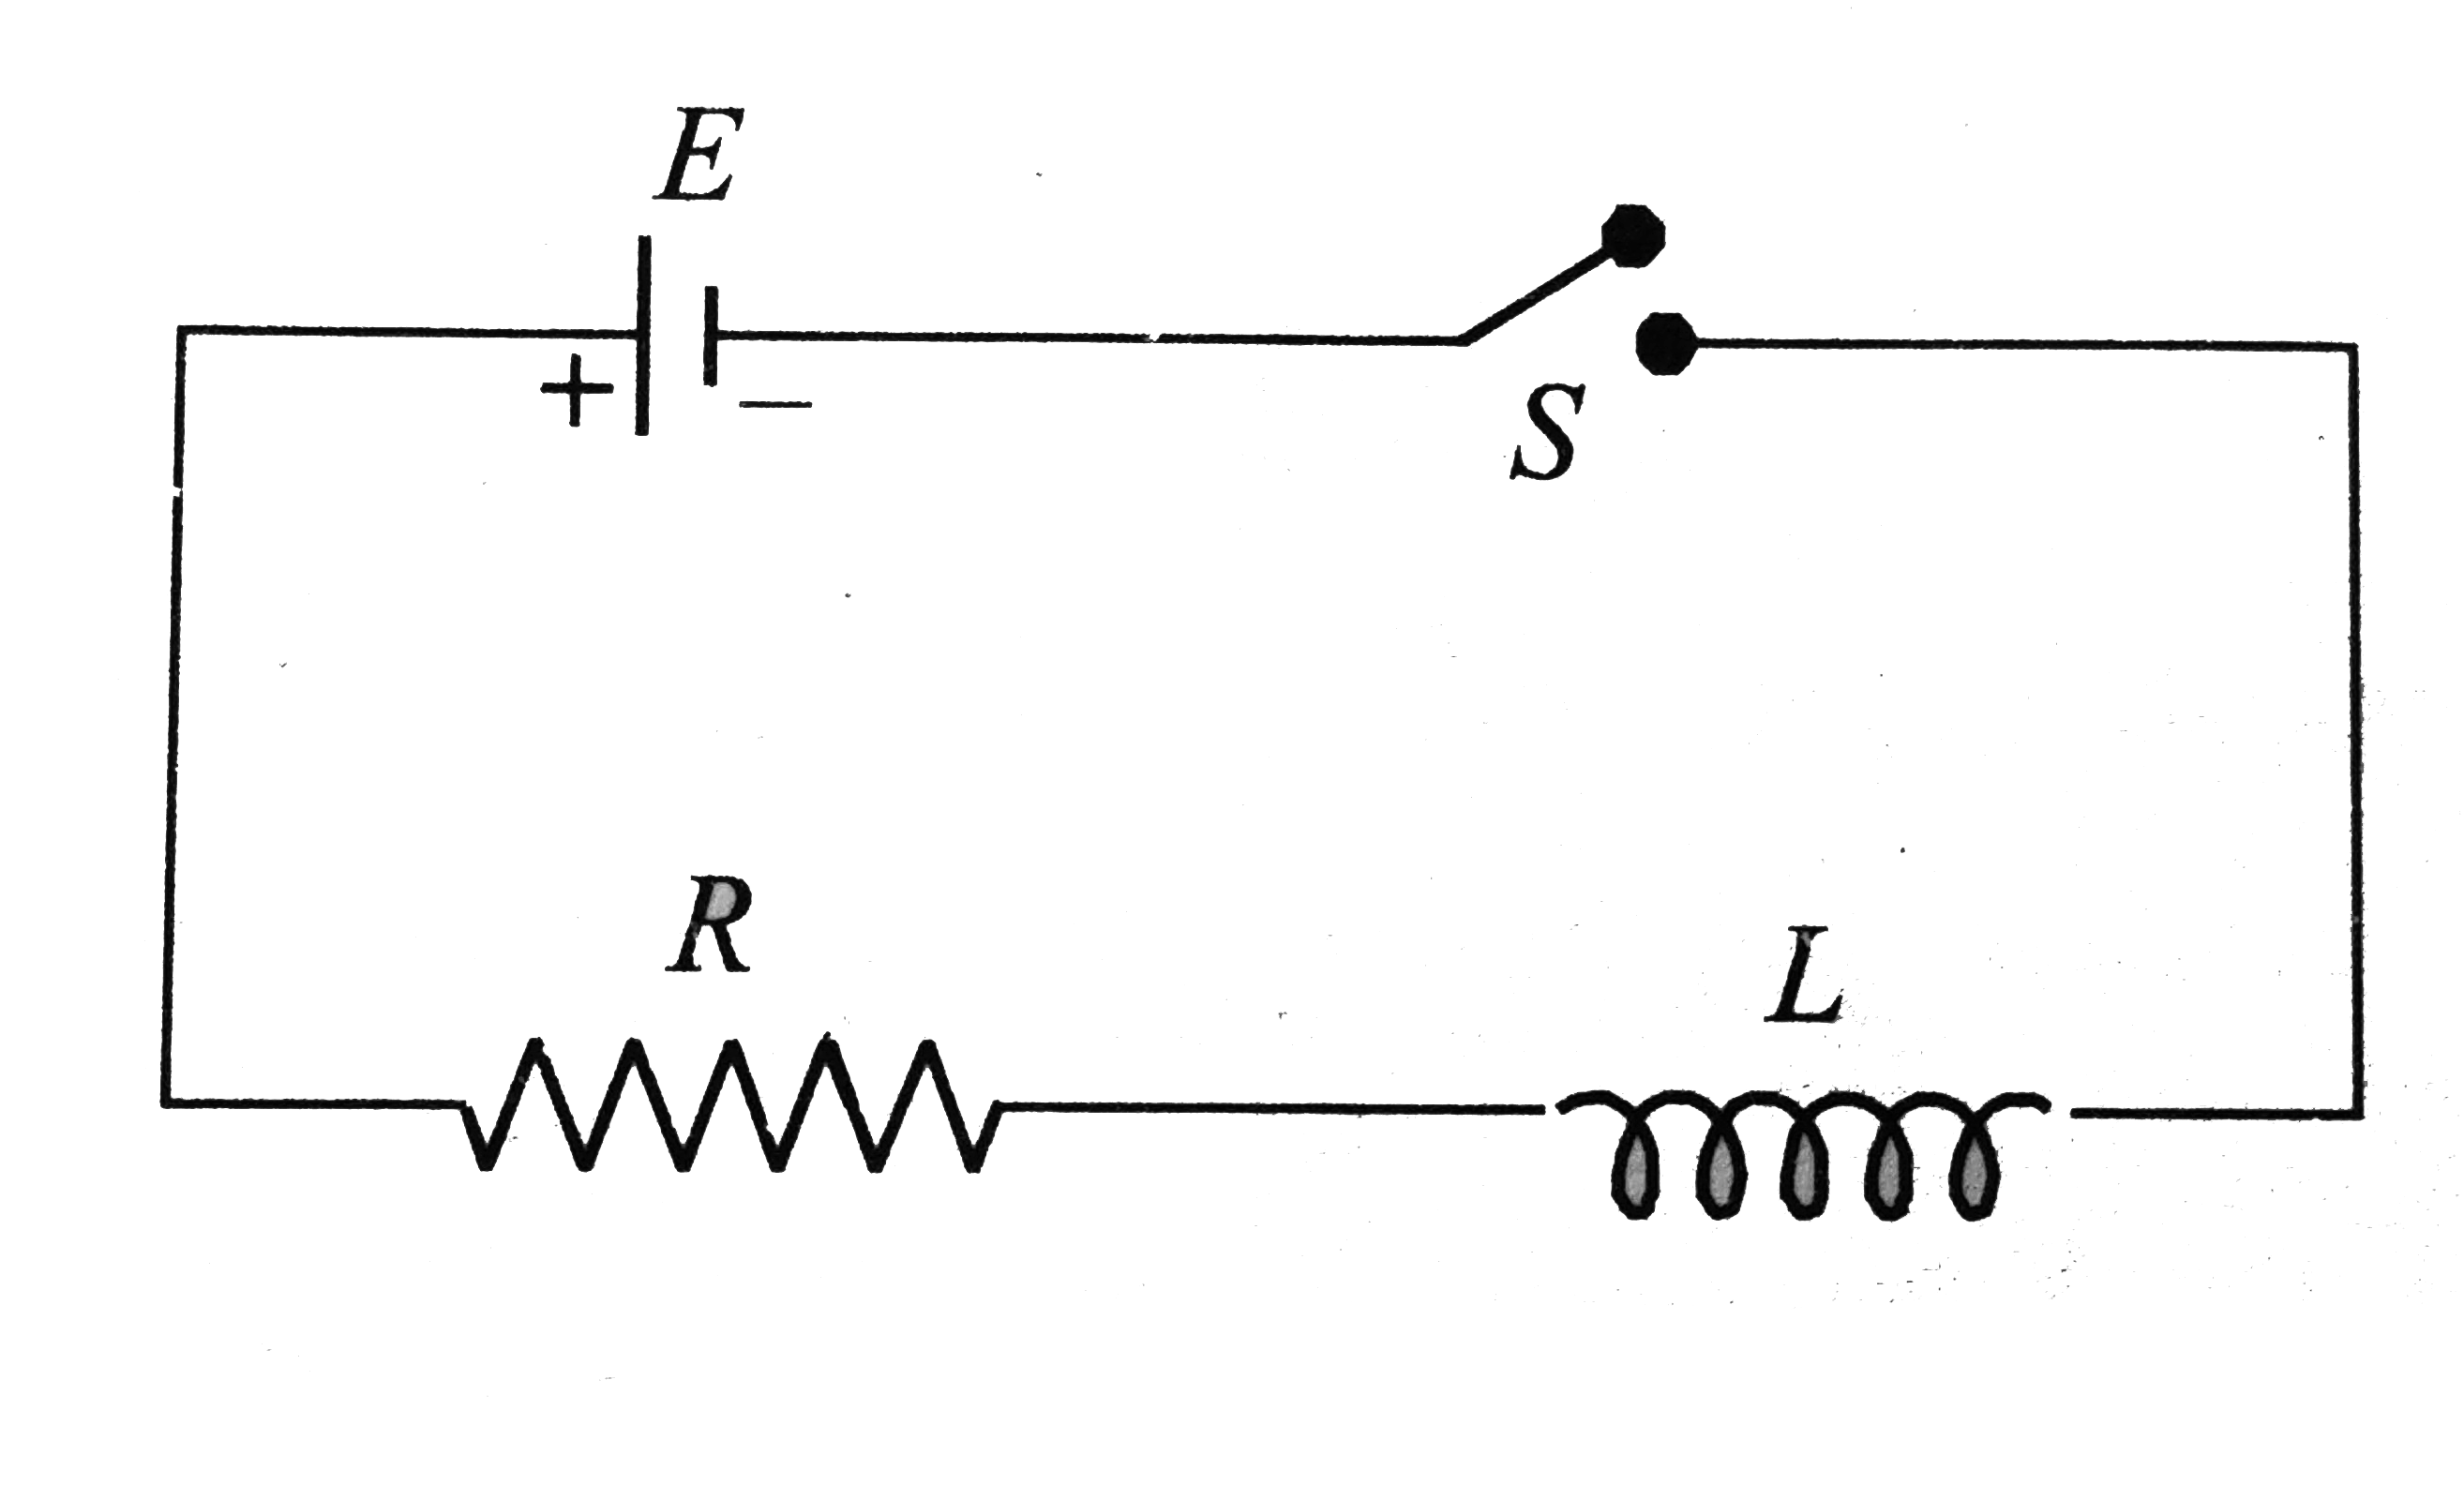
In an L-R circuit connected to a battery of constant emf E, switch is closed at time t =0. If en denotes the induced emf across the inductor and i the current in the circuit at any time t. Then the graph shows the correct variation of .e. with .i. is
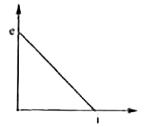
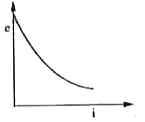
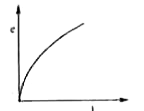
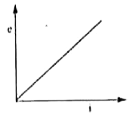
The correct Answer is:A
Topper's Solved these Questions
- ELECTROMAGNETIC INDUCTIONBOOK - AAKASH SERIESCHAPTER - ELECTROMAGNETIC INDUCTIONEXERCISE - EXERCISE - I (ASSERTION AND REASON)
14 Videos
- ELECTROMAGNETIC INDUCTIONBOOK - AAKASH SERIESCHAPTER - ELECTROMAGNETIC INDUCTIONEXERCISE - EXERCISE - II (MAGNETIC FLUX, FARADAY.S LAW, LENZ.S LAW , AC GENERATOR)
10 Videos
- ELECTROMAGNETIC INDUCTIONBOOK - AAKASH SERIESCHAPTER - ELECTROMAGNETIC INDUCTIONEXERCISE - EXERCISE - I (MAGNETIC FLUX, FARADAY.S LAW, LENZ.S LAW, AC GENERATOR)
26 Videos
- ELECTRIC FIELD AND POTENTIALBOOK - AAKASH SERIESCHAPTER - ELECTRIC FIELD AND POTENTIALEXERCISE - PROBLEMS (LEVEL-II)
32 Videos
- ELECTROMAGNETIC WAVESBOOK - AAKASH SERIESCHAPTER - ELECTROMAGNETIC WAVESEXERCISE - EXERCISE -II
20 Videos
Similar Questions
In an L-R circuit connected to a battery of constant emf E, switch is closed at time t=0. If e denotes the induced emf across inductor and I the current in the circuit at any time t. Then which of the following graphs shown the variation of e with i?
View SolutionSwitch S of the circuit shows in Fig. is closed at t=0. If e denotes the induced emf in L and i the current flowing through the circuit at time t, then which of the following graphs correctly represents the variation of e with i?
View Solution
Knowledge Check
In an L-R circuit connected to a battery of constant emf E, switched is closed at time t=0. If denotes the induced emf across inductor and I the current in the circuit at any time t. Then which of the following graphs shown the variation of e with i?
A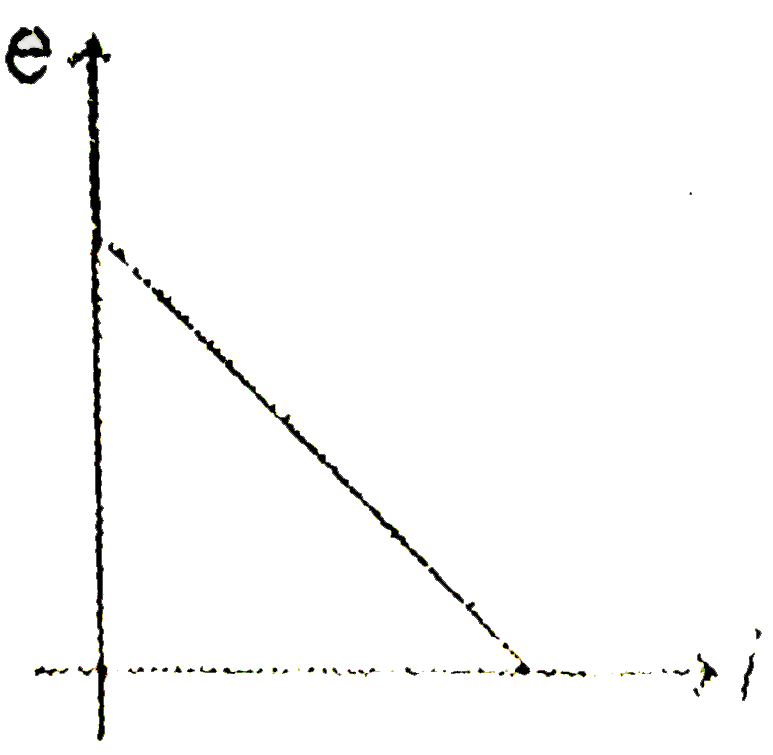 B
B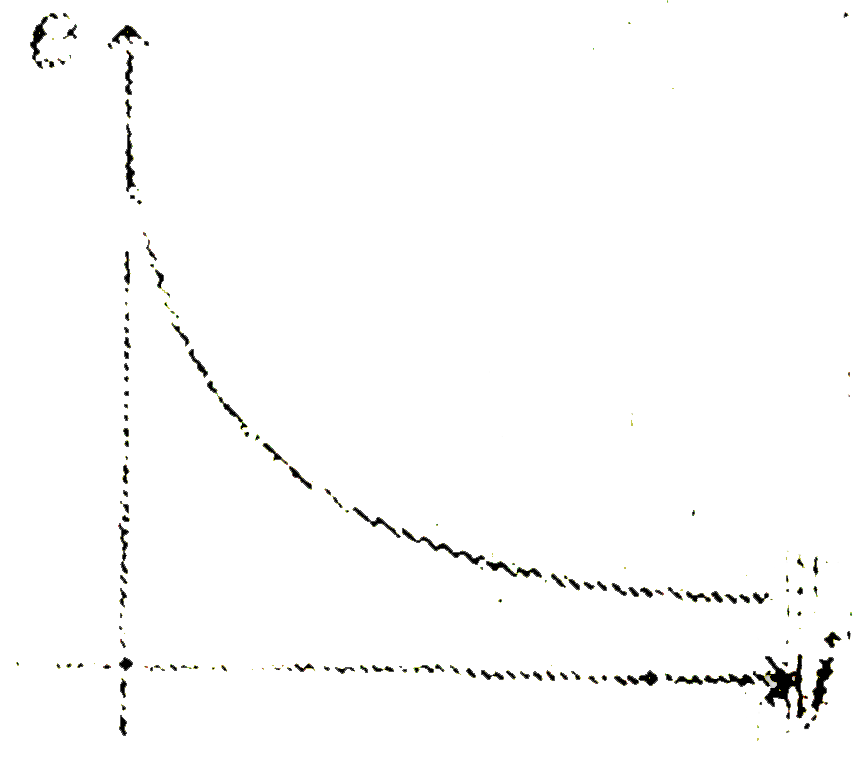 C
C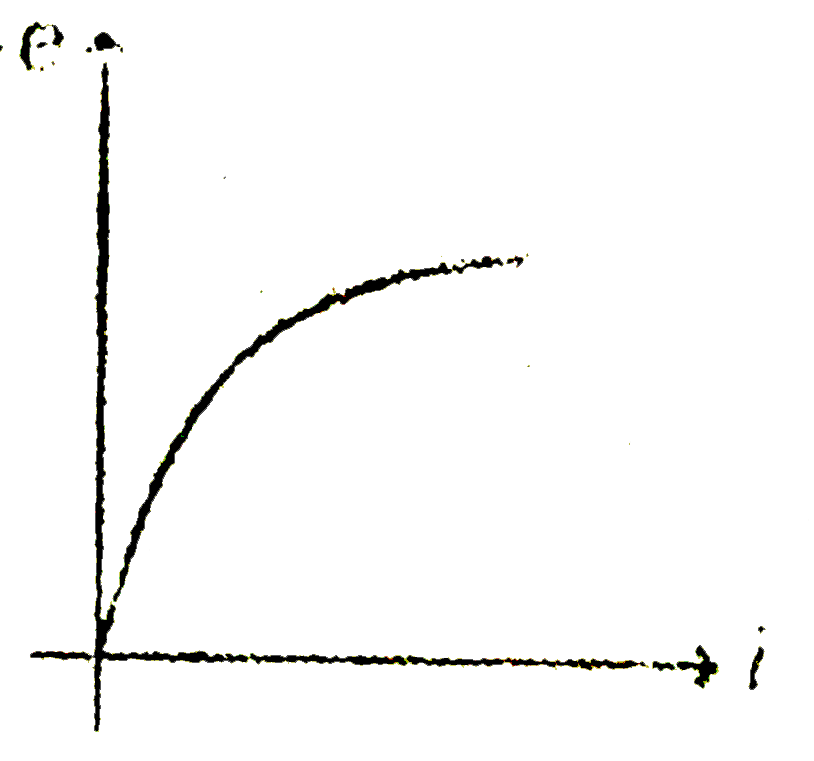 D
D
In an L-R circuit connected to a battery of constant e.m.f. E switch S is closed at time t=0. If e denotes the magnitude of induced e.m.f. across inductor and i the current in the circuite at any time t. Then which of the following graphs shows the variation of e with i?
A B
B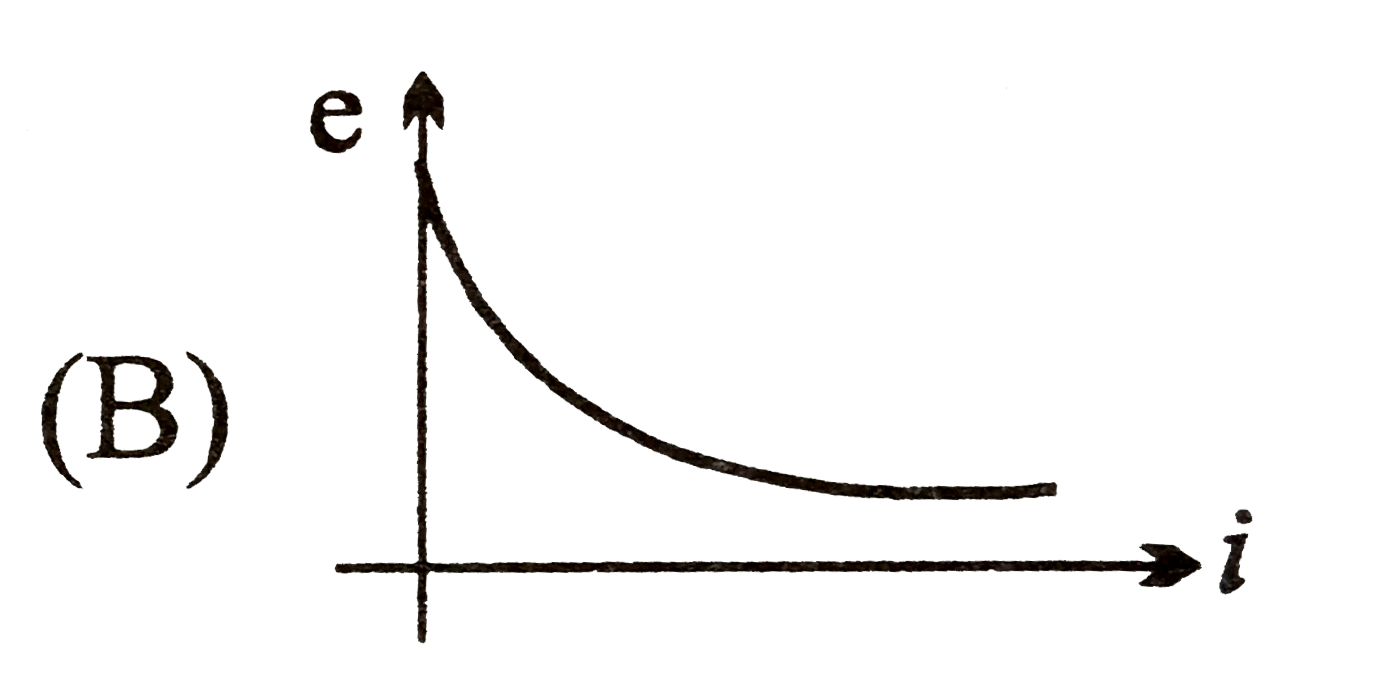 C
C D
D
Switch S of the circuit shows in Fig. is closed at t=0. If e denotes the induced emf in L and i the current flowing through the circuit at time t, then which of the following graphs correctly represents the variation of e with i?
 A
A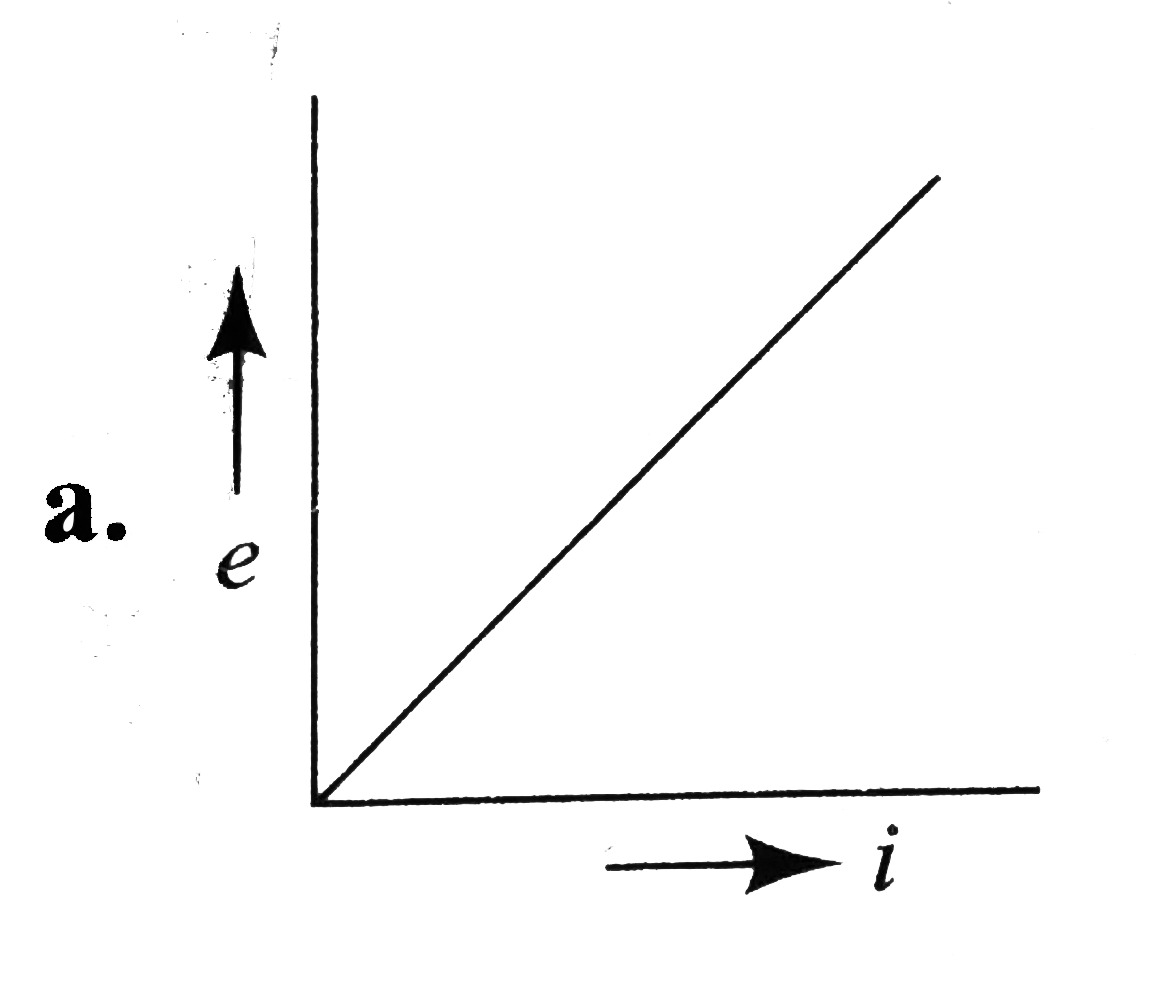 B
B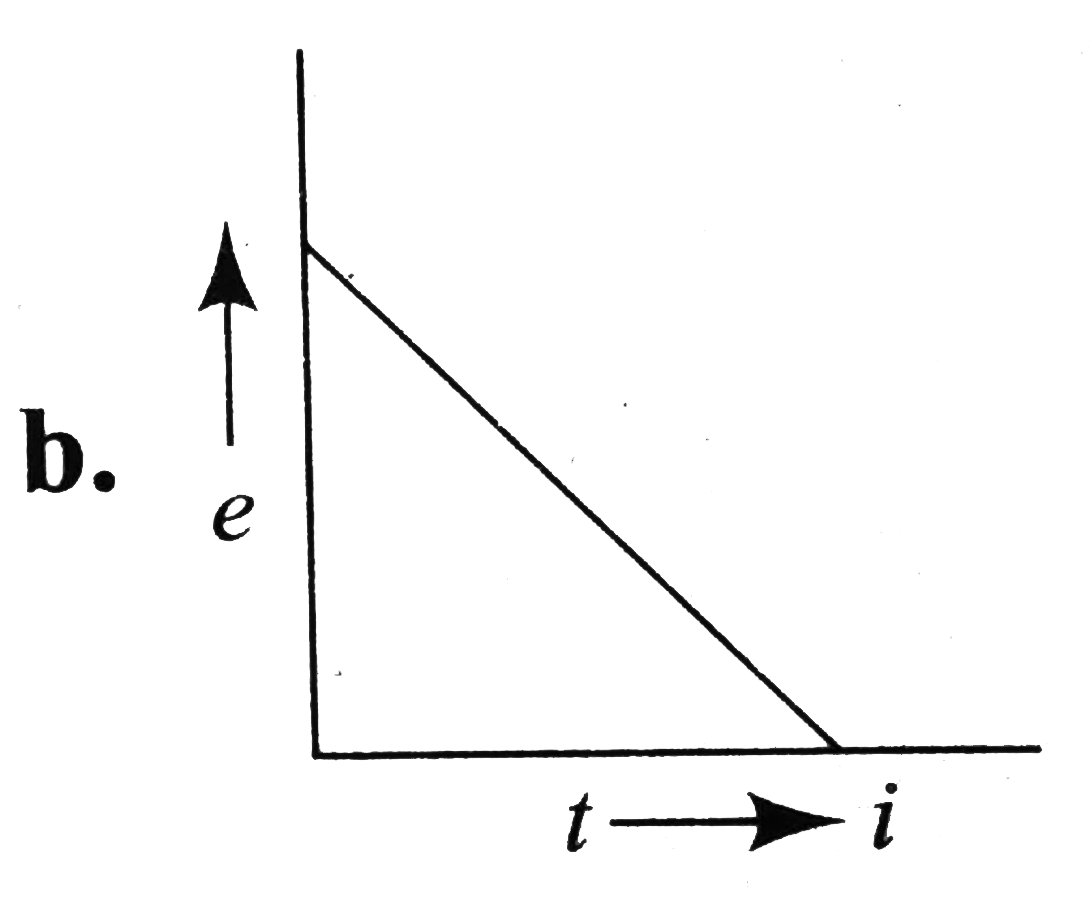 C
C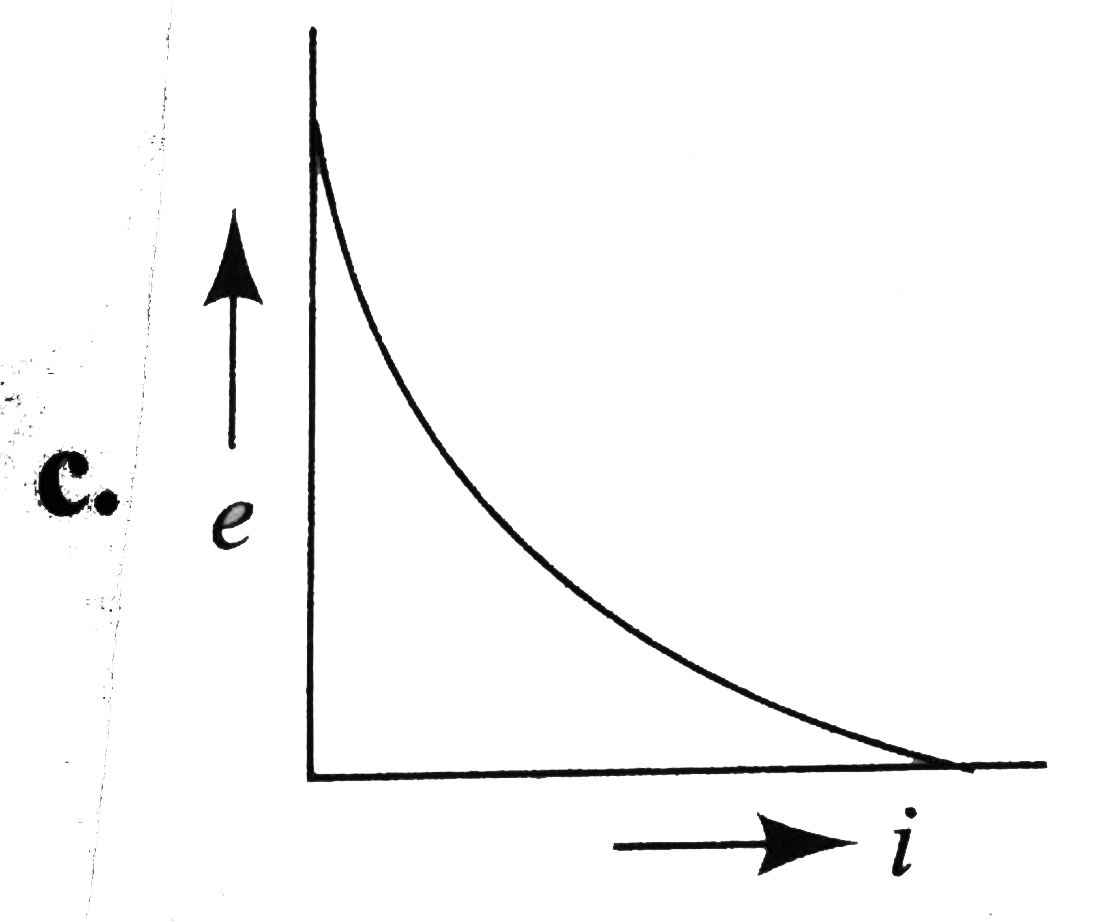 D
D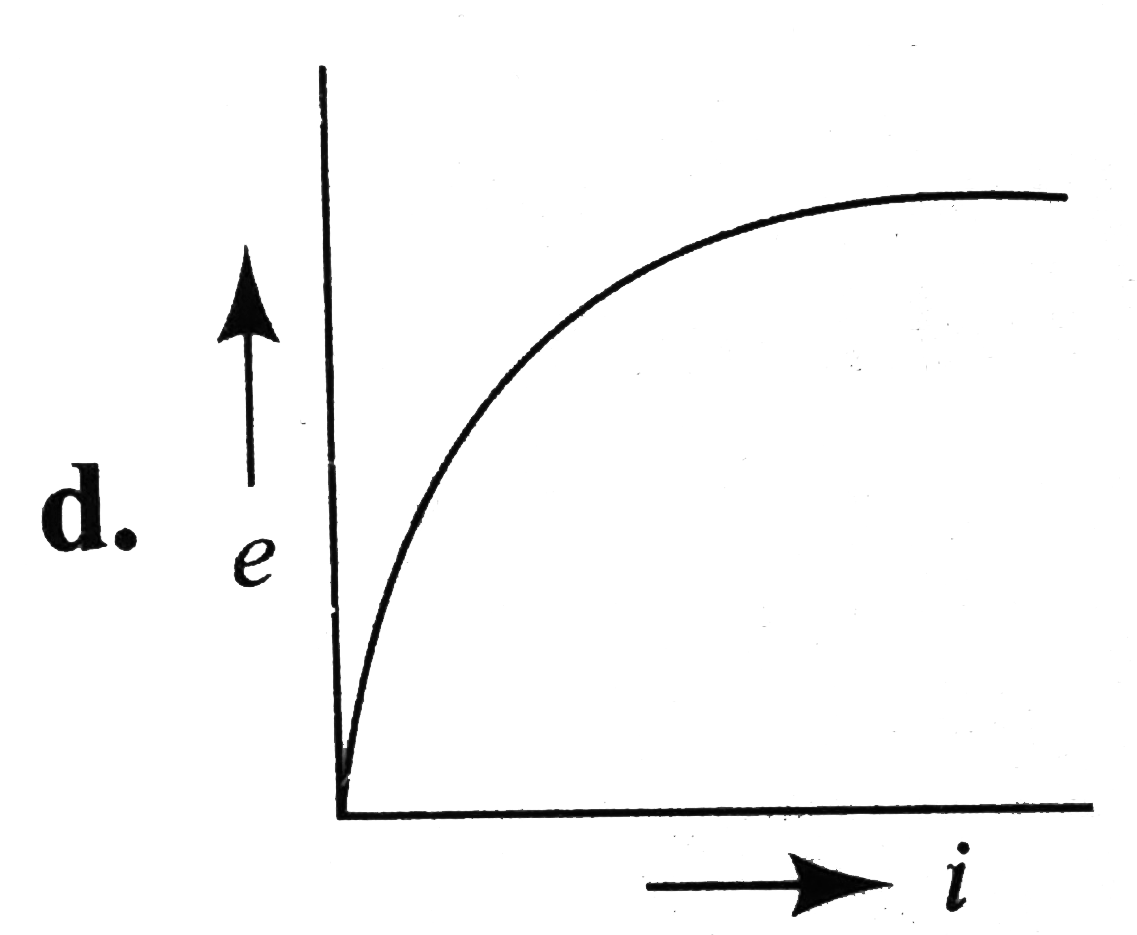
Switch S of the circuit shows in Fig is closed at t=0. If e denotes the induced emf in L and I is the current flowing through the circuit at time t, which of the following graphs is//are correct?

View SolutionIn the circuit shown in figure, the switch S is closed at t=0. If VL is the voltge induced across the inductor and i is the instantaneous current, the correct variation of VL versus is given by
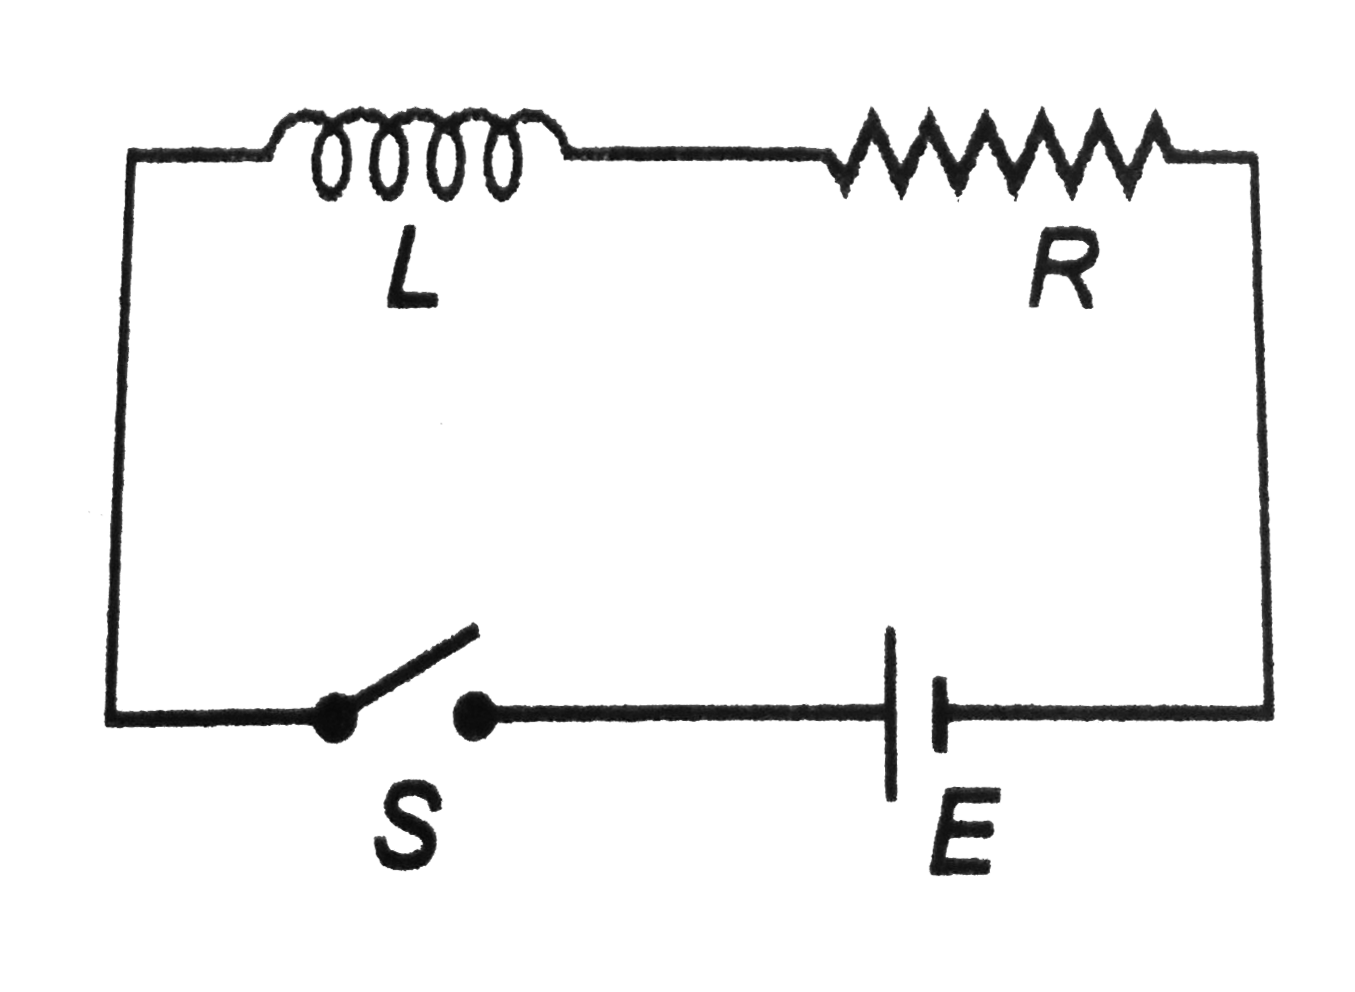
View SolutionIn the circuit shown, switch S is closed at time t=0. Find the current through the inductor as a function of time t.
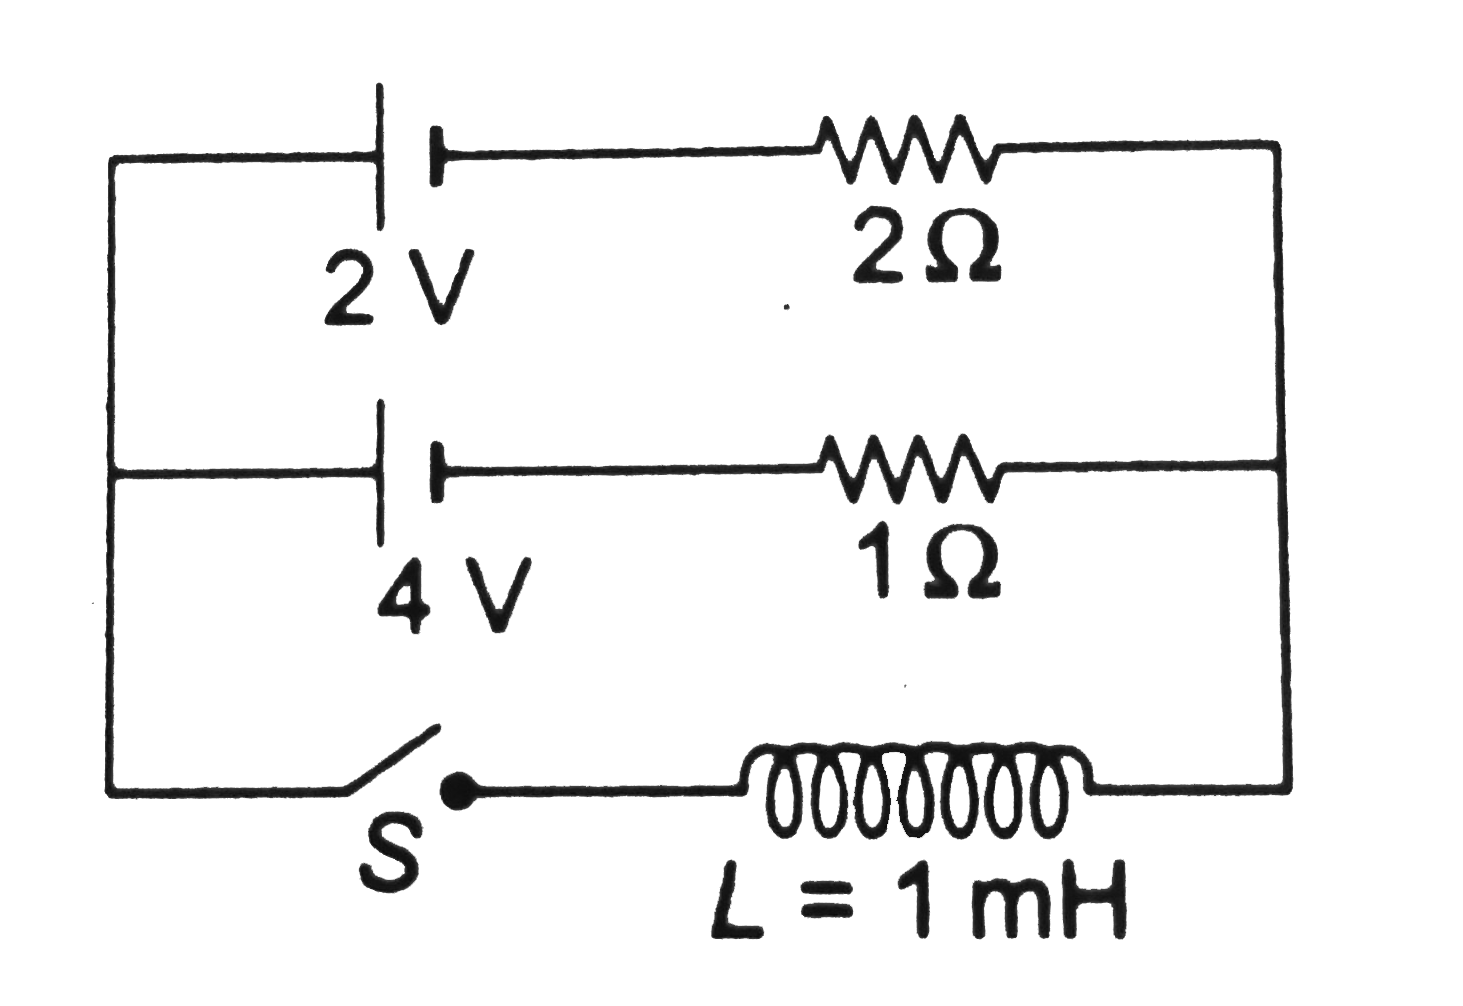
View SolutionSwitch S of the circuit shows in Fig is closed at t=0. If e denotes the induced emf in L and I is the current flowing through the circuit the circuit at time t, which of the following graphs is//are correct?

View SolutionIn the circuit shown in figure, the switch S is closed at t=0. If VL is the voltge induced across the inductor and i is the instantaneous current, the correct variation of VL versus is given by

View Solution
